DLP Projector Market by Light Source (Lamp, LED, and Laser), Chip Model, by Brightness, Throw Distance (Normal Throw, Short Throw, and Ultra-short Throw), Application, and by Geography (The Americas, Europe, APAC, and RoW) - Global Forecast to 2025


DLP Projector Market Summary
The DLP Projector Market is expanding as organizations and consumers demand high-quality visual displays for education, business presentations, home entertainment, digital signage, simulation, and large-venue applications. The market is estimated at US$ 4.0 Billion - US$ 4.5 Billion in 2025 and is projected to reach US$ 6.8 Billion - US$ 7.8 Billion by 2035 at a CAGR of 5.5% - 6.2% from 2025 to 2035. Growth is supported by increasing demand for high-resolution projection, laser-based illumination, immersive entertainment, digital classrooms, corporate collaboration, large-format visualization, and portable projectors. The integration of AI, IoT, wireless connectivity, edge computing, and automated image optimization is also improving projector functionality and user experience.
Key Market Trends & Insights
North America is expected to remain the leading regional market, supported by strong demand for business presentation systems, education technology, home entertainment, simulation, and advanced display solutions.
Asia Pacific is projected to be the fastest-growing region, driven by expanding education infrastructure, digitalization, rising consumer electronics demand, entertainment investments, and growing adoption of laser projection systems.
Laser DLP projectors represent a major growth segment, as laser illumination provides longer operating life, consistent brightness, lower maintenance requirements, and improved suitability for professional applications compared with conventional lamp-based systems.
The market is shifting toward 4K and high-resolution projection, particularly in home theaters, corporate visualization, simulation, museums, entertainment venues, and premium education environments.
AI is increasingly being incorporated into projector systems for automatic keystone correction, autofocus, image optimization, obstacle detection, ambient-light adjustment, and intelligent content management.
Wireless connectivity is also transforming the market. Wi-Fi, Bluetooth, cloud platforms, screen mirroring, and IoT connectivity enable projectors to become integrated components of smart classrooms, meeting rooms, entertainment systems, and digital environments.
Market Size & Forecast
-
Base year market size: US$ 4.0 Billion - US$ 4.5 Billion in 2025
-
Forecast market value: US$ 6.8 Billion - US$ 7.8 Billion by 2035
-
CAGR: 5.5% - 6.2% from 2025 to 2035
-
Growth factors: Laser illumination, 4K projection, digital education, home entertainment, corporate collaboration, immersive visualization, smart connectivity, and AI-enabled image optimization will support market growth.
DLP technology remains attractive because it can provide sharp images, high contrast, fast response, and reliable performance. The combination of DLP imaging with laser light sources is creating opportunities in applications where long operating life and reduced maintenance are important.
AI-Powered Military Transformation: The Future of Smart Combat and Defense Top 10 Key Takeaway
-
The DLP Projector Market is projected to grow from US$ 4.0 Billion - US$ 4.5 Billion in 2025 to US$ 6.8 Billion - US$ 7.8 Billion by 2035.
-
The market is expected to expand at a 5.5% - 6.2% CAGR from 2025 to 2035.
-
North America is expected to remain the leading regional market.
-
Asia Pacific is projected to record the fastest growth.
-
Laser-based DLP projectors are gaining market share because of their long operating life and lower maintenance.
-
4K and higher-resolution projection is increasing demand in premium applications.
-
Education remains an important application for interactive and digital learning environments.
-
AI is improving autofocus, keystone correction, image quality, and obstacle detection.
-
Wireless and IoT connectivity are making projectors easier to integrate into smart environments.
-
Home entertainment, immersive experiences, and professional visualization will create new growth opportunities.
Product Insights
Laser DLP projectors are expected to represent one of the strongest product segments because laser illumination addresses several limitations associated with conventional projector lamps. Laser sources can provide long operating life, rapid startup, consistent brightness, and reduced maintenance requirements, making them suitable for classrooms, conference rooms, museums, entertainment venues, digital signage, and large-format visualization.
Portable and compact DLP projectors are also gaining traction among consumers and mobile professionals. Mini projectors can connect wirelessly with smartphones, laptops, streaming platforms, and other devices, allowing users to create large-screen experiences in different locations.
4K DLP projectors represent another important growth category. The increasing availability of high-resolution content is creating demand for sharper projection in home theaters, gaming, corporate visualization, simulation, and professional environments.
Interactive projectors are gaining importance in education and collaborative environments. These systems can support touch or pen interaction and integrate with digital learning platforms.
Future products are expected to incorporate AI-powered features such as automatic screen alignment, intelligent autofocus, obstacle avoidance, adaptive brightness, content optimization, and voice-controlled operation. These capabilities can reduce setup complexity and make projectors easier to use.
Technology / Component Insights
The technology foundation of DLP projectors is based on Digital Micromirror Device (DMD) technology, in which microscopic mirrors control reflected light to create projected images. Improvements in DMD architecture, optical systems, image processing, and illumination technologies are supporting higher resolution and improved performance.
Laser and LED illumination are increasingly replacing conventional lamp technologies in many applications. Laser sources are particularly attractive for professional systems because they offer high brightness, long life, and stable performance.
Advanced image-processing technologies are also becoming increasingly important. High dynamic range, enhanced color processing, frame interpolation, high refresh rates, and sophisticated scaling technologies can improve visual quality.
AI is emerging as an additional layer of intelligence. Machine-learning algorithms can support automatic image correction, room-condition analysis, object detection, brightness adjustment, and predictive maintenance. For example, a projector can automatically detect the projection surface and adjust its geometry without requiring extensive manual configuration.
IoT connectivity enables projectors to communicate with centralized management platforms. Schools, enterprises, hotels, and entertainment venues can remotely monitor projector status, schedule maintenance, update firmware, and manage multiple devices.
Cloud connectivity and automation can further improve fleet management. IT administrators can identify devices requiring maintenance and monitor usage patterns across large installations.
Future innovation will focus on higher brightness, 8K-ready optical architectures, improved laser efficiency, AI-based image processing, wireless collaboration, compact optical engines, smart thermal management, and integrated cloud management.
Application Insights
Education remains a significant application for DLP projectors. Schools, universities, training centers, and educational institutions use projectors for classroom presentations, interactive learning, digital content, and collaborative teaching. As education becomes increasingly digital, projection systems are being integrated with interactive displays, learning platforms, wireless devices, and classroom-management systems.
Corporate applications represent another major opportunity. Conference rooms and collaboration spaces require reliable projection for presentations, video conferencing, data visualization, and hybrid meetings. Wireless screen sharing and automated setup are improving usability.
Home entertainment and gaming are also expanding. Consumers are increasingly interested in large-screen experiences without purchasing extremely large televisions. DLP projectors can provide flexible screen sizes for movies, gaming, sports, and streaming.
Entertainment venues such as cinemas, museums, theme parks, theaters, and immersive experience centers are creating demand for high-brightness projection systems. Projection mapping and large-scale visual effects provide additional opportunities.
Other applications include aerospace and defense simulation, healthcare visualization, retail environments, hospitality, digital signage, industrial training, and professional visualization.
The future opportunity will increasingly involve immersive environments, where multiple projectors work together with sensors, software, AI, and real-time content to create interactive visual experiences.
Regional Insights
North America is expected to remain the leading market due to established corporate technology infrastructure, strong education technology spending, widespread home entertainment adoption, and demand for professional visualization. The US remains a significant market for laser projectors, 4K systems, simulation, entertainment, and enterprise collaboration.
Europe represents a mature market supported by digital education, corporate modernization, cultural institutions, museums, entertainment venues, and sustainability-driven transitions toward energy-efficient laser projection.
Asia Pacific is projected to be the fastest-growing region through 2035. China, Japan, South Korea, India, and Southeast Asian economies are investing in education infrastructure, entertainment, smart classrooms, corporate digitalization, and advanced display technologies. Growing disposable income and expanding consumer electronics markets are also supporting home entertainment demand.
-
North America remains a leading market for professional and home projection.
-
Europe benefits from digital education and energy-efficient display technologies.
-
Asia Pacific is projected to record the fastest growth.
-
Education and entertainment are major regional application opportunities.
-
Laser projection is expanding across commercial and institutional environments.
Country Specific Market Trends
Within Asia Pacific, China is projected to grow at approximately 7.0% - 8.0% CAGR, supported by education digitalization, smart classrooms, consumer electronics, entertainment infrastructure, and commercial display deployments. Japan is expected to grow at approximately 5.8% - 6.7% CAGR, supported by advanced education technology, corporate visualization, home entertainment, gaming, and immersive experiences.
In North America, the United States is projected to expand at approximately 5.3% - 6.1% CAGR, driven by enterprise collaboration, education, home theaters, simulation, digital signage, and professional visualization. Canada could register approximately 5.0% - 5.8% CAGR, supported by education, corporate technology, entertainment, and digital transformation. Mexico is expected to achieve approximately 6.2% - 7.1% CAGR, benefiting from expanding education infrastructure, commercial applications, manufacturing, and consumer electronics adoption.
In Europe, Germany is projected to grow at approximately 5.0% - 5.8% CAGR, supported by corporate visualization, education, industrial training, entertainment, and advanced manufacturing. France is expected to expand at approximately 5.1% - 5.9% CAGR, driven by education, cultural venues, corporate applications, immersive entertainment, and digital infrastructure.
-
China is expected to be a major Asia Pacific growth engine.
-
Japan remains important for premium projection and immersive applications.
-
The US is the dominant North American demand center.
-
Mexico offers attractive growth opportunities from expanding digital infrastructure.
-
Germany and France remain important European professional-display markets.
Key Company Insights
Major companies operating across the DLP projector ecosystem include BenQ, Optoma, ViewSonic, Epson, Panasonic, Sony, Barco, Christie Digital, Acer, and LG Electronics. Competition is centered on image quality, brightness, resolution, portability, illumination life, connectivity, price, and software capabilities.
Manufacturers are increasingly developing laser-based projector portfolios to address professional and consumer demand for longer operating life and lower maintenance. Premium manufacturers are also emphasizing 4K resolution, high brightness, advanced color performance, and immersive visualization.
AI is becoming an increasingly visible product differentiator. Automated focus, keystone correction, image alignment, obstacle detection, and intelligent brightness adjustment can reduce installation and operating complexity.
Companies are also strengthening wireless connectivity and ecosystem integration. Modern projectors increasingly support screen mirroring, mobile applications, streaming services, voice assistants, network management, and enterprise collaboration platforms.
-
Companies are expanding laser-based projector portfolios.
-
4K and high-brightness systems are important premium segments.
-
AI is improving projector setup and image optimization.
-
Wireless connectivity is becoming a standard competitive feature.
-
Manufacturers are targeting education, enterprise, entertainment, and home users.
Recent Developments
The market is witnessing continued introduction of compact laser DLP projectors that combine high image quality with portable form factors. These products are increasingly designed for streaming, gaming, mobile presentations, and flexible home entertainment.
Projector manufacturers are also integrating AI-assisted setup and image correction, including autofocus, automatic keystone correction, obstacle detection, and intelligent screen alignment. These features are helping users configure projectors with minimal manual intervention.
Another development is the increasing integration of projectors with smart classrooms, enterprise collaboration systems, IoT management platforms, and immersive entertainment environments. Network-enabled management enables organizations to monitor fleets of projectors and automate maintenance workflows.
Market Segmentation
The DLP Projector Market can be segmented by product, technology/component, application, and region. By product, the market includes portable projectors, home theater projectors, business projectors, education projectors, large-venue projectors, interactive projectors, and professional visualization systems. Laser-based and high-resolution products are expected to account for an increasing share of premium applications.
By technology/component, the market includes DMD chips, laser illumination, LED illumination, lamp-based illumination, optical engines, image-processing systems, wireless connectivity modules, sensors, and software. DMD technology remains the core imaging platform, while laser illumination and intelligent processing are major areas of innovation.
By application, the market covers education, enterprise and corporate, home entertainment, gaming, digital signage, cinema and entertainment, aerospace and defense, healthcare, industrial simulation, museums, and other professional applications. Education, enterprise, and home entertainment remain important demand centers, while immersive entertainment and simulation provide additional growth opportunities.
By region, the market includes North America, Europe, Asia Pacific, Latin America, and the Middle East & Africa. North America is expected to remain the leading regional market, while Asia Pacific is projected to achieve the fastest growth through 2035.
-
Laser DLP projectors represent a major product opportunity.
-
4K and high-brightness systems are gaining adoption.
-
Education and corporate applications remain important markets.
-
Home entertainment and immersive experiences create new opportunities.
-
Asia Pacific is expected to be the fastest-growing region.
Conclusion
The DLP Projector Market is evolving from conventional presentation equipment into an increasingly intelligent and connected visualization platform. The market is projected to grow from US$ 4.0 Billion - US$ 4.5 Billion in 2025 to US$ 6.8 Billion - US$ 7.8 Billion by 2035 at a CAGR of 5.5% - 6.2% from 2025 to 2035.
AI will contribute to this transformation by making projectors easier to configure, operate, and maintain. Automatic image correction, object recognition, predictive maintenance, intelligent brightness control, and voice interfaces can significantly improve the user experience.
IoT and cloud connectivity will also increase the strategic value of projection systems in large deployments. Schools, enterprises, entertainment venues, and other organizations can remotely manage devices, monitor performance, automate updates, and optimize maintenance.
Through 2035, the strongest opportunities are expected in laser projection, 4K visualization, digital classrooms, enterprise collaboration, home entertainment, gaming, simulation, digital signage, and immersive experiences. Companies that combine superior optical performance with AI, wireless connectivity, automation, and intuitive software will be well positioned to capture future demand.
FAQs
1. What is the projected market size of the DLP Projector Market?
The DLP Projector Market is estimated at US$ 4.0 Billion - US$ 4.5 Billion in 2025 and is projected to reach US$ 6.8 Billion - US$ 7.8 Billion by 2035.
2. What is the expected growth rate of the DLP Projector Market?
The market is expected to grow at approximately 5.5% - 6.2% CAGR from 2025 to 2035, driven by laser projection, 4K adoption, education digitalization, home entertainment, and professional visualization.
3. What are the key drivers of the DLP Projector Market?
Major drivers include demand for high-resolution displays, laser illumination, digital classrooms, corporate collaboration, home entertainment, immersive visualization, wireless connectivity, and AI-enabled projector features.
4. Which region is expected to lead the DLP Projector Market?
North America is expected to remain the leading regional market, while Asia Pacific is projected to be the fastest-growing region through 2035.
5. Who are the key companies in the DLP Projector Market?
Major companies include BenQ, Optoma, ViewSonic, Epson, Panasonic, Sony, Barco, Christie Digital, Acer, and LG Electronics.
 Exclusive indicates content/data unique to MarketsandMarkets and not available with any competitors.
Table of Contents
1 Introduction (Page No. - 14)
1.1 Study Objectives
1.2 Market Definition
1.3 Study Scope
1.3.1 Markets Covered
1.3.2 Years Considered For the Study
1.4 Currency & Pricing
1.5 Assumptions
1.6 Limitations
1.7 Stakeholders
2 Research Methodology (Page No. - 18)
2.1 Research Data
2.1.1 Secondary Data
2.1.1.1 Key Data From Secondary Sources
2.1.2 Primary Data
2.1.2.1 Key Data From Primary Sources
2.1.2.2 Key Industry Insights
2.1.2.3 Breakdown of Primaries
2.2 Demand-Side Analysis
2.2.1 Growing Film Industry
2.2.2 Digitalization in the Learning Process
2.3 Market Size Estimation
2.3.1 Bottom-Up Approach
2.3.2 Top-Down Approach
2.4 Market Breakdown and Data Triangulation
2.5 Research Assumptions
2.5.1 Assumptions
3 Executive Summary (Page No. - 28)
4 Premium Insights (Page No. - 33)
4.1 Attractive Opportunities in DLP Projector Market
4.2 DLP Projector Market – Top 3 Applications
4.3 DLP Projector Market in Asia-Pacific
4.4 DLP Projector Market in Home Entertainment & Cinema End-Appplication, By Light Source
4.5 Americas Held the Major Share Among All the Regions in 2014
5 Market Overview (Page No. - 38)
5.1 Market Segmentation
5.1.1 DLP Projector Market, By Light Source
5.1.2 DLP Projector Market, By Chip Model
5.1.3 DLP Projector Market, By Brightness
5.1.4 DLP Projector Market, By Throw Distance
5.1.5 DLP Projector Market, By Application
5.1.6 DLP Projector Market, By Geography
5.2 Market Evolution
5.3 Market Dynamics
5.3.1 Drivers
5.3.1.1 Digitalization of the Cinema Screens
5.3.1.2 Technological Advancements in Education Sector
5.3.1.3 Increasing Adoption of 3D Projection in Emerging Applications
5.3.2 Restraints
5.3.2.1 Projectors Based on Emerging Light Projection Technologies
5.3.3 Opportunities
5.3.3.1 Upcoming Sports Events
5.3.3.2 Average Selling Price of DLP Projector Expected to Decrease
5.3.4 Challenges
5.3.4.1 Operational Challenges
5.3.4.2 Limitations of DLP Projectors
5.3.5 Winning Imperatives
5.3.5.1 Laser Light Sources
6 Industry Trends (Page No. - 52)
6.1 Introduction
6.2 Value Chain Analysis
6.3 Porter’s Five Forces Model
6.3.1 Bargaining Power of Suppliers
6.3.2 Bargaining Power of Buyers
6.3.3 Threat of New Entrants
6.3.4 Threat of Substitutes
6.3.5 Intensity of Competitive Rivalry
7 DLP Projector Market, By Light Source (Page No. - 61)
7.1 Introduction
7.2 Lamp
7.3 Light-Emitting Diode (LED)
7.4 Laser
8 DLP Projector Market, By Chip Model (Page No. - 68)
8.1 Introduction
8.2 One-Chip DLP Projectors
8.3 Three-Chip DLP Projectors
9 DLP Projector Market, By Brightness (Page No. - 74)
9.1 Introduction
9.2 Less Than 2,999 Lumens
9.3 3,000–5,999 Lumens
9.4 6,000 Lumens and Above
10 DLP Projector Market, By Throw Distance (Page No. - 83)
10.1 Introduction
10.2 Ultra-Short Throw
10.3 Short Throw
10.4 Normal Throw
11 DLP Projector Market, By Application (Page No. - 90)
11.1 Introduction
11.2 Home Entertainment and Cinema
11.2.1 Home Entertainment
11.2.2 Cinema
11.3 Education and Government
11.4 Business
11.5 Large Venues
11.6 Others
12 Geographic Analysis (Page No. - 110)
12.1 Introduction
12.2 Americas
12.2.1 North America
12.2.2 South America
12.3 Europe
12.4 Asia-Pacific
12.5 Rest of the World
13 Competitive Landscape (Page No. - 135)
13.1 Overview
13.2 Market Ranking For DLP Projector Market, 2014
13.3 Competitive Scenario
13.4 Recent Developments
13.4.1 New Product Launches
13.4.2 Agreements, Partnerships, Collaborations, and Joint Ventures
13.4.3 Business Expansions
13.4.4 Mergers & Acquisitions
14 Company Profiles (Page No. - 146)
(Overview, Products and Services, Financials, Strategy & Development)*
14.1 Introduction
14.2 Optoma Corp.
14.3 Christie Digital Systems, Inc.
14.4 NEC Corp.
14.5 Belgian American Radio Corporation (BARCO)
14.6 Benq Corporation
14.7 Delta Electronics, Inc.
14.8 Digital Projection Limited
14.9 Acer Inc.
14.10 Viewsonic Corp.
14.11 Texas Instruments Inc.
*Details on Overview, Products and Services, Financials, Strategy & Development Might Not Be Captured in Case of Unlisted Companies.
15 Appendix (Page No. - 177)
15.1 Insights of Industry Experts
15.2 Discussion Guide
15.3 Introducing RT: Real-Time Market Intelligence
15.4 Available Customizations
15.5 Related Reports
List of Tables (69 Tables)
Table 1 Digitalization of Cinema Screens Worldwide Propels the Growth of the DLP Projector Market
Table 2 Projectors Based on Emerging New Light Projection Technologies Hinder the Growth of the DLP Projector Market
Table 3 Use of DLP-Based Projector For Visualization in the Sports Events Create A Huge Opportunity For the DLP Projector Market
Table 4 Porter’s Five Forces Analysis: Competitive Rivalry and Buyer’s Bargaining Power Likely to Have the Maximum Impact on the Overall Market
Table 5 Global DLP Projector Market, By Light Source, 2013–2020 (USD Million)
Table 6 Lamp-Based DLP Projector Market, By Application, 2013–2020 (USD Million)
Table 7 LED Based DLP Projector Market, By Application, 2013–2020 (USD Million)
Table 8 Laser-Based DLP Projector Market, By Application, 2013–2020 (USD Million)
Table 9 Global DLP Projector Market, By Chip Model, 2013–2020 (USD Million)
Table 10 One-Chip DLP Projector Market, By Application, 2013–2020 (USD Million)
Table 11 One-Chip DLP Projector Market, By Region, 2013–2020 (USD Million)
Table 12 Three-Chip DLP Projector Market, By Application, 2013–2020 (USD Million)
Table 13 Three-Chip DLP Projector Market, By Region, 2013–2020 (USD Million)
Table 14 Global DLP Projector Market, By Brightness, 2013–2020 (USD Million)
Table 15 Global DLP Projector Market, By Brightness, 2013–2020 (Thousand Units)
Table 16 Less Than 2,999 Lumens: DLP Projector Market, By Application, 2013–2020 (USD Million)
Table 17 3,000–5,999 Lumens DLP Projector Market, By Application, 2013–2020 (USD Million)
Table 18 6,000 Lumens and Above: DLP Projector Market, By Application, 2013–2020 (USD Million)
Table 19 Global DLP Projector Market, By Throw Distance, 2013–2020 (USD Million)
Table 20 Ultra-Short Throw DLP Projector Market, By Application, 2013–2020 (USD Million)
Table 21 Short Throw DLP Projector Market, By Application, 2013–2020 (USD Million)
Table 22 Normal Throw DLP Projector Market, By Application, 2013–2020 (USD Million)
Table 23 Global DLP Projector Market, By Application, 2013–2020 (USD Million)
Table 24 Global DLP Projector Market, By Application, 2013–2020 (Thousand Units)
Table 25 DLP Projector Market in Home Entertainment & Cinema Application, By Light Source, 2013–2020 (USD Million)
Table 26 DLP Projector Market in Home Entertainment & Cinema Application, By Brightness, 2013–2020 (USD Million)
Table 27 DLP Projector Market in Home Entertainment & Cinema Application, By Chip Model, 2013–2020 (USD Million)
Table 28 DLP Projector Market in Home Entertainment & Cinema Application, By Throw Distance, 2013–2020 (USD Million)
Table 29 DLP Projector Market in Home Entertainment & Cinema Application, By Region, 2013–2020 (USD Million)
Table 30 DLP Projector Market in Education & Government Application, By Light Source, 2013–2020 (USD Million)
Table 31 DLP Projector Market in Education & Government Application, By Brightness, 2013–2020 (USD Million)
Table 32 DLP Projector Market in Education & Goverment Application, By Throw Distance, 2013–2020 (USD Million)
Table 33 DLP Projector Market in Education & Government Application, By Region, 2013–2020 (USD Million)
Table 34 DLP Projector Market in Business Application, By Light Source, 2013–2020 (USD Million)
Table 35 DLP Projector Market in Business Application, By Brightness, 2013–2020 (USD Million)
Table 36 DLP Projector Market in Business Application, By Throw Distance, 2013–2020 (USD Million)
Table 37 DLP Projector Market in Business Application, By Region, 2013–2020 (USD Million)
Table 38 DLP Projector Market in Large Venues Application, By Light Source, 2013–2020 (USD Million)
Table 39 DLP Projector Market in Large Venues Application, By Brightness, 2013–2020 (USD Million)
Table 40 DLP Projector Market in Large Venue Application, By Region, 2013–2020 (USD Million)
Table 41 DLP Projector Market in Other Applications, By Light Source, 2013–2020 (USD Million)
Table 42 DLP Projector Market in Other Applications, By Brightness, 2013–2020 (USD Million)
Table 43 DLP Projector Market in Other Applications, By Chip Model, 2013–2020 (USD Million)
Table 44 DLP Projector Market in Other Applications, By Throw Distance, 2013–2020 (USD Million)
Table 45 DLP Projector Market in Other Application, By Region, 2013–2020 (USD Million)
Table 46 Global DLP Projector Market, By Region, 2013–2020 (USD Million)
Table 47 Americas: DLP Projector Market, By Application, 2013–2020 (USD Million)
Table 48 Americas: DLP Projector Market, By Chip Model, 2013–2020 (USD Million)
Table 49 Americas: DLP Projector Market, By Region, 2013–2020 (USD Million)
Table 50 North America: DLP Projector Market, By Application, 2013–2020 (USD Million)
Table 51 North America: DLP Projector Market, By Chip Model, 2013–2020 (USD Million)
Table 52 North America: DLP Projector Market, By Country, 2013–2020 (USD Million)
Table 53 South America: DLP Projector Market, By Application, 2013–2020 (USD Million)
Table 54 South America: DLP Projector Market, By Chip Model, 2013–2020 (USD Million)
Table 55 South America: DLP Projector Market, By Country, 2013–2020 (USD Million)
Table 56 Europe: DLP Projector Market, By Application, 2013–2020 (USD Million)
Table 57 Europe: DLP Projector Market, By Chip Model, 2013–2020 (USD Million)
Table 58 Europe: DLP Projector Market, By Country, 2013–2020 (USD Million)
Table 59 APAC: DLP Projector Market, By Application, 2013–2020 (USD Million)
Table 60 APAC: DLP Projector Market, By Chip Model, 2013–2020 (USD Million)
Table 61 APAC: DLP Projector Market, By Country, 2013–2020 (USD Million)
Table 62 RoW: DLP Projector Market, By Application, 2013–2020 (USD Million)
Table 63 RoW: DLP Projector Market, By Region, 2013–2020 (USD Million)
Table 64 RoW: DLP Projector Market, By Region, 2013–2020 (USD Million)
Table 65 Market Ranking of the Top 5 Players in the DLP Projector Market, 2014
Table 66 New Product Launches, 2012–2015
Table 67 Agreements, Partnerships, Collaborations, & Joint Ventures, 2012–2015
Table 68 Business Expansions, 2012–2015
Table 69 Mergers & Acquisitions, 2012–2015
List of Figures (89 Figures)
Figure 1 Market Segmentation
Figure 2 Years Considered in the Report
Figure 3 DLP Projector Market: Research Design
Figure 4 Number of Films Released, 2009–2014
Figure 5 Market Size Estimation Methodology: Bottom-Up Approach
Figure 6 Market Size Estimation Methodology: Top-Down Approach
Figure 7 DLP Projector Market in Business Application Expected to Lead During the Forecast Period
Figure 8 Huge Demand For Short and Ultra-Short Throw DLP Projectors to Drive the Market During the Forecast Period
Figure 9 Non-Lamp Based DLP Projector Market to Grow at A Higher Rate During the Forecast Period
Figure 10 Americas Held the Largest Market Share of DLP Projector Market in 2014
Figure 11 Rising Demand For High-End and Feature-Rich DLP Projectors Expected to Drive the DLP Projector Market
Figure 12 DLP Projector Market in Education & Government Application Expected to Grow at the Highest Rate During the Forecast Period
Figure 13 APAC Region is Expected to Lead the Global DLP Projector Market By 2017
Figure 14 Laser-Based DLP Projectors to Grow at the Highest CAGR in Home Entertainment & Cinema Application
Figure 15 The Americas Held the Largest Share of the Global DLP Projector Market in 2014
Figure 16 Market Segmentation: By Light Source
Figure 17 Market Segmentation: By Chip Model
Figure 18 Market Segmentation: By Brightness
Figure 19 Market Segmentation: By Throw Distance
Figure 20 Market Segmentation: By Application
Figure 21 Market Segmentation: By Geography
Figure 22 Evolution of the DLP Projector Market
Figure 23 Digitalization of Cinema Screens: A Major Driver For the DLP Projector Market During the Forecast Period
Figure 24 Number of Digital Screens, 2007-2011
Figure 25 Value Chain Analysis: Major Value is Added During the Manufacturing & Assembly Phase
Figure 26 DLP Projector Market: Porter’s Five Forces Analysis
Figure 27 Porters Analysis: DLP Projector Market
Figure 28 DLP Projector Market: Bargaining Power of Suppliers
Figure 29 DLP Projector Market: Bargaining Power of Buyers
Figure 30 DLP Projector Market: Threat of New Entrants
Figure 31 DLP Projector Market: Threat of Substitutes
Figure 32 DLP Projector Market: Competitive Rivalry
Figure 33 DLP Projector Market, By Light Source
Figure 34 Lamp-Based DLP Projector Market, By Application, 2015 - 2020
Figure 35 LED-Based DLP Projector Market, By Application, 2015 vs 2020
Figure 36 Laser-Based DLP Projector Market, By Application, 2015 vs 2020
Figure 37 DLP Projector Market, By Chip Model
Figure 38 One-Chip DLP Projector Market, By Region, 2015 vs 2020
Figure 39 Three-Chip DLP Projector Market, By Region, 2015 vs 2020
Figure 40 DLP Projector Market, By Brightness
Figure 41 Less Than 2,999 Lumens: DLP Projector Market, By Application, 2015 vs 2020 (USD Million)
Figure 42 3,000–5,999 Lumens: DLP Projector Market, By Application, 2015 vs 2020 (USD Million)
Figure 43 6,000 Lumens and Above: DLP Projector Market, By Application, 2015 vs 2020 (USD Million)
Figure 44 DLP Projector Market, By Throw Distance
Figure 45 Ultra-Short Throw DLP Projector Market, By Application, 2015 vs 2020
Figure 46 Short Throw DLP Projector Market, By Application, 2015 vs 2020
Figure 47 Normal Throw DLP Projector Market, By Application, 2015 vs 2020
Figure 48 DLP Projector Market, By Application
Figure 49 Global DLP Projector Market, By Application, 2015 vs 2020 (USD Million)
Figure 50 DLP Projector Market in Home Entertainment & Cinema Application, By Region, 2015 vs 2020 (USD Million)
Figure 51 DLP Projector Market in Education & Government Application, By Chip Model, 2013–2020 (USD Million)
Figure 52 DLP Projector Market in Education & Government Application, By Region, 2015 vs 2020 (USD Million)
Figure 53 DLP Projector Market in Business Application, By Chip Model, 2013–2020 (USD Million)
Figure 54 DLP Projector Market in Business Application, By Region, 2015 Vs.2020 (USD Million)
Figure 55 DLP Projector Market in Large Venues Application, By Chip Model, 2013–2020 (USD Million)
Figure 56 DLP Projector Market in Large Venues Application, By Throw Distance, 2013–2020 (USD Million)
Figure 57 DLP Projector Market in Large Venue Application, By Region, 2015 vs 2020 (USD Million)
Figure 58 DLP Projector Market in Other Application, By Region, 2015 vs 2020 (USD Million)
Figure 59 Global DLP Projector Market, By Geography
Figure 60 Geographic Snapshot (2015): DLP Projector Market in RoW Estimated to Grow at the Highest Rate During the Forecast Period
Figure 61 DLP Projector Market in Japan Estimated to Grow at the Highest Rate Between 2015 and 2020
Figure 62 Americas: DLP Projector Market Snapshot—DLP Projector Market to Be Driven By Favorable Government Policies Toward Digitalization of Education Sector
Figure 63 Americas: DLP Projector Market
Figure 64 North America: DLP Projector Market
Figure 65 North America: DLP Projector Market, By Country, 2015 vs 2020
Figure 66 South America: DLP Projector Market
Figure 67 South America: DLP Projector Market, By Country, 2015 vs 2020
Figure 68 Europe: Market Snapshot—Demand to Be Driven By the Increasing Popularity of Ultra-Short Throw and Short Throw DLP Projectors in Key Applications
Figure 69 Europe: DLP Projector Market
Figure 70 Europe: DLP Projector Market, By Country, 2015 vs 2020
Figure 71 APAC: Market Snapshot—Demand to Be Driven By Digitalization of Cinema Screens in the Film Industry
Figure 72 APAC: DLP Projector Market
Figure 73 APAC: DLP Projector Market, By Country, 2015 vs 2020
Figure 74 RoW: DLP Projector Market
Figure 75 RoW: DLP Projector Market, By Region, 2015 vs 2020
Figure 76 Key Growth Strategies Adopted By Top Companies Between 2012 and 2015
Figure 77 Market Evaluation Framework-New Product Launches Fueled Growth and Innovation
Figure 78 Battle For Market Share: New Product Launches Was the Key Strategy
Figure 79 Geographic Revenue Mix of Top Market Players
Figure 80 Optoma Corp.: SWOT Analysis
Figure 81 Christie Digital Systems, Inc.: SWOT Analysis
Figure 82 NEC Corporation: Company Snapshot
Figure 83 NEC Corp.: SWOT Analysis
Figure 84 BARCO: Company Snapshot
Figure 85 BARCO : SWOT Analysis
Figure 86 Benq Corp.: SWOT Analysis
Figure 87 Delta Electronics, Inc.: Company Snapshot
Figure 88 Acer Inc.: Company Snapshot
Figure 89 Texas Instruments Inc: Company Snapshot
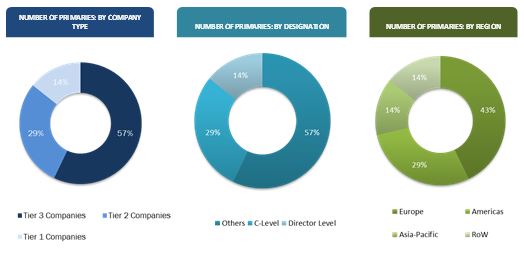
The research methodology used to estimate and forecast the DLP projector market begins with capturing data on key vendor revenues through secondary research. The vendor offerings are also taken into consideration to determine the market segmentation. The bottom-up procedure has been employed to arrive at the overall market size of the global DLP projector market from the revenue of the key players in the market. After arriving at the overall market size, the total market was split into several segments and subsegments which are then verified through primary research by conducting extensive interviews with CEOs, VPs, directors, and executives. The data triangulation and market breakdown procedures were employed to complete the overall market engineering process and arrive at the exact statistics for all segments and subsegments. The breakdown of profiles of the primaries is depicted in the figure below:
To know about the assumptions considered for the study, download the pdf brochure
The DLP projector ecosystem comprises technology vendors such as Texas Instruments Inc. (U.S.), DLP projector manufacturers such as Qisda Corp. (Taiwan), Coretronic Corp (Taiwan), and Delta Electronics, Inc. (Taiwan) among others; DLP projector companies such as Barco N. V.(Belgium), BenQ Corp. (Taiwan), Christie Digital Systems, Inc. (U.S.), NEC Corp. (Japan), Optoma Corp. (Taiwan), Acer Inc. (Taiwan), Digital Projection Ltd. (U.K.), and ViewSonic Corp. (U.S.) among others who sell these DLP projectors to end users to cater to their unique business requirements and needs.
Key Target Audience
- Electric equipment suppliers
- Original equipment manufacturers (OEMs)
- End-user applications or electronic product manufacturers
- DLP technology investors
- DLP projector distributors
- Research institutes and organizations
Scope of the Report
The research report segments the DLP projector market to following submarkets:
By Light Source:
- Lamp
- LED
- Laser
By Chip Model:
- One Chip
- Three Chip
By Brightness:
- Less than 2,999 Lumens
- 3,000 to 5,999 Lumens
- 6,000 Lumens and Above
By Throw Distance:
- Normal Throw
- Short Throw
- Ultra-Short Throw
By Application:
- Home Entertainment & Cinema
- Business
- Education & Government
- Large Venues
- Others
By Geography:
- The Americas
- Europe
- Asia-Pacific
- RoW1
Note1: RoW includes the Middle East and Africa.
Available Customizations
With the given market data, MarketsandMarkets offers customizations as per the company’s specific needs. The following customization options are available for the report:
Geographic Analysis
- Further breakdown of the Americas DLP projector market
- Further breakdown of the European market
- Further breakdown of the APAC market
- Further breakdown of the RoW market
Company Information
- Detailed analysis and profiling of additional market players













Growth opportunities and latent adjacency in DLP Projector Market