Electric Bus Market by Propulsion (BEV, FCEV), Battery (LFP, NMC, NCA), Length (<9, 9-14, >14m), Battery Capacity (=400 & >400kWh), Application, Seating Capacity, Range, Power Output, Autonomy Level, Component, Consumer and Region - Global Forecast to 2032

icon1
USD 59.6
MARKET SIZE, 2030
icon2
CAGR 14.0%
(2025-2030)
icon3
490+
REPORT PAGES
icon4
400+
MARKET TABLES

OVERVIEW

Source: Secondary Research, Interviews with Experts, MarketsandMarkets Analysis

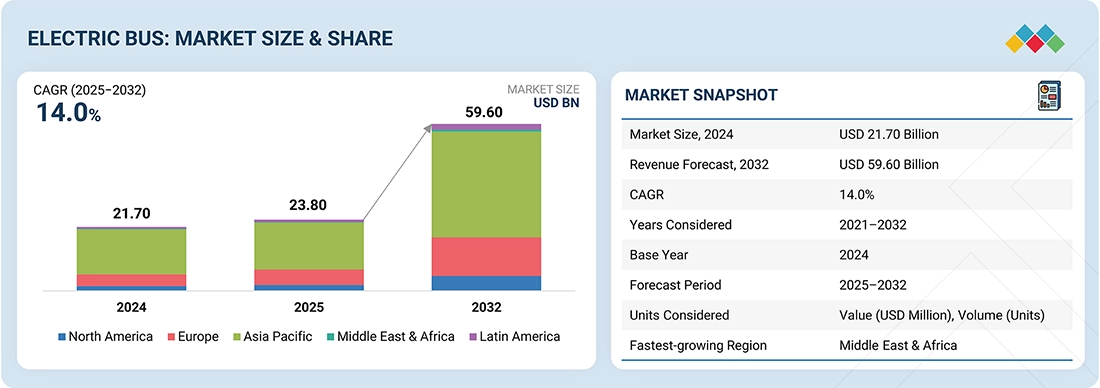
The electric bus market is projected to grow from USD 23.80 billion in 2025 to USD 59.60 billion by 2032, at a CAGR of 14.0%. Government subsidies and funding from local and national transit agencies make large-scale electric bus adoption financially sustainable worldwide. This shift is further boosted by progress in advanced battery chemistries and faster charging technology, which have extended driving ranges and reduced dependence on mid-route charging breaks. Although there are still a few challenges, a significant challenge is the need to upgrade power grids and bus depots to handle fast charging. Also, constant stop-and-go driving wears out batteries faster and creates heating issues, which can raise long-term costs for bus operators.

KEY TAKEAWAYS

  • BY PROPULSION
    Battery electric buses continue to dominate globally, accounting for the vast majority of electric bus sales due to lower initial and operating costs and improving charging infrastructure. Ongoing efforts to reduce the cost of hydrogen and improve refueling infrastructure will drive the demand for Fuel cell electric buses. However, the higher upfront cost still poses a significant challenge for market adoption.
  • BY RANGE
    The intracity electric buses are more popular due to the limited charging range offered and the lack of charging infrastructure outside cities. Hence, the dominance of the up to 300-mile segment. Growing demand for inter-city buses and coaches in Europe and North America will drive the > 300 miles segment.
  • BY CONSUMER
    Governments, as the consumers for electric buses, dominate the market with more than 90% share across regions. This is driven by large-scale subsidies, fleet mandates, and public transit electrification programs that prioritize municipal and state-run operators.
  • BY BATTERY CAPACITY
    The demand for intercity travel and the future growth potential for electric coaches will drive the market for the above 400 kWh segment.
  • BY BATTERY TYPE
    LFP batteries currently dominate the global electric bus market by battery type. NMC batteries have seen decent demand in the European region, but their demand is decreasing as Chinese players enter European markets. Solid-state batteries are under development in the European region, where players such as Daimler are planning to integrate them into their buses.
  • BY APPLICATIONS
    Increased government initiatives for the adoption of electric buses for urban mobility will drive the electric city/transit bus market. The electric school buses market will be dominated by North America.
  • BY POWER OUTPUT
    The growing demand for high-performance electric buses in challenging regions will drive the market for buses with a power output above 250 kW. Buses with up to 250 kW power output are mainly used for intracity public transport globally.
  • BY LENGTH
    The 9–14 meter long electric buses are set to account for the largest portion of the market, as these buses are a perfect balance between required length and seats. These buses also suit intra-city mobility, which increases their application areas.
  • BY SEATING CAPACITY
    Electric buses with a seating capacity of 40–70 are increasingly incorporated into public transportation in cities. Increasing popularity of trolley buses and articulated buses is the key driving factor for the growth of electric buses with more than 70 seating capacity.
  • BY GVW
    Electric buses with a GVW of 10–20 tonnes dominate the electric bus market. Electric bus OEMs are planning to reduce the vehicle weight up to 1 tonne per meter of length.
  • BY COMPONENT
    Advancements in battery technologies and the falling prices of LFP batteries will significantly drive the growth of the batteries segment.
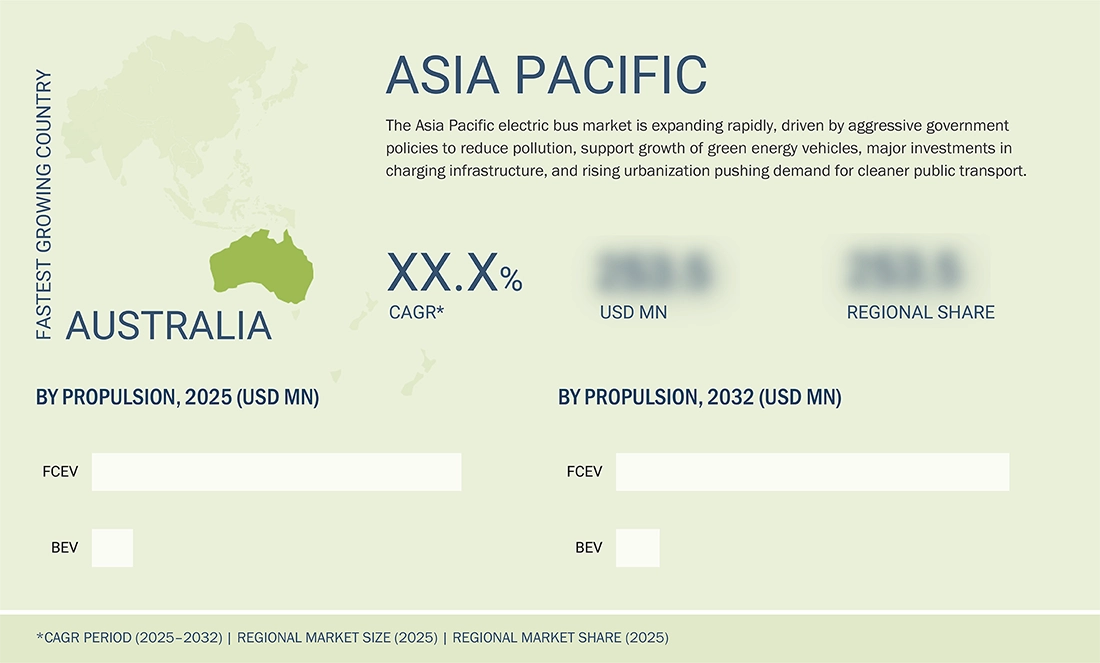
  • BY REGION
    Asia Pacific is projected to be largest region in global electric bus market during forecast period.
  • COMPETITIVE LANDSCAPE
    The major market players have adopted both organic and inorganic strategies, including partnerships and investments. Daimler Buses acquired a 49% stake in SINOS GmbH, a software company specializing in intelligent charging management systems for electrified city bus fleets.

The electric bus market is growing due to strong government support, with subsidies and funding from local and national agencies making them more affordable for large-scale use. New battery technologies have improved driving range, need not stop as often for charging, and faster charging systems help reduce waiting times and keep operations running smoothly. At the same time, investments in upgrading power grids and bus depots make it easier to handle large-scale charging needs. While challenges like battery wear and heating from constant stop-and-go driving still exist, improvements in battery management and cooling systems are expected to make batteries last longer and reduce costs over time, further boosting adoption.

TRENDS & DISRUPTIONS IMPACTING CUSTOMERS' CUSTOMERS

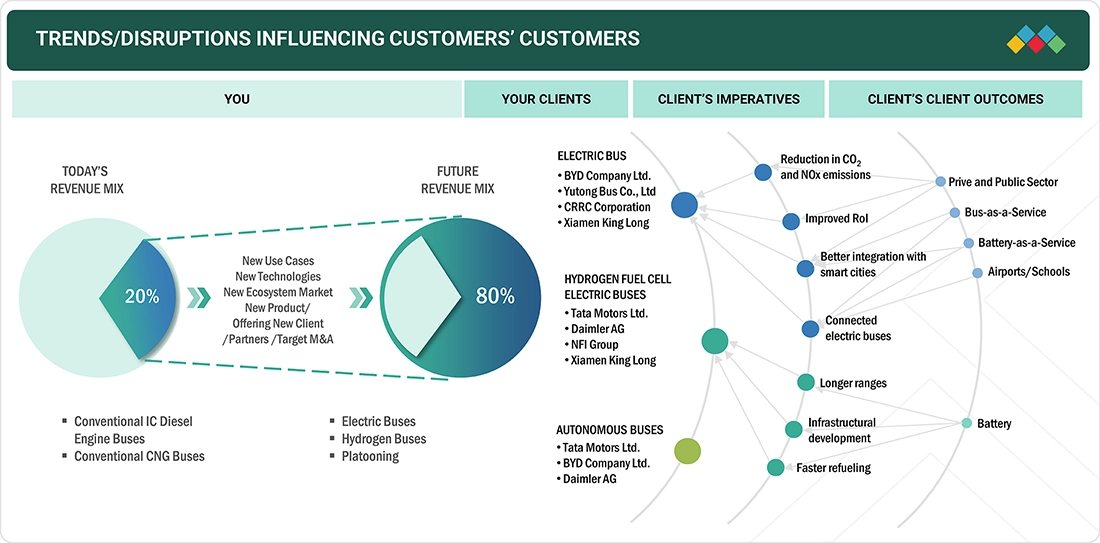
Trends and disruptions in the electric bus market indicate the latest and upcoming market trends. It also indicates those trends that were responsible for the past revenue generation, along with upcoming trends that will impact the future revenue of the market. This section also highlights those factors that will be responsible for the market growth of electric buses.

Source: Secondary Research, Interviews with Experts, MarketsandMarkets Analysis

MARKET DYNAMICS

Drivers
Impact
Level
  • •Rising GHG Emissions (Government incentives and policies, target to reduce fleet-level emissions)
  • Increasing demand for emission-free vehicles and decline in battery prices
RESTRAINTS
Impact
Level
  • CNG and biofuel buses slowing adoption of electric buses
  • Safety concerns in EV batteries and high development costs
OPPORTUNITIES
Impact
Level
  • Development of advanced battery technologies
  • Transition toward hydrogen fuel cell electric mobility
CHALLENGES
Impact
Level
  • High cost of developing charging infrastructure

Source: Secondary Research, Interviews with Experts, MarketsandMarkets Analysis

Driver: Growing demand for green vehicles to lower fleet-level emissions

The push for greener public transport is driving strong demand for electric buses, as governments and cities prioritize fleet-level emission reductions. Strict emission targets in the EU, funding programs in the US and LATAM, and large-scale initiatives in Asia and Africa are accelerating the adoption of green vehicles. OEMs such as BYD and Yutong are supporting this shift by offering cost-competitive, localized solutions. By enabling measurable reductions in CO2 and NOx per passenger-kilometer compared to diesel and CNG fleets, eBuses are helping agencies meet climate action goals. Additionally, various government incentives/subsidies cover up to 85% of the upfront costs. This policy-driven momentum positions electric buses as the most effective pathway to achieving zero-emission transit while maintaining favorable operating economics.

Restraint: CNG and bio-fuel buses slowing adoption of electric buses

CNG buses are slowing the adoption of eBuses because they are around 30–40% cheaper upfront and already supported by widespread refueling infrastructure in markets like India and parts of the US. Their total cost of ownership (TCO) is competitive, owing to the lower purchase price and stable fuel costs, while eBuses still carry higher risks of costly battery replacements and the need for depot charging setups. For high-utilization fleets, CNG buses often reach payback 2–3 years faster than eBuses when subsidies are limited, making many operators cautious about fully shifting to electric.

Opportunity: Advancements in Battery Technologies

Advancements in battery technology are creating significant opportunities for the electric bus market by making vehicles more practical, cost-effective, and widely adoptable. Breakthroughs in sodium-ion batteries, such as CATL’s upcoming Naxtra in 2025, offer a sustainable and affordable alternative to lithium-ion, with comparable energy density, longer lifespan, and higher safety, ideal for urban and entry-level transit systems. At the same time, solid-state batteries are being developed, which promise safer operations, faster charging, and nearly double the energy density, with leading manufacturers like Mercedes-Benz (Germany) already preparing for road trials with their eCitaro electric bus equipped with solid-state batteries. Additionally, the newest generation of NMC4 batteries enhances range and efficiency through higher energy density and prismatic cell designs, supporting new models and retrofitting.

Challenge: High cost of developing charging infrastructure

Developing charging infrastructure for electric buses poses significant challenges for the market because of high costs. Investing in charging stations, grid upgrades, and maintenance facilities is essential for setting up the infrastructure needed for electric buses. Electric buses face a dilemma with their extended charging time and limited driving range per charge, making it difficult to function at maximum capacity. Also, unlike developed countries, most of the emerging economies in the Asia Pacific lack the necessary charging facilities. An extensive and comprehensive charging infrastructure network is required to ensure the smooth operation of electric buses. Bus companies must consider strategic decisions about investing in electric bus fleets, setting up charging infrastructures, and determining where to place those infrastructures in the city network.

MARKET ECOSYSTEM

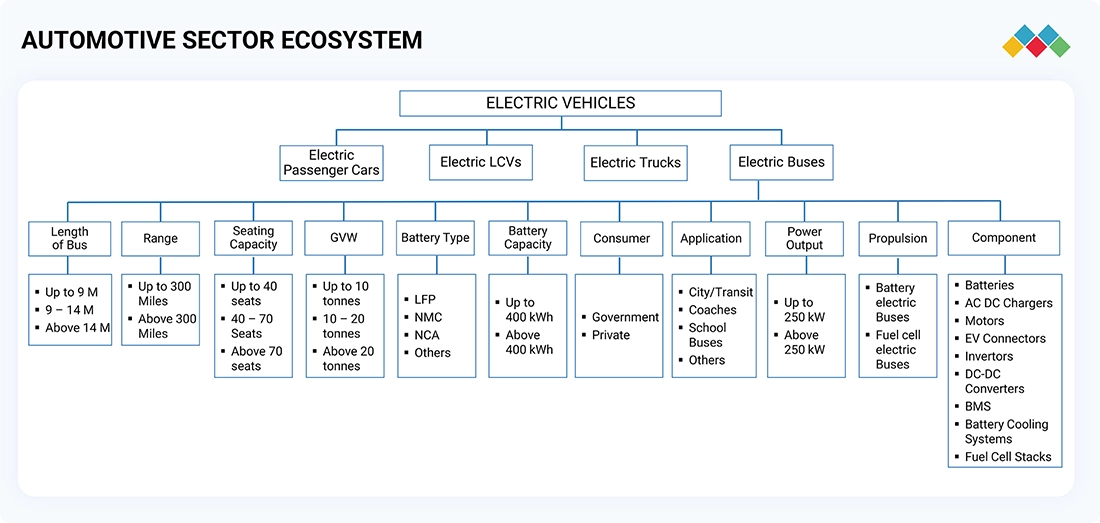
This diagram highlights the role of electric buses within the broader electric vehicle industry. It outlines their growing importance in sustainable mobility and captures the key aspects influencing adoption, such as vehicle size, range, seating capacity, battery type, and charging capability. The electric bus market is further segmented by consumer type, applications, power output, propulsion technologies, and critical components, providing a clear view of how the market is structured and analyzed. BYD Company (China), Zhejiang Geely Holding Group (China), Yutong Bus Co., Ltd. (China), Fuqi Group (China) and Daimler Truck AG (Germany) are the leading electric bus manufacturers in the market.

Logos and trademarks shown above are the property of their respective owners. Their use here is for informational and illustrative purposes only.

MARKET SEGMENTS

Source: Secondary Research, Interviews with Experts, MarketsandMarkets Analysis

Electric Bus Market, By Range

The market for long-range electric buses and coaches is expanding as transit operators seek vehicles capable of covering extended routes with fewer charging stops. Falling battery costs, along with advances in high-energy-density LFP batteries (500–600 kWh packs), are enabling ranges above 300 miles. These buses reduce downtime by up to 30%, making them attractive for high-frequency urban routes in China, intercity travel in Europe, and rural services in India.

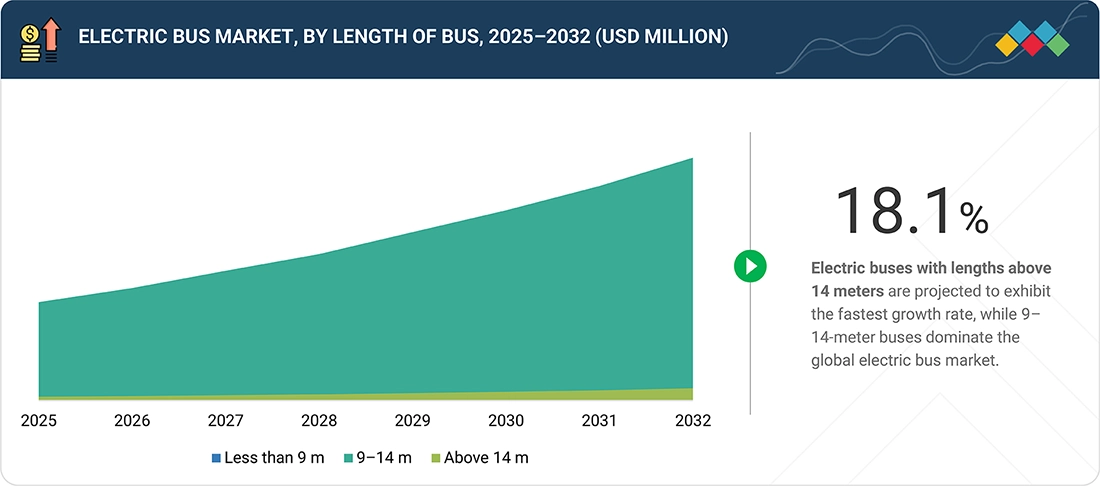
Electric Bus Market, By Length

The 9–14-meter bus segment is emerging as the backbone of the electric bus market, driven by its versatility for urban, suburban, and select intercity routes. With seating for 40–70 passengers and a range of 240–400 km, these buses meet the needs of full-day city operations without frequent charging. Their popularity is reinforced by government-funded clean bus programs, such as the UK’s ZEBRA scheme, which prioritizes this category for large-scale fleet deployment.

Electric Bus Market, By Consumer

The government sector is driving the growth of electric buses, with large-scale subsidies, mandates, and fleet replacement programs making them the backbone of public transit electrification. China leads with Shenzhen’s 16,000+ municipal eBuses, while India’s FAME-II scheme is enabling thousands of state-run fleet additions toward a 50,000-bus target by 2027. In the US, federal funding of USD 1.7 billion has supported over 1,300 zero-emission transit buses, and the EU’s Clean Bus Deployment Initiative registered nearly 8,000 units in 2024, pushing operators toward 100% electrification by 2030.

Electric Bus Market, By Propulsion

BEVs are estimated to dominate the electric bus market by propulsion during the forecast period. Their lower initial cost and lower operating costs compared to FCEV buses are driving their adoption. Moreover, the developing charging infrastructure has supported growth of BEV buses. FCEV buses on the other hand are priced 2–3x compared to BEVs and have higher operating costs due to high cost of hydrogen.

Electric Bus Market, By Battery Type

LFP batteries are projected to dominate the electric bus market by battery type during the forecast period. NMC batteries have seen decent demand in the European region, but their demand is decreasing, as Chinese players have entered European markets with their inhouse production of LFP batteries. Solid-state batteries are under development in the European region, where players such as Daimler AG are planning to integrate them into their electric buses.

Electric Bus Market, By Battery Capacity

Electric buses with battery capacities of up to 400 kWh are dominating the electric bus market. These batteries provide sufficient range to run intracity throughout the day without frequent recharging, whereas the demand for intercity travel and the future growth potential for electric coaches are estimated to drive the market for the above 400 kWh segment.

Electric Bus Market, By Application

City/Transit buses are leading the electric bus market by application. Increased government initiatives for the adoption of electric buses for urban mobility is the driving factor for this adoption. Electric school buses are becoming popular in North America, while electric coaches are in demand in Europe.

Electric Bus Market, By GVW

The 10–20 tonne segment is estimated to account for the largest share in the electric bus market by GVW. Electric bus OEMs across the globe are focusing on reducing the weight of the buses to improve efficiency. OEMs are targeting to reach 1-tonne per meter of length but currently have achieved around 1.3–1.5 tonne per meter.

Electric Bus Market, By Power Output

Up to 250 kW power output buses are currently leading the market. According to industry experts, this power is sufficient for intercity as well as intracity operations. However, when it comes to harsh and mountainous terrains, higher power output electric buses are preferred. As of 2025, more than 98% of buses have power outputs of up to 250 kW.

Electric Bus Market, By Seating Capacity

The 40–70 seater electric buses dominate the electric bus market in terms of length. These buses serve various applications, including intracity and intercity. Governments are focusing on these buses to be included for public transport. Also, these are a preferred alternative when it comes to long-distance travel, supporting the growth of the segment.

REGION

Asia Pacific to be largest region in global electric bus market during forecast period

Asia Pacific is set to remain the largest electric bus market, driven by large-scale manufacturing, integrated supply chains, and strong government support. China dominates with nearly 65% of global production, led by BYD and Yutong, and has already achieved near-100% electrification of city buses. Chinese OEMs also export to over 40 countries using CATL and BYD batteries. India is rapidly scaling with the PM eBus Sewa program (10,000 buses across 169 cities) and FAME-II, which has sanctioned nearly 7,000 buses. South Korea and Japan are expanding steadily, with Tokyo operating over 100 fuel-cell buses. Other markets like Singapore, Indonesia, and Australia together sold about 500 electric buses in 2024.

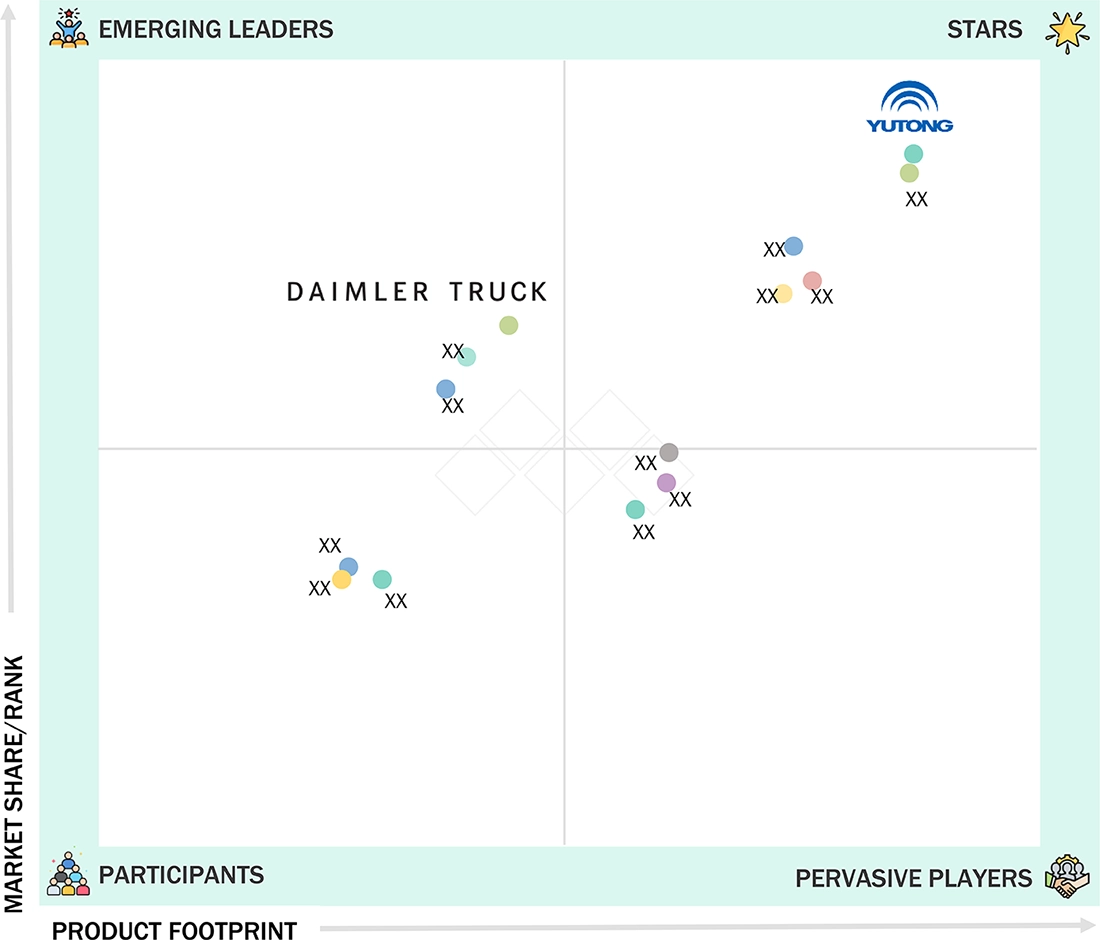
Electric Bus Market: COMPANY EVALUATION MATRIX

The figure illustrates the competitive landscape of the global electric bus market, positioning key players based on their market share and product footprint. In the market matrix, Yutong Bus Co., Ltd (China) (Star) leads with a strong market presence and a broad product portfolio, driving large-scale adoption across all major regions. Daimler Truck AG (Germany) (Emerging Leader) is gaining traction in the market through its strong focus on advanced battery development, and the company’s collaborations in charging infrastructure and hydrogen technologies further strengthen its long-term competitiveness in zero-emission buses.

Source: Secondary Research, Interviews with Experts, MarketsandMarkets Analysis

MARKET SCOPE

REPORT METRIC DETAILS
Market Size, 2025 (Value) USD 23.80 Billion
Revenue Forecast, 2032 (Value) USD 59.60 Billion
Growth Rate 14%
Actual Data 2021–2032
Base Year 2024
Forecast Period 2025–2032
Units Considered Volume (Units), Value (USD Million)
Report Coverage Revenue Forecast, Company Market Shares, Competitive Landscape, Growth Factors, Trends & Disruption, OEM Analysis, Bill of Materials, Total Cost of Ownership, and OE-wise sales
Segments Covered
  • By Propulsion: BEVs and FCEVs
  • By Length of the Bus:
    • Less Than 9 m
    • 9–14 m
    • More Than 14 m
  • By Component:
    • Batteries
    • Motors
    • Fuel Cell Stacks
    • Battery Management Systems
    • Battery Cooling Systems
    • DC-DC Converters
    • Inverters
    • AC/DC Chargers
    • and EV Connectors
  • By Range: Up to 300 Miles and Above 300 Miles
  • By Power Output: Up to 250 kW and Above 250 kW
  • By Battery Capacity: Up to 400 kWh and Above 400 kWh
  • By Application:
    • Transit Buses
    • Coaches
    • School Buses
    • and Other Applications
  • By Battery Type:
    • LFP Batteries
    • NMC Batteries
    • NCA Batteries
    • and Other Batteries
  • By Seating Capacity:
    • Up to 40 Seats
    • 40–70 Seats
    • and Above 70 Seats
  • By Consumer: Government and Private
  • By GVW:
    • Up to 10 Tonnes
    • 10 to 20 Tonnes
    • and Above 20 Tonnes
  • By level of Autonomy: Semi-autonomous and Autonomous
Regional Scope North America, Europe, Asia Pacific, Latin America, and the Middle East & Africa

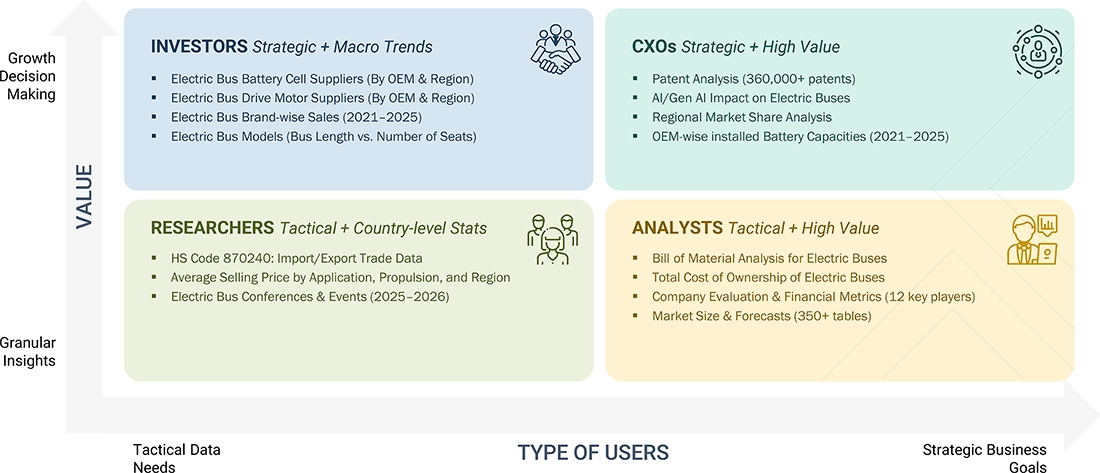
WHAT IS IN IT FOR YOU: Electric Bus Market REPORT CONTENT GUIDE

RECENT DEVELOPMENTS

  • July 2025 : BYD commenced an expansion of its electric bus and truck manufacturing plant in Komárom, Hungary. The new 29,000-square-meter facility is expected to triple production capacity to over 1,000 vehicles annually. This plant will create more than 600 jobs and enhance Europe's supply of zero-emission public transport solutions.
  • July 2025 : Yutong launched its new-generation battery electric intercity bus, the IC12E, at the UITP Summit 2025 in Hamburg, Germany, highlighting its commitment to eco-friendly transportation. The IC12E is explicitly designed for the European market, offering a maximum 610-kilometer range under SORT2 conditions.
  • July 2025 : Yutong delivered 110 customized C13PRO premium coaches to Aramco in Saudi Arabia. These coaches were specially engineered to perform reliably in the region’s extreme desert climate. They feature advanced cooling systems, intelligent safety technologies, and luxurious, business-class interiors designed for comfort and connectivity.
  • June 2025 : Zhejiang Geely Holding Group launched the U12M at the Hong Kong Auto Expo. This would be Geely’s first methanol hybrid city bus, targeting public transport in Hong Kong with sustainable powertrain technology.
  • March 2025 : Volvo secured a major order for 106 electric buses from Svealandstrafiken in Sweden in 2024. This included 60 Volvo 8900 Electric intercity buses and 46 Volvo 7900 Electric articulated city buses, with deliveries starting in 2025–2026 and operations expected by early 2027.
  • February 2025 : Volvo Buses secured its first electric bus order from Go Ahead (UK), the largest operator of bus services in London. The company will add 25 Volvo BZL Electric single-deck buses to its fleet later this year.
  • January 2025 : Thomas Built Buses, a subsidiary of Daimler Trucks, launched the second-generation Saf-T-Liner C2 Jouley battery-electric school bus. The bus featured a new 219-inch wheelbase that accommodated up to 60 passengers. It would be powered by the advanced 14Xe eAxle from Accelera, with a 246 kWh battery enabling a range of up to 150 miles and acceleration from 0-60 mph in 49 seconds.


Table of Contents

Exclusive indicates content/data unique to MarketsandMarkets and not available with any competitors.

TITLE
PAGE NO
1
INTRODUCTION


33
2
RESEARCH METHODOLOGY


39
3
EXECUTIVE SUMMARY


52
4
PREMIUM INSIGHTS


56
5
MARKET OVERVIEW
Explore the surge in zero-emission buses driven by technology advances and emission-free demand.


63
 
5.1
INTRODUCTION


5.2
MARKET DYNAMICS


5.2.1
DRIVERS


5.2.1.1
Rising GHG emissions


5.2.1.2
Increasing demand for emission-free vehicles and decline in battery prices


5.2.2
RESTRAINTS


5.2.2.1
CNG and biofuel buses slowing adoption of electric buses


5.2.2.2
Safety concerns in EV batteries and high development costs


5.2.3
OPPORTUNITIES


5.2.3.1
Development of advanced battery technologies


5.2.3.2
Transition toward hydrogen fuel cell electric mobility


5.2.3.3
Emergence of charging services for electric buses


5.2.4
CHALLENGES


5.2.4.1
High cost of developing charging infrastructure
 
6
INDUSTRY TRENDS
AI-driven innovations and strategic partnerships are revolutionizing the electric bus industry landscape.


80
 
6.1
IMPACT OF AI/GEN AI ON ELECTRIC BUS MARKET


6.2
TRADE ANALYSIS


6.2.1
IMPORT SCENARIO


6.2.2
EXPORT SCENARIO


6.3
ECOSYSTEM ANALYSIS


6.4
SUPPLY CHAIN ANALYSIS


6.5
TOTAL COST OF OWNERSHIP: DIESEL BUSES VS. ELECTRIC BUSES


6.5.1
COST COMPARISON: ELECTRIC BUSES VS. ICE BUSES


6.6
PRICING ANALYSIS


6.6.1
BY APPLICATION


6.6.2
BY PROPULSION


6.6.3
BY REGION


6.7
PATENT ANALYSIS


6.7.1
INTRODUCTION


6.8
REGULATORY LANDSCAPE


6.8.1
NORTH AMERICA


6.8.2
EUROPE


6.8.3
ASIA PACIFIC


6.8.4
LATIN AMERICA


6.8.5
MIDDLE EAST & AFRICA


6.8.6
REGULATORY BODIES, GOVERNMENT AGENCIES, AND OTHER ORGANIZATIONS, BY REGION


6.9
CASE STUDY ANALYSIS


6.9.1
COMPLETE TRANSITION TO ELECTRIC BUSES IN SHENZHEN, CHINA


6.9.2
ZENOBE HELPED STAGECOACH INCORPORATE CHARGING INFRASTRUCTURE AND INSTALL CUSTOM MANAGEMENT SOFTWARE SYSTEM


6.9.3
A COMPREHENSIVE ANALYSIS TO EVALUATE FINANCIAL FEASIBILITY OF DEPLOYING ELECTRIC BUS FLEETS THAT REDUCE EMISSIONS


6.9.4
ELECTRIC BUS DEPLOYMENT WITH INFRASTRUCTURAL CHANGES


6.9.5
HSL WAS AWARDED OPERATIONS BASED ON OPEN TENDERS UNDER CHARGING-AS-A-SERVICE (CAAS) BUSINESS MODEL


6.9.6
AI-POWERED SOFTWARE IMPLEMENTED TO HELP FLEET OPERATORS CHARGE ELECTRIC BUSES


6.9.7
HIGHLAND ELECTRIC FLEETS, IN PARTNERSHIP WITH NATIONAL GRID, PROVIDED ELECTRIC SCHOOL BUSES AND COORDINATED ITS PARTICIPATION IN V2G PROGRAM FOR SCHOOL BUSES


6.9.8
VERMONT ELECTRIC SCHOOL AND TRANSIT BUS PILOT PROGRAM IMPLEMENTED TO FACILITATE COST-EFFECTIVE ELECTRIFICATION


6.9.9
FLEET TEST & EVALUATION TEAM AT NREL SUPPORTED AVTA BY CONDUCTING ASSESSMENTS OF MEDIUM- AND HEAVY-DUTY VEHICLES, ELECTRIC BUSES, AND TROLLEYS


6.9.10
EVENERGI DEVELOPED FRAMEWORK TO DETERMINE OPTIMAL COMBINATION OF DEPOT LAYOUTS, CHARGER SPEEDS, AND CHARGER TYPES


6.10
TRENDS AND DISRUPTIONS IMPACTING CUSTOMER BUSINESS


6.11
BILL OF MATERIALS ANALYSIS


6.12
KEY CONFERENCES AND EVENTS, 2025–2026


6.13
KEY STAKEHOLDERS AND BUYING CRITERIA


6.13.1
KEY STAKEHOLDERS IN BUYING PROCESS


6.13.2
BUYING CRITERIA


6.14
SUPPLIER ANALYSIS


6.14.1
MAJOR ELECTRIC BUS BATTERY CELL MANUFACTURERS


6.14.2
KEY ELECTRIC BUS AXLE MANUFACTURERS


6.14.3
KEY ELECTRIC BUS HVAC SYSTEM MANUFACTURERS


6.14.4
MAJOR ELECTRIC BUS MOTOR MANUFACTURERS


6.15
INVESTMENT AND FUNDING SCENARIO


7
OEM ANALYSIS
Discover OEM strategies shaping electric bus innovation and market dominance through 2025.


120
 
7.1
INTRODUCTION


7.2
ELECTRIC AND ICE BUS MODELS: LENGTH VS. NUMBER OF SEATS


7.3
ELECTRIC BUS MODELS: LENGTH VS. NUMBER OF SEATS


7.4
BATTERY CAPACITY VS. DRIVE RANGE VS. PAX


7.5
ELECTRIC BUS SALES BY OEMS, 2021–2025


7.6
ELECTRIC BUS DRIVE MOTOR SUPPLIERS, BY OEM AND REGION


7.7
ELECTRIC BUS BATTERY CELL SUPPLIERS, BY OEM AND REGION


7.8
ELECTRIC BUS, OEM-WISE INSTALLED BATTERY CAPACITIES, 2021–2025 (IN MWH)


8
TECHNOLOGY ANALYSIS
Explore cutting-edge battery and charging innovations revolutionizing autonomous bus technology.


128
 
8.1
TECHNOLOGY ANALYSIS


8.1.1
FUTURE TECHNOLOGY OVERVIEW


8.1.2
TECHNOLOGY ROADMAP


8.2
KEY TECHNOLOGIES


8.2.1
AUTONOMOUS BUSES


8.3
ADJACENT TECHNOLOGIES


8.3.1
CHARGING AS A SERVICE


8.3.2
BATTERY AS A SERVICE


8.3.3
PACKAGED FUEL CELL SYSTEM MODULE


8.3.4
METHANE FUEL CELLS


8.4
COMPLEMENTARY TECHNOLOGIES


8.4.1
UPCOMING BATTERY TECHNOLOGIES


8.4.1.1
NMC4


8.4.1.2
Solid-state battery technology


8.4.1.3
Sodium-ion battery technology


8.4.2
INNOVATIVE CHARGING SOLUTIONS


8.4.2.1
Off-board top-down pantograph charging system


8.4.2.2
On-board bottom-up pantograph charging system


8.4.2.3
Ground-based static/dynamic charging system
 
9
ELECTRIC BUS MARKET, BY LENGTH OF BUS
Market Size & Growth Rate Forecast Analysis to 2032 in USD Million and Units | 16 Data Tables


135
 
9.1
INTRODUCTION


9.2
LESS THAN 9 M


9.2.1
EASY MANEUVERING ON COMPACT ROADS


9.3
9–14 M


9.3.1
SUITABLE FOR FULL-DAY OPERATIONS


9.4
MORE THAN 14 M


9.4.1
GROWING NUMBER OF ARTICULATED ELECTRIC BUSES TO DRIVE MARKET


9.5
KEY INDUSTRY INSIGHTS


10
ELECTRIC BUS MARKET, BY BATTERY TYPE
Market Size & Growth Rate Forecast Analysis to 2032 in USD Million and Units | 20 Data Tables


143
 
10.1
INTRODUCTION


10.2
NMC BATTERIES


10.2.1
INCREASED PREFERENCE FOR HIGH ENERGY DENSITY


10.3
LFP BATTERIES


10.3.1
DEMAND FOR LOW-COST AND GOOD THERMAL STABILITY


10.4
NCA BATTERIES


10.4.1
BENEFITS ASSOCIATED WITH HIGH ENERGY DENSITY AND LONG-LIFE CYCLE


10.5
OTHER BATTERIES


10.6
KEY INDUSTRY INSIGHTS


11
ELECTRIC BUS MARKET, BY BATTERY CAPACITY
Market Size & Growth Rate Forecast Analysis to 2032 in USD Million and Units | 12 Data Tables


155
 
11.1
INTRODUCTION


11.2
UP TO 400 KWH


11.2.1
DEPLOYMENT IN INTRACITY TRANSPORT TO PROPEL GROWTH


11.3
ABOVE 400 KWH


11.3.1
USED FOR LONG-DISTANCE COMMUTE


11.4
KEY INDUSTRY INSIGHTS


12
ELECTRIC BUS MARKET, BY POWER OUTPUT
Market Size & Growth Rate Forecast Analysis to 2032 in USD Million and Units | 12 Data Tables


162
 
12.1
INTRODUCTION


12.2
UP TO 250 KW


12.2.1
WIDELY USED IN PUBLIC TRANSPORT BUSES


12.3
ABOVE 250 KW


12.3.1
DEMAND FOR HIGH-PERFORMANCE ELECTRIC BUSES TO DRIVE MARKET


12.4
KEY PRIMARY INSIGHTS


13
ELECTRIC BUS MARKET, BY RANGE
Market Size & Growth Rate Forecast Analysis to 2032 in USD Million and Units | 12 Data Tables


169
 
13.1
INTRODUCTION


13.2
UP TO 300 MILES


13.2.1
SUITABLE FOR URBAN AND SUBURBAN ROUTES WITH FREQUENT STOPS AND SHORTER DISTANCES BETWEEN CHARGING POINTS


13.3
ABOVE 300 MILES


13.3.1
INCREASING DEMAND FOR INTERCITY ELECTRIC BUSES TO DRIVE MARKET


13.4
KEY PRIMARY INSIGHTS


14
ELECTRIC BUS MARKET, BY SEATING CAPACITY
Market Size & Growth Rate Forecast Analysis to 2032 in USD Million and Units | 16 Data Tables


177
 
14.1
INTRODUCTION


14.2
UP TO 40 SEATS


14.2.1
NEED FOR ELECTRIC BUSES FOR SHORT-DISTANCE SHUTTLES TO DRIVE DEMAND


14.3
40–70 SEATS


14.3.1
SUITABLE FOR DENSELY POPULATED AREAS


14.4
ABOVE 70 SEATS


14.4.1
NEED FOR HIGHER PASSENGER-CARRYING CAPABILITIES TO DRIVE DEMAND


14.5
KEY INDUSTRY INSIGHTS


15
ELECTRIC BUS MARKET, BY APPLICATION
Market Size & Growth Rate Forecast Analysis to 2032 in USD Million and Units | 20 Data Tables


185
 
15.1
INTRODUCTION


15.2
CITY/TRANSIT BUS


15.2.1
NEED TO IMPROVE AIR QUALITY IN CITIES TO DRIVE DEMAND


15.3
COACHES


15.3.1
INCREASING DEMAND FOR SUSTAINABLE LONG-DISTANCE TRAVEL TO DRIVE GROWTH


15.4
SCHOOL BUSES


15.4.1
GROWING DEMAND IN NORTH AMERICA TO DRIVE ELECTRIC SCHOOL BUS MARKET


15.5
OTHER APPLICATIONS


15.6
KEY INDUSTRY INSIGHTS


16
ELECTRIC BUS MARKET, BY CONSUMER
Market Size & Growth Rate Forecast Analysis to 2032 in USD Million and Units | 12 Data Tables


196
 
16.1
INTRODUCTION


16.2
PRIVATE


16.2.1
GOVERNMENT SUBSIDIES TO PROMOTE ADOPTION OF ELECTRIC BUSES


16.3
GOVERNMENT


16.3.1
USE OF ELECTRIC BUSES FOR PUBLIC TRANSPORTATION


16.4
KEY INDUSTRY INSIGHTS


17
ELECTRIC BUS MARKET, BY GROSS VEHICLE WEIGHT (GVW)
Market Size & Growth Rate Forecast Analysis to 2032 in Units | 8 Data Tables


203
 
17.1
INTRODUCTION


17.2
UP TO 10 TONNES


17.2.1
NEED FOR ELECTRIC BUSES FOR SHORT-DISTANCE SHUTTLES TO DRIVE GROWTH


17.3
10–20 TONNES


17.3.1
ASIA PACIFIC TO LEAD MARKET IN THIS SEGMENT


17.4
ABOVE 20 TONNES


17.4.1
ENGINEERED FOR BIGGER AND TEDIOUS OPERATIONS


17.5
KEY INDUSTRY INSIGHTS


18
ELECTRIC BUS MARKET, BY PROPULSION
Market Size & Growth Rate Forecast Analysis to 2032 in USD Million and Units | 12 Data Tables


209
 
18.1
INTRODUCTION


18.2
BATTERY ELECTRIC BUSES


18.2.1
FALLING BATTERY PRICES AND GOVERNMENT INCENTIVES TO ELECTRIFY PUBLIC BUS FLEETS


18.3
FUEL CELL ELECTRIC BUSES


18.3.1
SUSTAINABLE PRODUCTION OF HYDROGEN TO DRIVE GROWTH


18.4
KEY INDUSTRY INSIGHTS


19
ELECTRIC BUS MARKET, BY COMPONENT
Market Size & Growth Rate Forecast Analysis to 2032 in USD Million and Units | 40 Data Tables


216
 
19.1
INTRODUCTION


19.2
MOTORS


19.2.1
HIGHER EFFICIENCY THAN TRADITIONAL COMBUSTION ENGINES TO DRIVE GROWTH


19.3
BATTERIES


19.3.1
DECREASING PRICE OF LITHIUM-ION BATTERIES TO DRIVE GROWTH


19.4
FUEL CELL STACKS


19.4.1
INCREASING DEMAND FOR HYDROGEN FUEL CELL ELECTRIC BUSES TO DRIVE GROWTH


19.5
BATTERY MANAGEMENT SYSTEMS


19.5.1
NEED FOR EFFICIENT BATTERY OPTIMIZATION IN ELECTRIC BUSES TO DRIVE GROWTH


19.6
BATTERY COOLING SYSTEMS


19.6.1
GROWING FOCUS ON INCREASING BATTERY LIFE AND IMPROVING THERMAL MANAGEMENT TO DRIVE GROWTH


19.7
DC-DC CONVERTERS


19.7.1
KEY SAFETY SYSTEMS IN ELECTRIC BUSES


19.8
INVERTERS


19.8.1
GROWING DEMAND FOR ELECTRIC BUSES WITH HIGHER RANGE TO DRIVE GROWTH


19.9
AC/DC CHARGERS


19.9.1
CRITICAL TO OVERALL OPERATION AND EFFICIENCY OF ELECTRIC BUSES


19.10
EV CONNECTORS


19.10.1
INCREASING INVESTMENTS IN SUSTAINABLE URBAN TRANSPORTATION INITIATIVES TO DRIVE GROWTH


19.11
KEY INDUSTRY INSIGHTS


20
ELECTRIC BUS MARKET, BY LEVEL OF AUTONOMY
| 2 Data Tables


236
 
20.1
INTRODUCTION


20.2
SEMI-AUTONOMOUS


20.3
AUTONOMOUS


20.4
KEY INDUSTRY INSIGHTS


21
ELECTRIC BUS MARKET, BY REGION
Market Size & Growth Rate Forecast Analysis to 2032 in USD Million and Units | 140 Data Tables


240
 
21.1
INTRODUCTION


21.2
ASIA PACIFIC


21.2.1
MACROECONOMIC OUTLOOK


21.2.2
CHINA


21.2.2.1
Widespread adoption of electric buses in public transport and presence of leading OEMs to boost growth


21.2.3
JAPAN


21.2.3.1
Focus on developing advanced electric buses to drive market


21.2.4
INDIA


21.2.4.1
Government support for electrification of public transport to propel demand


21.2.5
SOUTH KOREA


21.2.5.1
Focus on electrification of public transport fleets to boost growth


21.2.6
SINGAPORE


21.2.6.1
Growing emphasis on promoting green public transport by 2040 to boost growth


21.2.7
INDONESIA


21.2.7.1
Government’s commitment to improving air quality to spur demand


21.2.8
AUSTRALIA


21.2.8.1
Increasing awareness regarding climate change to drive growth
 
 
21.3
EUROPE


21.3.1
MACROECONOMIC OUTLOOK


21.3.2
FRANCE


21.3.2.1
Aim for all-electric public transport fleet by 2025 to promote use of electric buses


21.3.3
GERMANY


21.3.3.1
Increased government incentives and investments for infrastructure development to boost market


21.3.4
SPAIN


21.3.4.1
Government’s focus on replacing existing public transport fleet with electric buses to boost growth


21.3.5
ITALY


21.3.5.1
Rising concerns about emissions to encourage government to adopt electrification of public transport system


21.3.6
NORWAY


21.3.6.1
Rising government support and schemes for electric buses to increase demand


21.3.7
SWEDEN


21.3.7.1
Presence of market-leading OEMs to support growth of electric bus market


21.3.8
DENMARK


21.3.8.1
Favorable government regulations to support growth of electric bus market


21.3.9
NETHERLANDS


21.3.9.1
Increased orders and deliveries of electric buses to boost demand


21.3.10
BELGIUM


21.3.10.1
Investments for electrification of public transport to drive growth


21.3.11
UK


21.3.11.1
Stringent regulations for emission-free buses to boost adoption of electric buses


21.3.12
FINLAND


21.3.12.1
Continuous need for reducing carbon emissions to drive growth


21.3.13
POLAND


21.3.13.1
Push toward sustainable public transportation to spur demand for electric buses
 
 
21.4
NORTH AMERICA


21.4.1
MACROECONOMIC OUTLOOK


21.4.2
US


21.4.2.1
Government programs to promote zero-emission vehicles to boost growth


21.4.3
CANADA


21.4.3.1
Government subsidies and presence of key players to boost adoption of electric school buses
 
 
21.5
LATIN AMERICA


21.5.1
MACROECONOMIC OUTLOOK


21.5.2
ARGENTINA


21.5.2.1
Demand for electrification of bus fleets to boost demand for advanced electric buses


21.5.3
BRAZIL


21.5.3.1
Growing environmental concerns to lead to demand for electric buses


21.5.4
CHILE


21.5.4.1
Government’s focus on promoting emission-free public transport to encourage use of electric buses


21.5.5
MEXICO


21.5.5.1
Rapid strategies undertaken by government to indicate growth of electric bus market


21.5.6
COLOMBIA


21.5.6.1
Increasing government initiatives for electric bus purchases to drive market
 
 
21.6
MIDDLE EAST & AFRICA


21.6.1
MACROECONOMIC OUTLOOK


21.6.2
SOUTH AFRICA


21.6.2.1
Investments by leading OEMs in advanced technologies in automotive sector to drive market


21.6.3
UAE


21.6.3.1
Growing electrification trend in cities to boost demand for electric buses


21.6.4
QATAR


21.6.4.1
Net-zero aims to push incorporation of electric buses
 
22
COMPETITIVE LANDSCAPE
Uncover electric bus market dominance strategies and emerging leaders shaping the competitive landscape.


306
 
22.1
OVERVIEW


22.2
KEY PLAYER STRATEGIES/RIGHT TO WIN


22.3
ELECTRIC BUS MARKET SHARE ANALYSIS, 2024


22.3.1
ASIA: ELECTRIC BUS MARKET SHARE ANALYSIS, 2024


22.3.2
EUROPE: ELECTRIC BUS MARKET SHARE ANALYSIS, 2024


22.3.3
NORTH AMERICA: ELECTRIC BUS MARKET SHARE ANALYSIS, 2024


22.4
REVENUE ANALYSIS


22.5
COMPANY EVALUATION MATRIX: KEY PLAYERS, 2024


22.5.1
STARS


22.5.2
EMERGING LEADERS


22.5.3
PERVASIVE PLAYERS


22.5.4
PARTICIPANTS


22.5.5
COMPANY FOOTPRINT: KEY PLAYERS, 2024


22.5.5.1
Consumer footprint


22.5.5.2
Region footprint


22.5.5.3
Application footprint


22.5.5.4
Propulsion footprint
 
 
22.6
COMPANY EVALUATION MATRIX: STARTUPS/SMES, 2024


22.6.1
PROGRESSIVE COMPANIES


22.6.2
RESPONSIVE COMPANIES


22.6.3
DYNAMIC COMPANIES


22.6.4
STARTING BLOCKS


22.6.5
COMPETITIVE BENCHMARKING


22.6.5.1
List of key startups/SMEs


22.6.5.2
Competitive benchmarking of key startups/SMEs
 
 
22.7
COMPANY VALUATION


22.8
FINANCIAL METRICS


22.9
BRAND/PRODUCT COMPARISON


22.10
COMPETITIVE SCENARIO


22.10.1
PRODUCT LAUNCHES, DEVELOPMENTS, AND ENHANCEMENTS, SEPTEMBER 2022–JULY 2025


22.10.2
DEALS, AUGUST 2022–MARCH 2025


22.10.3
EXPANSIONS, JUNE 2021–JULY 2025


22.10.4
OTHERS, OCTOBER 2022–JULY 2025
 
 
23
COMPANY PROFILES
In-depth Company Profiles of Leading Market Players with detailed Business Overview, Product and Service Portfolio, Recent Developments, and Unique Analyst Perspective (MnM View)


332
 
23.1
KEY PLAYERS


23.1.1
BYD COMPANY LTD.


23.1.1.1
Business overview


23.1.1.2
Products/Solutions offered


23.1.1.3
Recent developments


23.1.1.4
MnM view


23.1.2
YUTONG BUS CO., LTD.


23.1.3
ZHEJIANG GEELY HOLDING GROUP


23.1.4
DAIMLER TRUCK AG


23.1.5
NFI GROUP


23.1.6
AB VOLVO


23.1.7
CAF (SOLARIS BUS & COACH SP. Z O.O.)


23.1.8
ZHONGTONG BUS HOLDING CO., LTD.


23.1.9
CRRC CORPORATION LIMITED


23.1.10
VDL GROEP


23.1.11
EBUSCO


23.1.12
XIAMEN KING LONG INTERNATIONAL TRADING CO., LTD.


23.2
OTHER PLAYERS


23.2.1
BLUE BIRD CORPORATION


23.2.2
GILLIG LLC.


23.2.3
THE LION ELECTRIC COMPANY


23.2.4
TATA MOTORS LIMITED.


23.2.5
ASHOK LEYLAND


23.2.6
SUNDA NEW ENERGY TECHNOLOGY CO., LTD.


23.2.7
GREE ALTAIRNANO NEW ENERGY INC.


23.2.8
XIAMEN GOLDEN DRAGON BUS CO. LTD.


23.2.9
JBM GROUP


23.2.10
SCANIA AB


23.2.11
IRIZAR GROUP


23.2.12
IVECO S.P.A


23.2.13
BLUEBUS


23.2.14
BOZANKAYA


23.2.15
CAETANOBUS


23.2.16
CHARIOT MOTORS


23.2.17
HEULIEZ BUS


23.2.18
OTOKAR OTOMOTIV VE SAVUNMA SANAYI A.S.


23.2.19
TEMSA


23.2.20
URSUS S.A.


23.2.21
VAN HOOL


23.2.22
KARSAN


23.2.23
MELLOR


23.2.24
HINO MOTORS, LTD.


23.2.25
ANHUI ANKAI AUTOMOBILE CO., LTD.


23.2.26
OLECTRA GREENTECH LIMITED
 
 
24
RECOMMENDATIONS BY MARKETSANDMARKETS
Market Size & Growth Rate Forecast Analysis


421
 
24.1
ASIA PACIFIC TO BE MAJOR ELECTRIC BUS MARKET


24.2
BATTERY ELECTRIC BUSES TO BE KEY FOCUS AREA FOR MANUFACTURERS


24.3
CONCLUSION


25
APPENDIX


423
 
25.1
KEY INDUSTRY INSIGHTS


25.2
DISCUSSION GUIDE


25.3
KNOWLEDGESTORE: MARKETSANDMARKETS’ SUBSCRIPTION PORTAL


25.4
CUSTOMIZATION OPTIONS


25.5
RELATED REPORTS


25.6
AUTHOR DETAILS


LIST OF TABLES


TABLE 1
EXCHANGE RATE, 2021–2024


TABLE 2
COUNTRY/REGION-WISE INITIATIVES


TABLE 3
POTENTIAL MARKETS FOR NEW ZERO-EMISSION BUSES ACROSS EUROPE


TABLE 4
FUEL CELL ELECTRIC BUS MODELS


TABLE 5
US: FUEL CELL ELECTRIC BUS PROJECTS


TABLE 6
OEM-WISE DEVELOPMENTS


TABLE 7
ITALY: IMPORT SCENARIO FOR HS CODE: 870240, BY COUNTRY, 2020–2024 (USD)


TABLE 8
GERMANY: IMPORT SCENARIO FOR HS CODE: 870240, BY COUNTRY, 2020–2024 (USD)


TABLE 9
SOUTH KOREA: IMPORT SCENARIO FOR HS CODE: 870240, BY COUNTRY, 2020–2024 (USD)


TABLE 10
UK: IMPORT SCENARIO FOR HS CODE: 870240, BY COUNTRY, 2020–2024 (USD)


TABLE 11
US: IMPORT SCENARIO FOR HS CODE: 870240, BY COUNTRY, 2020–2024 (USD)


TABLE 12
BELGIUM: IMPORT SCENARIO FOR HS CODE: 870240, BY COUNTRY, 2020–2024 (USD)


TABLE 13
CHINA: EXPORT SCENARIO FOR HS CODE: 870240, BY COUNTRY, 2020–2024 (USD)


TABLE 14
POLAND: EXPORT SCENARIO FOR HS CODE: 870240, BY COUNTRY, 2020–2024 (USD)


TABLE 15
BELGIUM: EXPORT SCENARIO FOR HS CODE: 870240, BY COUNTRY, 2020–2024 (USD)


TABLE 16
ITLAY: EXPORT SCENARIO FOR HS CODE: 870240, BY COUNTRY, 2020–2024 (USD)


TABLE 17
TÜRKIYE: EXPORT SCENARIO FOR HS CODE: 870240, BY COUNTRY, 2020–2024 (USD)


TABLE 18
FRANCE: EXPORT SCENARIO FOR HS CODE: 870240, BY COUNTRY, 2020–2024 (USD)


TABLE 19
ELECTRIC BUS MARKET: ROLE OF COMPANIES IN ECOSYSTEM


TABLE 20
AVERAGE SELLING PRICE, BY APPLICATION, 2024 (USD)


TABLE 21
AVERAGE SELLING PRICE, BY PROPULSION, 2024 (USD)


TABLE 22
AVERAGE SELLING PRICE, BY REGION, 2024 (USD)


TABLE 23
LIST OF PATENTS GRANTED IN ELECTRIC BUS MARKET, 2020–2025


TABLE 24
NORTH AMERICA: POLICIES AND INITIATIVES SUPPORTING ELECTRIC & HYDROGEN-POWERED BUSES AND INFRASTRUCTURE


TABLE 25
EUROPE: POLICIES AND INITIATIVES SUPPORTING ELECTRIC & HYDROGEN-POWERED BUSES AND INFRASTRUCTURE


TABLE 26
ASIA PACIFIC: POLICIES AND INITIATIVES SUPPORTING ELECTRIC & HYDROGEN-POWERED BUSES AND INFRASTRUCTURE


TABLE 27
LATIN AMERICA: POLICIES AND INITIATIVES SUPPORTING ELECTRIC & HYDROGEN-POWERED BUSES AND INFRASTRUCTURE


TABLE 28
MIDDLE EAST & AFRICA: POLICIES AND INITIATIVES SUPPORTING ELECTRIC & HYDROGEN-POWERED BUSES AND INFRASTRUCTURE


TABLE 29
NORTH AMERICA: REGULATORY BODIES, GOVERNMENT AGENCIES, AND OTHER ORGANIZATIONS


TABLE 30
EUROPE: REGULATORY BODIES, GOVERNMENT AGENCIES, AND OTHER ORGANIZATIONS


TABLE 31
ASIA PACIFIC: REGULATORY BODIES, GOVERNMENT AGENCIES, AND OTHER ORGANIZATIONS


TABLE 32
MIDDLE EAST & AFRICA: REGULATORY BODIES, GOVERNMENT AGENCIES, AND OTHER ORGANIZATIONS


TABLE 33
LATIN AMERICA: REGULATORY BODIES, GOVERNMENT AGENCIES, AND OTHER ORGANIZATIONS


TABLE 34
ANALYSIS TO EVALUATE FINANCIAL FEASIBILITY OF DEPLOYING ELECTRIC BUS FLEETS


TABLE 35
DEPLOYMENT OF ELECTRIC BUSES WITH ONGOING INFRASTRUCTURAL CHANGES


TABLE 36
KEY CONFERENCES AND EVENTS, 2025–2026


TABLE 37
INFLUENCE OF STAKEHOLDERS ON PURCHASE OF ELECTRIC BUSES


TABLE 38
KEY BUYING CRITERIA FOR ELECTRIC BUS, BY PROPULSION


TABLE 39
BATTERY CELL MANUFACTURERS


TABLE 40
AXLE MANUFACTURERS


TABLE 41
HVAC SYSTEM MANUFACTURERS


TABLE 42
MOTOR MANUFACTURERS


TABLE 43
OEM/BRAND-WISE SALES FOR ELECTRIC BUSES, 2021–2025


TABLE 44
ELECTRIC BUS DRIVE MOTOR SUPPLIERS, BY BRAND/OEM AND REGION


TABLE 45
ELECTRIC BUS BATTERY CELL SUPPLIERS, BY BRAND/OEM AND REGION


TABLE 46
ELECTRIC BUS BRAND/OEM-WISE INSTALLED BATTERY CAPACITIES IN MWH, 2021–2025


TABLE 47
ELECTRIC BUS MARKET, BY LENGTH OF BUS, 2021–2024 (UNITS)


TABLE 48
MARKET, BY LENGTH OF BUS, 2025–2032 (UNITS)


TABLE 49
MARKET, BY LENGTH OF BUS, 2021–2024 (USD MILLION)


TABLE 50
MARKET, BY LENGTH OF BUS, 2025–2032 (USD MILLION)


TABLE 51
LESS THAN 9 M: MARKET, BY REGION, 2021–2024 (UNITS)


TABLE 52
LESS THAN 9 M: MARKET, BY REGION, 2025–2032 (UNITS)


TABLE 53
LESS THAN 9 M: MARKET, BY REGION, 2021–2024 (USD MILLION)


TABLE 54
LESS THAN 9 M: MARKET, BY REGION, 2025–2032 (USD MILLION)


TABLE 55
9–14 M: MARKET, BY REGION, 2021–2024 (UNITS)


TABLE 56
9–14 M: MARKET, BY REGION, 2025–2032 (UNITS)


TABLE 57
9–14 M: MARKET, BY REGION, 2021–2024 (USD MILLION)


TABLE 58
9–14 M: MARKET, BY REGION, 2025–2032 (USD MILLION)


TABLE 59
MORE THAN 14 M: MARKET, BY REGION, 2021–2024 (UNITS)


TABLE 60
MORE THAN 14 M: MARKET, BY REGION, 2025–2032 (UNITS)


TABLE 61
MORE THAN 14 M: MARKET, BY REGION, 2021–2024 (USD MILLION)


TABLE 62
MORE THAN 14 M: MARKET, BY REGION, 2025–2032 (USD MILLION)


TABLE 63
MARKET, BY BATTERY TYPE, 2021–2024 (UNITS)


TABLE 64
MARKET, BY BATTERY TYPE, 2025–2032 (UNITS)


TABLE 65
MARKET, BY BATTERY TYPE, 2021–2024 (USD MILLION)


TABLE 66
MARKET, BY BATTERY TYPE, 2025–2032 (USD MILLION)


TABLE 67
NMC BATTERIES: MARKET, BY REGION, 2021–2024 (UNITS)


TABLE 68
NMC BATTERIES: MARKET, BY REGION, 2025–2032 (UNITS)


TABLE 69
NMC BATTERIES: MARKET, BY REGION, 2021–2024 (USD MILLION)


TABLE 70
NMC BATTERIES: MARKET, BY REGION, 2025–2032 (USD MILLION)


TABLE 71
LFP BATTERIES: MARKET, BY REGION, 2021–2024 (UNITS)


TABLE 72
LFP BATTERIES: MARKET, BY REGION, 2025–2032 (UNITS)


TABLE 73
LFP BATTERIES: MARKET, BY REGION, 2021–2024 (USD MILLION)


TABLE 74
LFP BATTERIES: MARKET, BY REGION, 2025–2032 (USD MILLION)


TABLE 75
NCA BATTERIES: MARKET, BY REGION, 2021–2024 (UNITS)


TABLE 76
NCA BATTERIES: MARKET, BY REGION, 2025–2032 (UNITS)


TABLE 77
NCA BATTERIES: MARKET, BY REGION, 2021–2024 (USD MILLION)


TABLE 78
NCA BATTERIES: MARKET, BY REGION, 2025–2032 (USD MILLION)


TABLE 79
OTHER BATTERIES: MARKET, BY REGION, 2021–2024 (UNITS)


TABLE 80
OTHER BATTERIES: MARKET, BY REGION, 2025–2032 (UNITS)


TABLE 81
OTHER BATTERIES: MARKET, BY REGION, 2021–2024 (USD MILLION)


TABLE 82
OTHER BATTERIES: MARKET, BY REGION, 2025–2032 (USD MILLION)


TABLE 83
MARKET, BY BATTERY CAPACITY, 2021–2024 (UNITS)


TABLE 84
MARKET, BY BATTERY CAPACITY, 2025–2032 (UNITS)


TABLE 85
MARKET, BY BATTERY CAPACITY, 2021–2024 (USD MILLION)


TABLE 86
MARKET, BY BATTERY CAPACITY, 2025–2032 (USD MILLION)


TABLE 87
UP TO 400 KWH: MARKET, BY REGION, 2021–2024 (UNITS)


TABLE 88
UP TO 400 KWH: MARKET, BY REGION, 2025–2032 (UNITS)


TABLE 89
UP TO 400 KWH: MARKET, BY REGION, 2021–2024 (USD MILLION)


TABLE 90
UP TO 400 KWH: MARKET, BY REGION, 2025–2032 (USD MILLION)


TABLE 91
ABOVE 400 KWH: MARKET, BY REGION, 2021–2024 (UNITS)


TABLE 92
ABOVE 400 KWH: MARKET, BY REGION, 2025–2032 (UNITS)


TABLE 93
ABOVE 400 KWH: MARKET, BY REGION, 2021–2024 (USD MILLION)


TABLE 94
ABOVE 400 KWH: MARKET, BY REGION, 2025–2032 (USD MILLION)


TABLE 95
MARKET, BY POWER OUTPUT, 2021–2024 (UNITS)


TABLE 96
MARKET, BY POWER OUTPUT, 2025–2032 (UNITS)


TABLE 97
MARKET, BY POWER OUTPUT, 2021–2024 (USD MILLION)


TABLE 98
MARKET, BY POWER OUTPUT, 2025–2032 (USD MILLION)


TABLE 99
UP TO 250 KW: MARKET, BY REGION, 2021–2024 (UNITS)


TABLE 100
UP TO 250 KW: MARKET, BY REGION, 2025–2032 (UNITS)


TABLE 101
UP TO 250 KW: MARKET, BY REGION, 2021–2024 (USD MILLION)


TABLE 102
UP TO 250 KW: MARKET, BY REGION, 2025–2032 (USD MILLION)


TABLE 103
ABOVE 250 KW: MARKET, BY REGION, 2021–2024 (UNITS)


TABLE 104
ABOVE 250 KW: MARKET, BY REGION, 2025–2032 (UNITS)


TABLE 105
ABOVE 250 KW: MARKET, BY REGION, 2021–2024 (USD MILLION)


TABLE 106
ABOVE 250 KW: MARKET, BY REGION, 2025–2032 (USD MILLION)


TABLE 107
MARKET, BY RANGE, 2021–2024 (UNITS)


TABLE 108
MARKET, BY RANGE, 2025–2032 (UNITS)


TABLE 109
MARKET, BY RANGE, 2021–2024 (USD MILLION)


TABLE 110
MARKET, BY RANGE, 2025–2032 (USD MILLION)


TABLE 111
UP TO 300 MILES: MARKET, BY REGION, 2021–2024 (UNITS)


TABLE 112
UP TO 300 MILES: MARKET, BY REGION, 2025–2032 (UNITS)


TABLE 113
UP TO 300 MILES: MARKET, BY REGION, 2021–2024 (USD MILLION)


TABLE 114
UP TO 300 MILES: MARKET, BY REGION, 2025–2032 (USD MILLION)


TABLE 115
ABOVE 300 MILES: MARKET, BY REGION, 2021–2024 (UNITS)


TABLE 116
ABOVE 300 MILES: MARKET, BY REGION, 2025–2032 (UNITS)


TABLE 117
ABOVE 300 MILES: MARKET, BY REGION, 2021–2024 (USD MILLION)


TABLE 118
ABOVE 300 MILES: MARKET, BY REGION, 2025–2032 (USD MILLION)


TABLE 119
MARKET, BY SEATING CAPACITY, 2021–2024 (UNITS)


TABLE 120
MARKET, BY SEATING CAPACITY, 2025–2032 (UNITS)


TABLE 121
MARKET, BY SEATING CAPACITY, 2021–2024 (USD MILLION)


TABLE 122
MARKET, BY SEATING CAPACITY, 2025–2032 (USD MILLION)


TABLE 123
UP TO 40 SEATS: MARKET, BY REGION, 2021–2024 (UNITS)


TABLE 124
UP TO 40 SEATS: MARKET, BY REGION, 2025–2032 (UNITS)


TABLE 125
UP TO 40 SEATS: MARKET, BY REGION, 2021–2024 (USD MILLION)


TABLE 126
UP TO 40 SEATS: MARKET, BY REGION, 2025–2032 (USD MILLION)


TABLE 127
40–70 SEATS: MARKET, BY REGION, 2021–2024 (UNITS)


TABLE 128
40–70 SEATS: MARKET, BY REGION, 2025–2032 (UNITS)


TABLE 129
40–70 SEATS: MARKET, BY REGION, 2021–2024 (USD MILLION)


TABLE 130
40–70 SEATS: MARKET, BY REGION, 2025–2032 (USD MILLION)


TABLE 131
ABOVE 70 SEATS: MARKET, BY REGION, 2021–2024 (UNITS)


TABLE 132
ABOVE 70 SEATS: MARKET, BY REGION, 2025–2032 (UNITS)


TABLE 133
ABOVE 70 SEATS: MARKET, BY REGION, 2021–2024 (USD MILLION)


TABLE 134
ABOVE 70 SEATS: MARKET, BY REGION, 2025–2032 (USD MILLION)


TABLE 135
MARKET, BY APPLICATION, 2021–2024 (UNITS)


TABLE 136
MARKET, BY APPLICATION, 2025–2032 (UNITS)


TABLE 137
MARKET, BY APPLICATION, 2021–2024 (USD MILLION)


TABLE 138
MARKET, BY APPLICATION, 2025–2032 (USD MILLION)


TABLE 139
CITY/TRANSIT BUSES: MARKET, BY REGION, 2021–2024 (UNITS)


TABLE 140
CITY/TRANSIT BUSES: MARKET, BY REGION, 2025–2032 (UNITS)


TABLE 141
CITY/TRANSIT BUSES: MARKET, BY REGION, 2021–2024 (USD MILLION)


TABLE 142
CITY/TRANSIT BUSES: MARKET, BY REGION, 2025–2032 (USD MILLION)


TABLE 143
COACHES: MARKET, BY REGION, 2021–2024 (UNITS)


TABLE 144
COACHES: MARKET, BY REGION, 2025–2032 (UNITS)


TABLE 145
COACHES: MARKET, BY REGION, 2021–2024 (USD MILLION)


TABLE 146
COACHES: MARKET, BY REGION, 2025–2032 (USD MILLION)


TABLE 147
SCHOOL BUSES: MARKET, BY REGION, 2021–2024 (UNITS)


TABLE 148
SCHOOL BUSES: MARKET, BY REGION, 2025–2032 (UNITS)


TABLE 149
SCHOOL BUSES: MARKET, BY REGION, 2021–2024 (USD MILLION)


TABLE 150
SCHOOL BUSES: MARKET, BY REGION, 2025–2032 (USD MILLION)


TABLE 151
OTHER APPLICATIONS: MARKET, BY REGION, 2021–2024 (UNITS)


TABLE 152
OTHER APPLICATIONS: MARKET, BY REGION, 2025–2032 (UNITS)


TABLE 153
OTHER APPLICATIONS: MARKET, BY REGION, 2021–2024 (USD MILLION)


TABLE 154
OTHER APPLICATIONS: MARKET, BY REGION, 2025–2032 (USD MILLION)


TABLE 155
MARKET, BY CONSUMER, 2021–2024 (UNITS)


TABLE 156
MARKET, BY CONSUMER, 2025–2032 (UNITS)


TABLE 157
MARKET, BY CONSUMER, 2021–2024 (USD MILLION)


TABLE 158
MARKET, BY CONSUMER, 2025–2032 (USD MILLION)


TABLE 159
PRIVATE: MARKET, BY REGION, 2021–2024 (UNITS)


TABLE 160
PRIVATE: MARKET, BY REGION, 2025–2032 (UNITS)


TABLE 161
PRIVATE: MARKET, BY REGION, 2021–2024 (USD MILLION)


TABLE 162
PRIVATE: MARKET, BY REGION, 2025–2032 (USD MILLION)


TABLE 163
GOVERNMENT: MARKET, BY REGION, 2021–2024 (UNITS)


TABLE 164
GOVERNMENT: MARKET, BY REGION, 2025–2032 (UNITS)


TABLE 165
GOVERNMENT: MARKET, BY REGION, 2021–2024 (USD MILLION)


TABLE 166
GOVERNMENT: MARKET, BY REGION, 2025–2032 (USD MILLION)


TABLE 167
MARKET, BY GVW, 2021–2024 (UNITS)


TABLE 168
MARKET, BY GVW, 2025–2032 (UNITS)


TABLE 169
UP TO 10 TONNES: MARKET, BY REGION, 2021–2024 (UNITS)


TABLE 170
UP TO 10 TONNES: MARKET, BY REGION, 2025–2032 (UNITS)


TABLE 171
10 – 20 TONNES: MARKET, BY REGION, 2021–2024 (UNITS)


TABLE 172
10 – 20 TONNES: MARKET, BY REGION, 2025–2032 (UNITS)


TABLE 173
ABOVE 20 TONNES: MARKET, BY REGION, 2021–2024 (UNITS)


TABLE 174
ABOVE 20 TONNES: MARKET, BY REGION, 2025–2032 (UNITS)


TABLE 175
MARKET, BY PROPULSION, 2021–2024 (UNITS)


TABLE 176
MARKET, BY PROPULSION, 2025–2032 (UNITS)


TABLE 177
MARKET, BY PROPULSION, 2021–2024 (USD MILLION)


TABLE 178
MARKET, BY PROPULSION, 2025–2032 (USD MILLION)


TABLE 179
BATTERY ELECTRIC BUSES: MARKET, BY REGION, 2021–2024 (UNITS)


TABLE 180
BATTERY ELECTRIC BUSES: MARKET, BY REGION, 2025–2032 (UNITS)


TABLE 181
BATTERY ELECTRIC BUSES: MARKET, BY REGION, 2021–2024 (USD MILLION)


TABLE 182
BATTERY ELECTRIC BUSES: MARKET, BY REGION, 2025–2032 (USD MILLION)


TABLE 183
FUEL CELL ELECTRIC BUSES: MARKET, BY REGION, 2021–2024 (UNITS)


TABLE 184
FUEL CELL ELECTRIC BUSES: MARKET, BY REGION, 2025–2032 (UNITS)


TABLE 185
FUEL CELL ELECTRIC BUSES: MARKET, BY REGION, 2021–2024 (USD MILLION)


TABLE 186
FUEL CELL ELECTRIC BUSES: MARKET, BY REGION, 2025–2032 (USD MILLION)


TABLE 187
MARKET, BY COMPONENT, 2021–2024 (UNITS)


TABLE 188
MARKET, BY COMPONENT, 2025–2032 (UNITS)


TABLE 189
MARKET, BY COMPONENT, 2021–2024 (USD MILLION)


TABLE 190
MARKET, BY COMPONENT, 2025–2032 (USD MILLION)


TABLE 191
MOTORS: MARKET, BY REGION, 2021–2024 (UNITS)


TABLE 192
MOTORS: MARKET, BY REGION, 2025–2032 (UNITS)


TABLE 193
MOTORS: MARKET, BY REGION, 2021–2024 (USD MILLION)


TABLE 194
MOTORS: MARKET, BY REGION, 2025–2032 (USD MILLION)


TABLE 195
BATTERIES: MARKET, BY REGION, 2021–2024 (UNITS)


TABLE 196
BATTERIES: MARKET, BY REGION, 2025–2032 (UNITS)


TABLE 197
BATTERIES: MARKET, BY REGION, 2021–2024 (USD MILLION)


TABLE 198
BATTERIES: MARKET, BY REGION, 2025–2032 (USD MILLION)


TABLE 199
FUEL CELL STACKS: MARKET, BY REGION, 2021–2024 (UNITS)


TABLE 200
FUEL CELL STACKS: MARKET, BY REGION, 2025–2032 (UNITS)


TABLE 201
FUEL CELL STACKS: MARKET, BY REGION, 2021–2024 (USD MILLION)


TABLE 202
FUEL CELL STACKS: MARKET, BY REGION, 2025–2032 (USD MILLION)


TABLE 203
BATTERY MANAGEMENT SYSTEMS: MARKET, BY REGION, 2021–2024 (UNITS)


TABLE 204
BATTERY MANAGEMENT SYSTEMS: MARKET, BY REGION, 2025–2032 (UNITS)


TABLE 205
BATTERY MANAGEMENT SYSTEMS: MARKET, BY REGION, 2021–2024 (USD MILLION)


TABLE 206
BATTERY MANAGEMENT SYSTEMS: MARKET, BY REGION, 2025–2032 (USD MILLION)


TABLE 207
BATTERY COOLING SYSTEMS: MARKET, BY REGION, 2021–2024 (UNITS)


TABLE 208
BATTERY COOLING SYSTEMS: MARKET, BY REGION, 2025–2032 (UNITS)


TABLE 209
BATTERY COOLING SYSTEMS: MARKET, BY REGION, 2021–2024 (USD MILLION)


TABLE 210
BATTERY COOLING SYSTEMS: MARKET, BY REGION, 2025–2032 (USD MILLION)


TABLE 211
DC-DC CONVERTERS: MARKET, BY REGION, 2021–2024 (UNITS)


TABLE 212
DC-DC CONVERTERS: MARKET, BY REGION, 2025–2032 (UNITS)


TABLE 213
DC-DC CONVERTERS: MARKET, BY REGION, 2021–2024 (USD MILLION)


TABLE 214
DC-DC CONVERTERS: MARKET, BY REGION, 2025–2032 (USD MILLION)


TABLE 215
INVERTERS: MARKET, BY REGION, 2021–2024 (UNITS)


TABLE 216
INVERTERS: MARKET, BY REGION, 2025–2032 (UNITS)


TABLE 217
INVERTERS: MARKET, BY REGION, 2021–2024 (USD MILLION)


TABLE 218
INVERTERS: MARKET, BY REGION, 2025–2032 (USD MILLION)


TABLE 219
AC/DC CHARGERS: MARKET, BY REGION, 2021–2024 (UNITS)


TABLE 220
AC/DC CHARGERS: MARKET, BY REGION, 2025–2032 (UNITS)


TABLE 221
AC/DC CHARGERS: MARKET, BY REGION, 2021–2024 (USD MILLION)


TABLE 222
AC/DC CHARGERS: MARKET, BY REGION, 2025–2032 (USD MILLION)


TABLE 223
EV CONNECTORS: MARKET, BY REGION, 2021–2024 (UNITS)


TABLE 224
EV CONNECTORS: MARKET, BY REGION, 2025–2032 (UNITS)


TABLE 225
EV CONNECTORS: MARKET, BY REGION, 2021–2024 (USD MILLION)


TABLE 226
EV CONNECTORS: MARKET, BY REGION, 2025–2032 (USD MILLION)


TABLE 227
SEMI-AUTONOMOUS ELECTRIC BUS MODELS AND THEIR FEATURES, 2022


TABLE 228
AUTONOMOUS ELECTRIC BUS MODELS AND THEIR FEATURES, 2023


TABLE 229
MARKET, BY REGION, 2021–2024 (UNITS)


TABLE 230
MARKET, BY REGION, 2025–2032 (UNITS)


TABLE 231
MARKET, BY REGION, 2021–2024 (USD MILLION)


TABLE 232
MARKET, BY REGION, 2025–2032 (USD MILLION)


TABLE 233
ASIA PACIFIC: MARKET, BY COUNTRY, 2021–2024 (UNITS)


TABLE 234
ASIA PACIFIC: MARKET, BY COUNTRY, 2025–2032 (UNITS)


TABLE 235
ASIA PACIFIC: MARKET, BY COUNTRY, 2021–2024 (USD MILLION)


TABLE 236
ASIA PACIFIC: MARKET, BY COUNTRY, 2025–2032 (USD MILLION)


TABLE 237
CHINA: MARKET, BY PROPULSION, 2021–2024 (UNITS)


TABLE 238
CHINA: MARKET, BY PROPULSION, 2025–2032 (UNITS)


TABLE 239
CHINA: MARKET, BY PROPULSION, 2021–2024 (USD MILLION)


TABLE 240
CHINA: MARKET, BY PROPULSION, 2025–2032 (USD MILLION)


TABLE 241
JAPAN: MARKET, BY PROPULSION, 2021–2024 (UNITS)


TABLE 242
JAPAN: MARKET, BY PROPULSION, 2025–2032 (UNITS)


TABLE 243
JAPAN: MARKET, BY PROPULSION, 2021–2024 (USD MILLION)


TABLE 244
JAPAN: MARKET, BY PROPULSION, 2025–2032 (USD MILLION)


TABLE 245
INDIA: MARKET, BY PROPULSION, 2021–2024 (UNITS)


TABLE 246
INDIA: MARKET, BY PROPULSION, 2025–2032 (UNITS)


TABLE 247
INDIA: MARKET, BY PROPULSION, 2021–2024 (USD MILLION)


TABLE 248
INDIA: MARKET, BY PROPULSION, 2025–2032 (USD MILLION)


TABLE 249
SOUTH KOREA: MARKET, BY PROPULSION, 2021–2024 (UNITS)


TABLE 250
SOUTH KOREA: MARKET, BY PROPULSION, 2025–2032 (UNITS)


TABLE 251
SOUTH KOREA: MARKET, BY PROPULSION, 2021–2024 (USD MILLION)


TABLE 252
SOUTH KOREA: MARKET, BY PROPULSION, 2025–2032 (USD MILLION)


TABLE 253
SINGAPORE: MARKET, BY PROPULSION, 2021–2024 (UNITS)


TABLE 254
SINGAPORE: MARKET, BY PROPULSION, 2025–2032 (UNITS)


TABLE 255
SINGAPORE: MARKET, BY PROPULSION, 2021–2024 (USD MILLION)


TABLE 256
SINGAPORE: MARKET, BY PROPULSION, 2025–2032 (USD MILLION)


TABLE 257
INDONESIA: MARKET, BY PROPULSION, 2021–2024 (UNITS)


TABLE 258
INDONESIA: MARKET, BY PROPULSION, 2025–2032 (UNITS)


TABLE 259
INDONESIA: MARKET, BY PROPULSION, 2021–2024 (USD MILLION)


TABLE 260
INDONESIA: MARKET, BY PROPULSION, 2025–2032 (USD MILLION)


TABLE 261
AUSTRALIA: MARKET, BY PROPULSION, 2021–2024 (UNITS)


TABLE 262
AUSTRALIA: MARKET, BY PROPULSION, 2025–2032 (UNITS)


TABLE 263
AUSTRALIA: MARKET, BY PROPULSION, 2021–2024 (USD MILLION)


TABLE 264
AUSTRALIA: MARKET, BY PROPULSION, 2025–2032 (USD MILLION)


TABLE 265
EUROPE: MARKET, BY COUNTRY, 2021–2024 (UNITS)


TABLE 266
EUROPE: MARKET, BY COUNTRY, 2025–2032 (UNITS)


TABLE 267
EUROPE: MARKET, BY COUNTRY, 2021–2024 (USD MILLION)


TABLE 268
EUROPE: MARKET, BY COUNTRY, 2025–2032 (USD MILLION)


TABLE 269
FRANCE: MARKET, BY PROPULSION, 2021–2024 (UNITS)


TABLE 270
FRANCE: MARKET, BY PROPULSION, 2025–2032 (UNITS)


TABLE 271
FRANCE: MARKET, BY PROPULSION, 2021–2024 (USD MILLION)


TABLE 272
FRANCE: MARKET, BY PROPULSION, 2025–2032 (USD MILLION)


TABLE 273
GERMANY: MARKET, BY PROPULSION, 2021–2024 (UNITS)


TABLE 274
GERMANY: MARKET, BY PROPULSION, 2025–2032 (UNITS)


TABLE 275
GERMANY: MARKET, BY PROPULSION, 2021–2024 (USD MILLION)


TABLE 276
GERMANY: MARKET, BY PROPULSION, 2025–2032 (USD MILLION)


TABLE 277
SPAIN: MARKET, BY PROPULSION, 2021–2024 (UNITS)


TABLE 278
SPAIN: MARKET, BY PROPULSION, 2025–2032 (UNITS)


TABLE 279
SPAIN: MARKET, BY PROPULSION, 2021–2024 (USD MILLION)


TABLE 280
SPAIN: MARKET, BY PROPULSION, 2025–2032 (USD MILLION)


TABLE 281
ITALY: MARKET, BY PROPULSION, 2021–2024 (UNITS)


TABLE 282
ITALY: MARKET, BY PROPULSION, 2025–2032 (UNITS)


TABLE 283
ITALY: MARKET, BY PROPULSION, 2021–2024 (USD MILLION)


TABLE 284
ITALY: MARKET, BY PROPULSION, 2025–2032 (USD MILLION)


TABLE 285
NORWAY: MARKET, BY PROPULSION, 2021–2024 (UNITS)


TABLE 286
NORWAY: MARKET, BY PROPULSION, 2025–2032 (UNITS)


TABLE 287
NORWAY: MARKET, BY PROPULSION, 2021–2024 (USD MILLION)


TABLE 288
NORWAY: MARKET, BY PROPULSION, 2025–2032 (USD MILLION)


TABLE 289
SWEDEN: MARKET, BY PROPULSION, 2021–2024 (UNITS)


TABLE 290
SWEDEN: MARKET, BY PROPULSION, 2025–2032 (UNITS)


TABLE 291
SWEDEN: MARKET, BY PROPULSION, 2021–2024 (USD MILLION)


TABLE 292
SWEDEN: MARKET, BY PROPULSION, 2025–2032 (USD MILLION)


TABLE 293
DENMARK: MARKET, BY PROPULSION, 2021–2024 (UNITS)


TABLE 294
DENMARK: MARKET, BY PROPULSION, 2025–2032 (UNITS)


TABLE 295
DENMARK: MARKET, BY PROPULSION, 2021–2024 (USD MILLION)


TABLE 296
DENMARK: MARKET, BY PROPULSION, 2025–2032 (USD MILLION)


TABLE 297
NETHERLANDS: MARKET, BY PROPULSION, 2021–2024 (UNITS)


TABLE 298
NETHERLANDS: MARKET, BY PROPULSION, 2025–2032 (UNITS)


TABLE 299
NETHERLANDS: MARKET, BY PROPULSION, 2021–2024 (USD MILLION)


TABLE 300
NETHERLANDS: MARKET, BY PROPULSION, 2025–2032 (USD MILLION)


TABLE 301
BELGIUM: MARKET, BY PROPULSION, 2021–2024 (UNITS)


TABLE 302
BELGIUM: MARKET, BY PROPULSION, 2025–2032 (UNITS)


TABLE 303
BELGIUM: MARKET, BY PROPULSION, 2021–2024 (USD MILLION)


TABLE 304
BELGIUM: MARKET, BY PROPULSION, 2025–2032 (USD MILLION)


TABLE 305
UK: MARKET, BY PROPULSION, 2021–2024 (UNITS)


TABLE 306
UK: MARKET, BY PROPULSION, 2025–2032 (UNITS)


TABLE 307
UK: MARKET, BY PROPULSION, 2021–2024 (USD MILLION)


TABLE 308
UK: MARKET, BY PROPULSION, 2025–2032 (USD MILLION)


TABLE 309
FINLAND: MARKET, BY PROPULSION, 2021–2024 (UNITS)


TABLE 310
FINLAND: MARKET, BY PROPULSION, 2025–2032 (UNITS)


TABLE 311
FINLAND: MARKET, BY PROPULSION, 2021–2024 (USD MILLION)


TABLE 312
FINLAND: MARKET, BY PROPULSION, 2025–2032 (USD MILLION)


TABLE 313
POLAND: MARKET, BY PROPULSION, 2021–2024 (UNITS)


TABLE 314
POLAND: MARKET, BY PROPULSION, 2025–2032 (UNITS)


TABLE 315
POLAND: MARKET, BY PROPULSION, 2021–2024 (USD MILLION)


TABLE 316
POLAND: MARKET, BY PROPULSION, 2025–2032 (USD MILLION)


TABLE 317
NORTH AMERICA: MARKET, BY COUNTRY, 2021–2024 (UNITS)


TABLE 318
NORTH AMERICA: MARKET, BY COUNTRY, 2025–2032 (UNITS)


TABLE 319
NORTH AMERICA: MARKET, BY COUNTRY, 2021–2024 (USD MILLION)


TABLE 320
NORTH AMERICA: MARKET, BY COUNTRY, 2025–2032 (USD MILLION)


TABLE 321
US: MARKET, BY PROPULSION, 2021–2024 (UNITS)


TABLE 322
US: MARKET, BY PROPULSION, 2025–2032 (UNITS)


TABLE 323
US: MARKET, BY PROPULSION, 2021–2024 (USD MILLION)


TABLE 324
US: MARKET, BY PROPULSION, 2025–2032 (USD MILLION)


TABLE 325
CANADA: MARKET, BY PROPULSION, 2021–2024 (UNITS)


TABLE 326
CANADA: MARKET, BY PROPULSION, 2025–2032 (UNITS)


TABLE 327
CANADA: MARKET, BY PROPULSION, 2021–2024 (USD MILLION)


TABLE 328
CANADA: MARKET, BY PROPULSION, 2025–2032 (USD MILLION)


TABLE 329
LATIN AMERICA: MARKET, BY COUNTRY, 2021–2024 (UNITS)


TABLE 330
LATIN AMERICA: MARKET, BY COUNTRY, 2025–2032 (UNITS)


TABLE 331
LATIN AMERICA: MARKET, BY COUNTRY, 2021–2024 (USD MILLION)


TABLE 332
LATIN AMERICA: MARKET, BY COUNTRY, 2025–2032 (USD MILLION)


TABLE 333
ARGENTINA: MARKET, BY PROPULSION, 2021–2024 (UNITS)


TABLE 334
ARGENTINA: MARKET, BY PROPULSION, 2025–2032 (UNITS)


TABLE 335
ARGENTINA: MARKET, BY PROPULSION, 2021–2024 (USD MILLION)


TABLE 336
ARGENTINA: MARKET, BY PROPULSION, 2025–2032 (USD MILLION)


TABLE 337
BRAZIL: MARKET, BY PROPULSION, 2021–2024 (UNITS)


TABLE 338
BRAZIL: MARKET, BY PROPULSION, 2025–2032 (UNITS)


TABLE 339
BRAZIL: MARKET, BY PROPULSION, 2021–2024 (USD MILLION)


TABLE 340
BRAZIL: MARKET, BY PROPULSION, 2025–2032 (USD MILLION)


TABLE 341
CHILE: MARKET, BY PROPULSION, 2021–2024 (UNITS)


TABLE 342
CHILE: MARKET, BY PROPULSION, 2025–2032 (UNITS)


TABLE 343
CHILE: MARKET, BY PROPULSION, 2021–2024 (USD MILLION)


TABLE 344
CHILE: MARKET, BY PROPULSION, 2025–2032 (USD MILLION)


TABLE 345
MEXICO: MARKET, BY PROPULSION, 2021–2024 (UNITS)


TABLE 346
MEXICO: MARKET, BY PROPULSION, 2025–2032 (UNITS)


TABLE 347
MEXICO: MARKET, BY PROPULSION, 2021–2024 (USD MILLION)


TABLE 348
MEXICO: MARKET, BY PROPULSION, 2025–2032 (USD MILLION)


TABLE 349
COLOMBIA: MARKET, BY PROPULSION, 2021–2024 (UNITS)


TABLE 350
COLOMBIA: MARKET, BY PROPULSION, 2025–2032 (UNITS)


TABLE 351
COLOMBIA: MARKET, BY PROPULSION, 2021–2024 (USD MILLION)


TABLE 352
COLOMBIA: MARKET, BY PROPULSION, 2025–2032 (USD MILLION)


TABLE 353
MIDDLE EAST & AFRICA: MARKET, BY COUNTRY, 2021–2024 (UNITS)


TABLE 354
MIDDLE EAST & AFRICA: MARKET, BY COUNTRY, 2025–2032 (UNITS)


TABLE 355
MIDDLE EAST & AFRICA: MARKET, BY COUNTRY, 2021–2024 (USD MILLION)


TABLE 356
MIDDLE EAST & AFRICA: MARKET, BY COUNTRY, 2025–2032 (USD MILLION)


TABLE 357
SOUTH AFRICA: MARKET, BY PROPULSION, 2021–2024 (UNITS)


TABLE 358
SOUTH AFRICA: MARKET, BY PROPULSION, 2025–2032 (UNITS)


TABLE 359
SOUTH AFRICA: MARKET, BY PROPULSION, 2021–2024 (USD MILLION)


TABLE 360
SOUTH AFRICA: MARKET, BY PROPULSION, 2025–2032 (USD MILLION)


TABLE 361
UAE: MARKET, BY PROPULSION, 2021–2024 (UNITS)


TABLE 362
UAE: MARKET, BY PROPULSION, 2025–2032 (UNITS)


TABLE 363
UAE: MARKET, BY PROPULSION, 2021–2024 (USD MILLION)


TABLE 364
UAE: MARKET, BY PROPULSION, 2025–2032 (USD MILLION)


TABLE 365
QATAR: MARKET, BY PROPULSION, 2021–2024 (UNITS)


TABLE 366
QATAR: MARKET, BY PROPULSION, 2025–2032 (UNITS)


TABLE 367
QATAR: MARKET, BY PROPULSION, 2021–2024 (USD MILLION)


TABLE 368
QATAR: MARKET, BY PROPULSION, 2025–2032 (USD MILLION)


TABLE 369
KEY PLAYER STRATEGIES/RIGHT TO WIN, 2022–2024


TABLE 370
ASIAN MARKET: DEGREE OF COMPETITION, 2024


TABLE 371
EUROPEAN MARKET: DEGREE OF COMPETITION, 2024


TABLE 372
NORTH AMERICAN MARKET: DEGREE OF COMPETITION, 2024


TABLE 373
MARKET: CONSUMER FOOTPRINT, 2024


TABLE 374
MARKET: REGION FOOTPRINT, 2024


TABLE 375
MARKET: APPLICATION FOOTPRINT, 2024


TABLE 376
MARKET: PROPULSION FOOTPRINT, 2024


TABLE 377
MARKET: LIST OF KEY STARTUPS/SMES


TABLE 378
COMPETITIVE BENCHMARKING OF KEY STARTUPS/SMES


TABLE 379
MARKET: PRODUCT LAUNCHES/ENHANCEMENTS/DEVELOPMENTS, SEPTEMBER 2022–JULY 2025


TABLE 380
MARKET: DEALS, AUGUST 2022–MARCH 2025


TABLE 381
MARKET: EXPANSIONS, JUNE 2021–JULY 2025


TABLE 382
MARKET: OTHERS, OCTOBER 2022–JULY 2025


TABLE 383
BYD COMPANY LTD.: COMPANY OVERVIEW


TABLE 384
BYD COMPANY LTD.: PRODUCTS/SOLUTIONS OFFERED


TABLE 385
BYD COMPANY LTD.: PRODUCT LAUNCHES


TABLE 386
BYD COMPANY LTD.: DEALS


TABLE 387
BYD COMPANY LTD.: EXPANSIONS


TABLE 388
BYD COMPANY LTD.: OTHERS


TABLE 389
YUTONG BUS CO., LTD.: COMPANY OVERVIEW


TABLE 390
YUTONG BUS CO., LTD.: PRODUCTS/SOLUTIONS OFFERED


TABLE 391
YUTONG BUS CO., LTD.: PRODUCT LAUNCHES/ENHANCEMENTS


TABLE 392
YUTONG BUS CO., LTD.: DEALS


TABLE 393
YUTONG BUS CO., LTD.: EXPANSIONS


TABLE 394
YUTONG BUS CO., LTD.: OTHERS


TABLE 395
ZHEJIANG GEELY HOLDING GROUP: COMPANY OVERVIEW


TABLE 396
ZHEJIANG GEELY HOLDING GROUP: PRODUCTS/SOLUTIONS OFFERED


TABLE 397
ZHEJIANG GEELY HOLDING GROUP: PRODUCT LAUNCHES


TABLE 398
ZHEJIANG GEELY HOLDING GROUP: DEALS


TABLE 399
ZHEJIANG GEELY HOLDING GROUP: OTHERS


TABLE 400
DAIMLER TRUCK AG: COMPANY OVERVIEW


TABLE 401
DAIMLER TRUCK AG: PRODUCTS/SOLUTIONS OFFERED


TABLE 402
DAIMLER TRUCK AG: PRODUCT LAUNCHES


TABLE 403
DAIMLER TRUCK AG: DEALS


TABLE 404
DAIMLER TRUCK AG: EXPANSIONS


TABLE 405
DAIMLER TRUCK AG: OTHERS


TABLE 406
NFI GROUP: COMPANY OVERVIEW


TABLE 407
NFI GROUP: PRODUCTS/SOLUTIONS OFFERED


TABLE 408
NFI GROUP: PRODUCT LAUNCHES/DEVELOPMENTS/ENHANCEMENTS


TABLE 409
NFI GROUP: DEALS


TABLE 410
NFI GROUP: OTHERS


TABLE 411
AB VOLVO: COMPANY OVERVIEW


TABLE 412
AB VOLVO: PRODUCTS/SOLUTIONS OFFERED


TABLE 413
AB VOLVO: PRODUCT LAUNCHES


TABLE 414
AB VOLVO: DEALS


TABLE 415
AB VOLVO: OTHERS


TABLE 416
CAF (SOLARIS BUS & COACH SP. Z O.O.): COMPANY OVERVIEW


TABLE 417
CAF (SOLARIS BUS & COACH SP. Z O.O.): PRODUCTS/SOLUTIONS OFFERED


TABLE 418
CAF (SOLARIS BUS & COACH SP. Z O.O.): PRODUCT LAUNCHES


TABLE 419
CAF (SOLARIS BUS & COACH SP. Z O.O.): OTHERS


TABLE 420
ZHONGTONG BUS HOLDING CO., LTD.: COMPANY OVERVIEW


TABLE 421
ZHONGTONG BUS HOLDING CO., LTD.: PRODUCTS/SOLUTIONS OFFERED


TABLE 422
ZHONGTONG BUS HOLDING CO., LTD.: DEALS


TABLE 423
CRRC CORPORATION LIMITED: COMPANY OVERVIEW


TABLE 424
CRRC CORPORATION LIMITED: PRODUCTS/SOLUTIONS OFFERED


TABLE 425
CRRC CORPORATION LIMITED: PRODUCT LAUNCHES


TABLE 426
CRRC CORPORATION LIMITED: DEALS


TABLE 427
CRRC CORPORATION LIMITED: EXPANSIONS


TABLE 428
CRRC CORPORATION LIMITED: OTHERS


TABLE 429
VDL GROEP: COMPANY OVERVIEW


TABLE 430
VDL GROEP: PRODUCTS/SOLUTIONS OFFERED


TABLE 431
VDL GROEP: PRODUCT LAUNCHES


TABLE 432
VDL GROEP: DEALS


TABLE 433
VDL GROEP: EXPANSIONS


TABLE 434
VDL GROEP: OTHERS


TABLE 435
EBUSCO: COMPANY OVERVIEW


TABLE 436
EBUSCO: PRODUCTS/SOLUTIONS OFFERED


TABLE 437
EBUSCO: PRODUCT ENHANCEMENTS


TABLE 438
EBUSCO: DEALS


TABLE 439
EBUSCO: OTHERS


TABLE 440
XIAMEN KING LONG INTERNATIONAL TRADING CO., LTD.: COMPANY OVERVIEW


TABLE 441
XIAMEN KING LONG INTERNATIONAL TRADING CO., LTD.: PRODUCTS/SOLUTIONS OFFERED


TABLE 442
XIAMEN KING LONG INTERNATIONAL TRADING CO., LTD.: PRODUCT LAUNCHES


TABLE 443
XIAMEN KING LONG INTERNATIONAL TRADING CO., LTD.: OTHERS


LIST OF FIGURES


FIGURE 1
RESEARCH DESIGN


FIGURE 2
RESEARCH DESIGN MODEL


FIGURE 3
BREAKDOWN OF PRIMARY INTERVIEWS


FIGURE 4
RESEARCH METHODOLOGY: HYPOTHESIS BUILDING


FIGURE 5
BOTTOM-UP APPROACH


FIGURE 6
MARKET SIZE ESTIMATION: BOTTOM-UP APPROACH METHODOLOGY


FIGURE 7
DATA TRIANGULATION


FIGURE 8
MARKET GROWTH PROJECTIONS FROM DEMAND-SIDE DRIVERS AND OPPORTUNITIES


FIGURE 9
KEY FACTORS IMPACTING ELECTRIC BUS MARKET


FIGURE 10
REPORT SUMMARY


FIGURE 11
ELECTRIC BUS MARKET, BY REGION, 2025 VS. 2032 (USD MILLION)


FIGURE 12
MARKET, BY PROPULSION, 2025 VS. 2032 (USD MILLION)


FIGURE 13
INCREASING DEMAND FOR SUSTAINABLE TRANSPORT SOLUTIONS AND GREEN TRANSPORTATION TO DRIVE MARKET


FIGURE 14
BATTERY ELECTRIC BUSES TO BE DOMINANT SEGMENT IN 2032


FIGURE 15
UP TO 300 MILES SEGMENT TO HOLD DOMINANT MARKET SHARE IN 2032


FIGURE 16
BATTERIES TO HOLD LARGEST MARKET SHARE IN 2032


FIGURE 17
GOVERNMENT SEGMENT TO DOMINATE IN 2032


FIGURE 18
UP TO 400 KWH TO BE DOMINANT SEGMENT IN 2032


FIGURE 19
LFP TO BE LARGEST BATTERY TYPE IN 2032


FIGURE 20
CITY/TRANSIT BUSES TO BE LARGEST SEGMENT IN 2032


FIGURE 21
UP TO 250 KW TO BE DOMINANT SEGMENT IN 2032


FIGURE 22
9-14 M TO BE LARGEST SEGMENT IN 2032


FIGURE 23
40–70 SEATS TO BE LARGEST SEGMENT IN 2032


FIGURE 24
10–20 TONNES SEGMENT TO BE LARGEST SEGMENT DURING FORECAST PERIOD


FIGURE 25
ASIA PACIFIC TO LEAD MARKET IN 2025


FIGURE 26
MARKET DYNAMICS


FIGURE 27
REGION-WISE PROGRAMS FOR ELECTRIC BUS ADOPTION


FIGURE 28
INCREASING DEMAND FOR GREEN VEHICLES


FIGURE 29
DECLINE IN BATTERY PRICE/KWH, 2010–2030


FIGURE 30
SAFETY CONCERNS IN ELECTRIC VEHICLE BATTERIES


FIGURE 31
BATTERY SAFETY ARCHITECTURE OUTLINE


FIGURE 32
AVERAGE COST OF OPERATIONS: DIESEL BUS VS. ELECTRIC BUS (USD/YEAR)


FIGURE 33
FUEL CELL PRODUCT LIFECYCLE


FIGURE 34
ELECTRIC BUS AS A SERVICE


FIGURE 35
MARKET ECOSYSTEM ANALYSIS


FIGURE 36
ECOSYSTEM MAPPING


FIGURE 37
MARKET: SUPPLY CHAIN ANALYSIS


FIGURE 38
TOTAL COST OF OWNERSHIP: 12-M ELECTRIC BUSES VS. 12-M DIESEL BUSES (USD)


FIGURE 39
AVERAGE SELLING PRICE, BY APPLICATION, 2024 (USD)


FIGURE 40
AVERAGE SELLING PRICE, BY PROPULSION, 2024 (USD)


FIGURE 41
AVERAGE SELLING PRICE, BY REGION, 2024 (USD)


FIGURE 42
NUMBER OF PATENTS GRANTED FOR ELECTRIC BUSES, JANUARY 2015–APRIL 2025


FIGURE 43
OPEX-BASED ELECTRIC BUS DEPLOYMENT


FIGURE 44
ELECTRIFICATION OF DOHA PUBLIC TRANSPORT IN 2022


FIGURE 45
TRENDS AND DISRUPTIONS IMPACTING CUSTOMER BUSINESS


FIGURE 46
BILL OF MATERIALS ANALYSIS


FIGURE 47
KEY BUYING CRITERIA FOR ELECTRIC BUSES, BY PROPULSION


FIGURE 48
KEY SUPPLIERS FOR MAJOR COMPONENTS OF ELECTRIC BUSES


FIGURE 49
INVESTMENT AND FUNDING SCENARIO, 2021–2025


FIGURE 50
ELECTRIC AND ICE BUS MODELS: BUS LENGTH VS. NUMBER OF SEATS


FIGURE 51
ELECTRIC BUS MODELS: BUS LENGTH VS. NUMBER OF SEATS


FIGURE 52
ELECTRIC BUS: BATTERY CAPACITY VS. DRIVE RANGE VS. PAX FOR MERCEDES-BENZ E-CITARO


FIGURE 53
MARKET: FUTURE TECHNOLOGY OVERVIEW


FIGURE 54
MARKET: TECHNOLOGY ROADMAP


FIGURE 55
NEW PACKAGED FUEL CELL SYSTEM MODULE BY TOYOTA


FIGURE 56
MARKET, BY LENGTH OF BUS, 2025 VS. 2032 (USD MILLION)


FIGURE 57
MARKET, BY BATTERY TYPE, 2025 VS. 2032 (USD MILLION)


FIGURE 58
MARKET, BY BATTERY CAPACITY, 2025 VS. 2032 (USD MILLION)


FIGURE 59
MARKET, BY POWER OUTPUT, 2025 VS. 2032 (USD MILLION)


FIGURE 60
MARKET, BY RANGE, 2025 VS. 2032 (USD MILLION)


FIGURE 61
MARKET: RANGE VS. DIFFERENT DRIVING CONDITIONS


FIGURE 62
MARKET, BY SEATING CAPACITY, 2025 VS. 2032 (USD MILLION)


FIGURE 63
MARKET, BY APPLICATION, 2025 VS. 2032 (USD MILLION)


FIGURE 64
MARKET, BY CONSUMER, 2025 VS. 2032 (USD MILLION)


FIGURE 65
MARKET, BY GVW, 2025 VS. 2032 (UNITS)


FIGURE 66
MARKET, BY PROPULSION, 2025 VS. 2032 (USD MILLION)


FIGURE 67
MARKET, BY COMPONENT, 2025 VS. 2032 (USD MILLION)


FIGURE 68
MARKET, BY REGION, 2025 VS. 2032 (USD MILLION)


FIGURE 69
ASIA PACIFIC: REAL GDP GROWTH RATE, BY COUNTRY, 2024–2026


FIGURE 70
ASIA PACIFIC: GDP PER CAPITA, BY COUNTRY, 2024–2026


FIGURE 71
ASIA PACIFIC: INFLATION RATE AVERAGE CONSUMER PRICES, BY COUNTRY, 2024–2026


FIGURE 72
ASIA PACIFIC: MANUFACTURING INDUSTRY’S CONTRIBUTION TO GDP, 2024


FIGURE 73
ASIA PACIFIC: MARKET SNAPSHOT


FIGURE 74
EUROPE: REAL GDP GROWTH RATE, BY COUNTRY, 2024-2026


FIGURE 75
EUROPE: GDP PER CAPITA, BY COUNTRY, 2024-2026


FIGURE 76
EUROPE: INFLATION RATE AVERAGE CONSUMER PRICES, BY COUNTRY, 2024-2026


FIGURE 77
EUROPE MANUFACTURING INDUSTRY’S CONTRIBUTION TO GDP, 2024


FIGURE 78
EUROPE: MARKET, BY COUNTRY, 2025 VS. 2032 (USD MILLION)


FIGURE 79
NORTH AMERICA: REAL GDP GROWTH RATE, BY COUNTRY, 2024-2026


FIGURE 80
NORTH AMERICA: GDP PER CAPITA, BY COUNTRY, 2024-2026


FIGURE 81
NORTH AMERICA: CPI INFLATION RATE, BY COUNTRY, 2024-2026


FIGURE 82
NORTH AMERICA MANUFACTURING INDUSTRY’S CONTRIBUTION TO GDP, 2024


FIGURE 83
NORTH AMERICA: MARKET SNAPSHOT


FIGURE 84
LATIN AMERICA: REAL GDP ANNUAL PERCENTAGE CHANGE, 2024–2026


FIGURE 85
LATIN AMERICA: GDP PER CAPITA, 2024–2026


FIGURE 86
LATIN AMERICA: AVERAGE CPI INFLATION RATE, 2024–2026


FIGURE 87
LATIN AMERICA: MANUFACTURING INDUSTRY’S VALUE (AS PART OF GDP), 2024


FIGURE 88
LATIN AMERICA: MARKET, BY COUNTRY, 2025 VS. 2032 (USD MILLION)


FIGURE 89
MIDDLE EAST & AFRICA: REAL GDP ANNUAL PERCENTAGE CHANGE, 2024–2026


FIGURE 90
MIDDLE EAST & AFRICA: GDP PER CAPITA, 2024–2026


FIGURE 91
MIDDLE EAST & AFRICA: AVERAGE CPI INFLATION RATE, 2024–2026


FIGURE 92
MIDDLE EAST & AFRICA: MANUFACTURING INDUSTRY’S VALUE (AS PART OF GDP), 2024


FIGURE 93
MIDDLE EAST & AFRICA: MARKET, BY COUNTRY, 2025 VS. 2032 (USD MILLION)


FIGURE 94
ASIA: MARKET SHARE OF KEY PLAYERS, 2024


FIGURE 95
EUROPE: MARKET SHARE OF KEY PLAYERS, 2024


FIGURE 96
NORTH AMERICA: MARKET SHARE OF KEY PLAYERS, 2024


FIGURE 97
REVENUE ANALYSIS FOR TOP LISTED PLAYERS, 2020–2024


FIGURE 98
MARKET: COMPANY EVALUATION MATRIX (KEY PLAYERS), 2024


FIGURE 99
MARKET: COMPANY FOOTPRINT, 2024


FIGURE 100
MARKET: COMPANY EVALUATION MATRIX (STARTUPS/SMES), 2024


FIGURE 101
COMPANY VALUATION FOR KEY PLAYERS, 2024 (USD BILLION)


FIGURE 102
EV/EBITDA OF KEY PLAYERS, 2024


FIGURE 103
MARKET: BRAND/PRODUCT COMPARISON


FIGURE 104
BYD COMPANY LTD.: COMPANY SNAPSHOT


FIGURE 105
YUTONG BUS CO., LTD.: COMPANY SNAPSHOT


FIGURE 106
DAIMLER TRUCK AG: COMPANY SNAPSHOT


FIGURE 107
NFI GROUP: COMPANY SNAPSHOT


FIGURE 108
AB VOLVO: COMPANY SNAPSHOT


FIGURE 109
CAF (SOLARIS BUS & COACH SP. Z O.O.): COMPANY SNAPSHOT


FIGURE 110
ZHONGTONG BUS HOLDING CO., LTD.: COMPANY SNAPSHOT


FIGURE 111
CRRC CORPORATION LIMITED: COMPANY SNAPSHOT


FIGURE 112
VDL GROEP: COMPANY SNAPSHOT


FIGURE 113
EBUSCO: COMPANY SNAPSHOT


FIGURE 114
XIAMEN KING LONG INTERNATIONAL TRADING CO., LTD.: COMPANY SNAPSHOT


Methodology

The study encompassed four primary tasks to determine the present and future scope of the electric bus market. Initially, extensive secondary research was conducted to gather data on the market, its related sectors, and overarching industries. Subsequently, primary research involving industry experts across the supply chain corroborated and validated these findings and assumptions. The complete market size was estimated by using the bottom-up methodology. Following this, a market breakdown and data triangulation approach were utilized to determine the size of specific segments and subsegments within the market.

Secondary Research

Secondary sources for this research study included electric vehicle industry organizations such as the World Electric Vehicle Association and corporate filings such as annual reports, investor presentations, and financial statements. Secondary data was collected and analyzed to determine the total market size, further validated by primary research.

Primary Research

Extensive primary research was conducted through secondary research after understanding the electric bus market scenario. Several primary interviews were conducted with market experts from both the demand (OEMs) and supply (electric bus and component manufacturers) sides across major regions, namely Asia Pacific, Europe, Latin America, the Middle East & Africa, and North America. Approximately 90% and 10% of primary interviews were conducted with the OEM and Tier I players, respectively. Primary data was collected through questionnaires, emails, and telephonic interviews. In the canvassing of primaries, various departments within organizations, such as sales, operations, and marketing, were covered to provide a holistic viewpoint in the report.

After interacting with industry experts, brief sessions were conducted with highly experienced independent consultants to reinforce the findings from the primaries. This and the in-house subject matter experts’ opinions led to the findings described in the remainder of this report.

Electric Bus Market Size, and Share

Note: Company tiers are based on the supply chain; company revenue is not considered. Tier 1 includes component
manufacturers and suppliers to OEMs, and Tier 2 includes component suppliers to Tier 1.
*Others include sales, marketing, and product managers.

To know about the assumptions considered for the study, download the pdf brochure

Market Size Estimation

A detailed market estimation approach was followed to estimate and validate the value of the electric bus market and other dependent submarkets.

  • The bottom-up approach was used to estimate and validate the size of the market. Firstly, the country-wise sales of electric buses were mapped from country-level associations, paid databases, and sources such as ICCT and IEA. The sales forecast for electric buses by country and region was based on macroeconomic indicators, emission regulations, automotive industry growth, GDP growth, and government initiatives for sustainable mobility.
  • Secondly, all segments of the market were derived by mapping different electric buses, by different regions for their technical specifications such as battery capacity, propulsion, range, length, GVW, power output, seating capacity, and application.
  • The market forecasts were estimated on factors such as developments by key OEMs, current market scenarios, country-wise initiatives and incentives for electric buses,  and based on insights shared by industry experts.
  • Each country/region’s total volume was later summed up to reveal the total volume of the global market. The data was validated through primary interviews with industry experts.

Electric Bus Market : Top-Down and Bottom-Up Approach

Electric Bus Market Top Down and Bottom Up Approach

Data Triangulation

After arriving at the overall size of the vehicles complying with the electric bus market through the methodology mentioned above, the market was split into several segments and subsegments. Data triangulation is a research technique used to increase the validity and reliability of findings by cross-validating data from multiple sources or methods. This technique involves the use of multiple sources of data, such as surveys, interviews, observations, and secondary data, to confirm and corroborate the findings obtained from each source. The extrapolated market data was triangulated by studying various macro indicators and regional trends from both the supply and demand sides.

Market Definition

An electric bus is a type of bus powered by electricity rather than fossil fuels such as gasoline or diesel. It uses electric motors for propulsion, with energy generally stored in onboard batteries that can be charged through electrical outlets or charging stations. Electric buses produce zero emissions while driving, making them a cleaner and quieter alternative to conventional buses, and are often used in public transit, school, and shuttle services. They are more energy-efficient, offer lower operating costs, and typically feature regenerative braking systems that help recharge their batteries during operation.

Stakeholders

  • Associations, Forums, and Alliances Related to Electric Vehicles
  • Automotive Industry Investors
  • Automotive Software Manufacturers and Providers
  • Companies Operating in Autonomous Vehicle Ecosystem
  • Electric Bus Manufacturers
  • EV Charging Equipment Manufacturers
  • EV Charging Infrastructure Service Providers
  • EV Component Suppliers
  • EV Distributors and Retailers
  • Government Agencies and Policy Makers

Report Objectives

  • To segment and forecast the electric bus market size in terms of volume & value:
    • By propulsion (BEVs and FCEVs)
    • By length of the bus (less than 9 m, 9–14 m, more than 14 m)
    • By component (batteries, motors, fuel cell stacks, battery management systems, battery cooling systems, DC-DC converters, inverters, AC/DC chargers, and EV connectors)
    • By range (up to 300 miles and above 300 miles)
    • By power output (up to 250 kW and above 250 kW)
    • By battery capacity (up to 400 kWh and above 400 kWh)
    • By application (transit buses, coaches, school buses, and other applications)
    • By battery type (LFP batteries, NMC batteries, NCA batteries, and other batteries)
    • By seating capacity (up to 40 seats, 40–70 seats, and above 70 seats)
    • By consumers (government and private)
    • By GVW (Up to 10 tonnes, 10 to 20 tonnes, and above 20 tonnes)
    • By level of autonomy (semi-autonomous and autonomous)
    • By region (North America, Europe, Asia Pacific, Latin America, and the Middle East & Africa)
  • To provide detailed information about the major factors influencing the market growth (drivers, challenges, restraints, and opportunities)
  • To track and analyze competitive developments, such as product launches, deals, and other activities by key industry participants.
  • To strategically analyze the market with value chain analysis, bill of materials, revenue analysis, and regulatory analysis in the electric bus market
  • To examine the opportunities in the market for stakeholders and provide details of the competitive landscape for market leaders

Available Customizations

With the given market data, MarketsandMarkets offers customizations according to the specific requirements of companies. The following customization options are available for the report:

Electric bus market, by range at the country-level (for countries covered in the report)

  • Up to 200 miles
  • Above 200 miles

Electric bus market, by battery type at the country level (for countries covered in the report)

  • LFP
  • NMC
  • NCA
  • Others

Company Information

  • Profiles of additional market players (up to five)


Personalize This Research

  • Triangulate with your Own Data
  • Get Data as per your Format and Definition
  • Gain a Deeper Dive on a Specific Application, Geography, Customer or Competitor
  • Any level of Personalization
Request A Free Customisation

Let Us Help You

  • What are the Known and Unknown Adjacencies Impacting the Electric Bus Market
  • What will your New Revenue Sources be?
  • Who will be your Top Customer; what will make them switch?
  • Defend your Market Share or Win Competitors
  • Get a Scorecard for Target Partners
Customized Workshop Request

Custom Market Research Services

We Will Customise The Research For You, In Case The Report Listed Above Does Not Meet With Your Requirements

Get 10% Free Customisation

Growth opportunities and latent adjacency in Electric Bus Market

Maria

Jul, 2022

MnM while conducting the given research on “Electric Bus Market” have contacted and conducted primary interviews from all major players from the Electric Vehicle eco-system consisting of Bus manufacturers, bus components manufacturers, EV charging infrastructure service and equipment providers, EV experts, country level government associations and agencies etc. All major market numbers, penetration rates and growth rates have been discussed and validated through primary interviews..

DMCA.com Protection Status