AVAS Market

AVAS Market by Propulsion Type, Vehicle Type (Passenger Cars, Commercial Vehicles), Electric 2-Wheeler (E-scooter/Moped, E-motorcycle), Sales Channel, Mounting Position (Integrated, Separated) and Region - Global Forecast to 2030

Report Code: AT 7301 Jun, 2024, by marketsandmarkets.com

[231 Pages Report] The global AVAS market was valued at USD 1.2 billion in 2024 and is expected to reach USD 1.7 billion by 2030 and grow at a CAGR of 6.4% over the forecast period. The growth of the AVAS market is driven by a rising emphasis on pedestrian and cyclist safety. As electric vehicles are quieter at low speeds they generate low sound at low speeds as compared to ICE vehicles, which pose a threat to commuters. The escalating adoption of electric and hybrid vehicles and the government mandates for the implementation of AVAS in all types of EVs, boost the AVAS market. Further, the rising adoption of electric 2-wheelers fosters the expansion of the AVAS market.

AVAS Market

To know about the assumptions considered for the study, Request for Free Sample Report

AVAS Market Opportunities

To know about the assumptions considered for the study, download the pdf brochure

Market Dynamics:

Driver: Growing adoption of electric 2-wheelers

As the adoption of electric motorcycles, scooters, and bicycles accelerates, especially in urban environments, the need for effective alert systems to enhance pedestrian safety becomes increasingly pressing. Electric 2-wheelers operate much more quietly than their internal combustion engine counterparts. While this characteristic reduces noise pollution, it poses a safety risk for pedestrians and other road users who might not hear these vehicles approaching. Integrating AVAS into electric 2-wheelers addresses this issue by emitting sounds that alert pedestrians to their presence, thereby reducing the risk of accidents. The global market for electric 2-wheelers is expanding rapidly, driven by growing environmental awareness, government incentives, and advancements in battery technology. This growth creates a significant and expanding market for AVAS. Governments and regulatory bodies are increasingly focusing on the safety implications of silent EVs. In several regions, regulations either already require or are considering mandating AVAS for electric 2-wheelers. This regulatory push supports the widespread adoption of AVAS, as manufacturers must comply with these safety standards.

Advancements in sound technology and sensor integration make it possible to develop AVAS specifically tailored to the unique needs of electric 2-wheelers. These systems can be designed to emit sounds that effectively alert pedestrians while remaining pleasant and non-disruptive. Consumer awareness of the safety benefits of AVAS is growing, which is likely to increase demand for electric 2-wheelers equipped with these systems. As consumers become more safety-conscious, manufacturers will be driven to include AVAS as a standard feature in their electric 2-wheeler models. This shift in consumer preferences can drive the market forward, encouraging innovation and adoption of AVAS technologies. AVAS providers such as Continental AG, Hella GmbH & Co. KGaA, and THOR AVAS are actively supplying AVAS for electric 2-wheelers. Ola Electric Mobility Pvt Ltd. (India) and Ather Energy (India), among others, are incorporating AVAS technology into their electric 2-wheelers. The Volvo Car Group (Sweden) and Zhejiang Geely Holding's (China) Polestar 2 also feature AVAS technology.

Restrain: Inconsistent speed range regulation

Different countries and regions have their specific requirements for activating an AVAS, which creates a complex landscape for manufacturers. For instance, while the US requires AVAS to function at speeds up to 19 mph (30 km/h), the EU mandates their use up to 12 mph (20 km/h). This disparity means automakers and AVAS manufacturers must design systems that comply with multiple sets of regulations, increasing the complexity and cost of development and production.

This variability can lead to delays in product launches and additional expenses for testing and certification across different markets. It also complicates the integration of AVAS into vehicle designs, as manufacturers must ensure that the systems are adaptable to the various regulatory requirements without compromising performance or reliability. These differences can create confusion among consumers and stakeholders, potentially slowing the adoption of AVAS technologies. Standardizing these regulations globally could help streamline the market, reduce costs, and accelerate the deployment of AVAS, enhancing pedestrian safety worldwide.

Opportunity: Increasing demand for customized solutions

As technology progresses, there is an increasing demand for AVAS that meet regulatory requirements and offer enhanced and tailored sound features. These advanced systems can be programmed with various sounds that are effective in alerting pedestrians and customizable to reflect brand identity or improve the auditory experience. This customization allows manufacturers to differentiate their vehicles in the market, offering a unique selling point that can attract safety-conscious consumers and enhance brand loyalty. Tailored AVAS sounds can be designed to convey different types of information, such as indicating the speed or direction of the vehicles and improving overall pedestrian awareness and safety. The development and adoption of sophisticated AVAS presents avenues for collaborations between automotive companies and audio technology firms, fostering innovation and potentially leading to the creation of new industry standards. Manufacturers can enhance the safety, appeal, and distinctiveness of EVs with advanced customizable AVAS, driving market growth.

BMW AG (Germany), Mercedes-Benz (Germany), Audi AG (Germany), and Porsche AG (Germany), among others, are incorporating customized sound in their vehicle models. For instance, recognizing the importance of creating a distinctive and brand-specific auditory experience, in 2022 BMW has developed customized AVAS sounds for its EVs. The company enlisted renowned composer Hans Zimmer to produce various sounds for its vehicle models to achieve this.

Challenges: Compliance with sound standardization mandates

Standardizing sounds emitted by AVAS is one of the major challenges automotive OEMs and aftermarket manufacturers face. Some brands count on the sound the car produces after it is started. An entertaining electronic engine sound system can make the EV more appealing to buy and drive. In January 2010, Japan's Ministry of Land, Infrastructure, Transport, and Tourism issued guidelines for hybrid and other near-silent vehicles, indicating that warning sounds similar to traditional engine noises are the most effective countermeasures against accident risks. According to EU rules, AVAS should be a continuous sound that provides information to pedestrians and other road users of vehicles in operation. The sound should be easily indicative of vehicle behavior and similar to a vehicle of the same category equipped with an ICE. Complying with all such mandates to implement AVAS is expected to be a major challenge for automotive OEMs and other aftermarket manufacturers.

Market Ecosystem

Top Companies in AVAS Market

The passenger car vehicle segment is estimated to hold the largest share of the AVAS market during the forecast period.

The passenger car segment is expected to represent a significant opportunity for EVs in the automotive industry, which consist of sedans, SUVs, hatchbacks among others. Currently it is the largest vehicle segment and is poised for massive expansion in the near future. The section’s growth mainly driven by the availability of different vehicle models, use of advanced technologies in vehicles, the rising consumer awareness and government incentives such as subsidies as well as rebates on taxes.

As people are opting for EVs, the demand for passenger vehicles has been increased. EVs have shorter wait times compared to traditional gasoline cars in countries such as China. Due to stringent environmental regulations, European countries aim at reducing transport emissions by quite a margin between 2030 and 2035.  Further, the US and China aims to electrify 50% of their vehicle fleets by 2030. The quick growth of EV charging stations is also playing a big role in boosting the EV passenger car market. However, due to the silent operation of these vehicles, pedestrians on the road fail to realize the presence of EVs approaching them. Also, as there is no engine noise even at higher RPMs, it becomes difficult to perceive or realize the speed of the moving EV. Many economies, such as Europe and the US, have started mandating AVAS in every EV to counter such situations.

PHEV segment is estimated to hold a significant share of the AVAS market during the forecast period.

PHEVs use rechargeable batteries that can becharged by plugging into external power sources. They have characteristics of both EV and traditional ICE vehicles. They also have a longer electric range than HEVs and they don not cause range anxiety as BEVs often do. PHEVs can be divided into two main categories including series and parallel. The ICE generates electricity for the motor in a series PHEVs, while only the electric motor drives the wheels. While in parallel PHEVs an electric motor and ICE are both connected to the powertrain. An AVAS must be installed in a PHEV due to their silent operation at low speeds while running on battery electric power mode. The AVAS system gets automatically turned off when the ICE engine is running.

Major PHEV manufacturers include BYD, Li Auto, Toyota, BMW, Volkswagen, Mitsubishi (Japan), Honda (Japan), and Mercedes Benz. They have launched several PHEVs that are in high demand in the market. PHEV models such as the Honda Accord and Honda Clarity are equipped with AVAS. The increasing number of charging stations in countries such as China and the US is expected to increase the demand for PHEVs. The demand for PHEVs is also expected to rise due to tax benefits and incentives provided by various governments. However, the demand for PHEVs in Europe is expected to decrease due to stringent BEV targets, while North America and Asia Pacific have supported the growth of PHEVs through vehicle ownership tax reductions, state incentives, charging-based incentives, and a high fuel price difference.

“Asia Pacific is estimated to be the largest market during the forecast period.”

The rapid adoption of EVs in the Asia Pacific countries will require necessary safety measures to avoid accidents caused by the lack of noise emanating from electric and hybrid vehicles. EV manufacturers such as BYD and Zhidou have already installed AVAS to enhance vehicle and pedestrian safety. Also, countries such as China, Japan, India, and South Korea are potential markets for electric scooters that are expected to be equipped with pedestrian warning systems in the future. India is taking concrete steps to adopt EVs with the co-existence of ICE vehicles. The government aims to increase the number of EVs by coming up with initiatives such as the National Electric Mobility Mission Plan (NEMMP) and Faster Adoption and Manufacturing of (Hybrid) and Electric Vehicles (FAME). The Japanese government also aims to develop their EV infrastructure with many OEMs within the country producing BEVs, PHEVs, & FCEVs. South Korea also intends to increase the adoption of EVs in the country, with OEMs such as Hyundai and Kia trying to introduce high-performance EVs in the market.  Top automakers from Europe and the US are increasingly supplying EVs to the Asian market. This growing presence is expected to boost EV sales in the Asia Pacific region, which will, in turn, drive the demand for the AVAS market.

North American AVAS Market Size, and Share

Key Market Players

The AVAS market is dominated by major players, including Continental AG (Germany), Hella GMBH & CO. KGAA (Germany), Kendrion N. V. (Netherlands), Harman International (US), and Denso Corporation (Japan). These companies offer AVAS to major OEMs and have strong distribution networks at the global level. These companies have adopted extensive expansion strategies and undertaken collaborations, partnerships, and mergers & acquisitions to gain traction in the AVAS market.

Get online access to the report on the World's First Market Intelligence Cloud

  • Easy to Download Historical Data & Forecast Numbers
  • Company Analysis Dashboard for high growth potential opportunities
  • Research Analyst Access for customization & queries
  • Competitor Analysis with Interactive dashboard
  • Latest News, Updates & Trend analysis
Request Sample

Scope of the Report

Report Metric

Details

Market size available for years

2020–2030

Base year considered

2023

Forecast period

2024-2030

Forecast units

Volume (Thousand Units), Value (USD Million/Billion)

Segments covered

Propulsion Type, Vehicle Type, Electric 2-Wheeler, Sales Channel, Mounting Position, and Region.

Geographies covered

Asia Pacific, Europe, and North America

Companies Covered

Continental AG (Germany), Hella GMBH & CO. KGAA (Germany), Kendrion N. V. (Netherlands), Harman International (US), and Denso Corporation (Japan)
Total 28 major players across four regions covered

This research report categorizes the AVAS market based on propulsion type, vehicle type, electric 2-wheeler, sales channel, mounting position and region.

Based on Propulsion Type:
  • BEV
  • PHEV
  • FCEV
Based on Vehicle Type:
  • Passenger Cars
  • Commercial Vehicles
Based on Electric 2-wheeler:
  • E-scooter/Moped
  • E-motorcycle
Based on Sales Channel:
  • OEM
  • Aftermarket
Based on Mounting Position:
  • Integrated
  • Separated
Based on the Region:
  • Asia Pacific (APAC)
    • China
    • India
    • Japan
    • South Korea
  • North America (NA)
    • US
    • Canada
  • Europe (EU)
    • Austria
    • Denmark
    • France
    • Germany
    • Netherlands
    • Norway
    • Spain
    • Sweden
    • Switzerland
    • UK

Recent Developments

  • In December 2020, Ford Motor Company partnered with Harman International for its Mustang Mach-E 1400. The vehicle is equipped with Harman's HALOsonic eESS technology, alongside Harman's AVAS speakers.
  • In April 2020, Volvo Car Group and Zhejiang Geely Holding collaborated with Harman International for the Polestar 2 car's AVAS technology. It was the Group's first car to feature AVAS technology.
  • In February 2020, Hyundai Motor Company and Harman International partnered on the world's first road noise cancellation system. RANC system reduces unwanted noise by up to 50%. It is powered by Harman's HALOsonic suite of noise cancellation technologies.

Frequently Asked Questions (FAQ):

To speak to our analyst for a discussion on the above findings, click Speak to Analyst

TABLE OF CONTENTS
 
1 INTRODUCTION (Page No. - 22)
    1.1 STUDY OBJECTIVES 
    1.2 MARKET DEFINITION 
           TABLE 1 AVAS MARKET DEFINITION, BY VEHICLE TYPE
           TABLE 2 AVAS MARKET DEFINITION, BY MOUNTING POSITION
           TABLE 3 AVAS MARKET DEFINITION, BY PROPULSION TYPE
           TABLE 4 AVAS MARKET DEFINITION, BY SALES CHANNEL
           TABLE 5 AVAS MARKET DEFINITION, BY ELECTRIC 2-WHEELER
           1.2.1 INCLUSIONS AND EXCLUSIONS
                    TABLE 6 INCLUSIONS AND EXCLUSIONS
    1.3 MARKET SCOPE 
           1.3.1 MARKETS COVERED
                    FIGURE 1 AVAS MARKET SEGMENTATION
           1.3.2 REGIONS COVERED
           1.3.3 YEARS CONSIDERED
    1.4 CURRENCY CONSIDERED 
    1.5 UNIT CONSIDERED 
           TABLE 7 USD EXCHANGE RATES
    1.6 STAKEHOLDERS 
    1.7 SUMMARY OF CHANGES 
 
2 RESEARCH METHODOLOGY (Page No. - 29)
    2.1 RESEARCH DATA 
           FIGURE 2 RESEARCH DESIGN
           FIGURE 3 RESEARCH PROCESS FLOW
           2.1.1 SECONDARY DATA
                    2.1.1.1 Key secondary sources
                    2.1.1.2 Key data from secondary sources
           2.1.2 PRIMARY DATA
                    2.1.2.1 Primary interview participants
                    2.1.2.2 Key industry insights
                               FIGURE 4 KEY INDUSTRY INSIGHTS
                    2.1.2.3 Breakdown of primary interviews
                               FIGURE 5 BREAKDOWN OF PRIMARY INTERVIEWS: BY COMPANY TYPE, DESIGNATION, AND REGION
                    2.1.2.4 List of primary participants
    2.2 MARKET SIZE ESTIMATION METHODOLOGY 
           FIGURE 6 RESEARCH METHODOLOGY: HYPOTHESIS BUILDING
           2.2.1 RECESSION IMPACT ANALYSIS
           2.2.2 BOTTOM-UP APPROACH
           FIGURE 7 BOTTOM-UP APPROACH
           2.2.3 TOP-DOWN APPROACH
                    FIGURE 8 TOP-DOWN APPROACH
                    FIGURE 9 RESEARCH DESIGN AND METHODOLOGY
    2.3 MARKET BREAKDOWN AND DATA TRIANGULATION 
           FIGURE 10 DATA TRIANGULATION
           FIGURE 11 MARKET GROWTH PROJECTIONS FROM DEMAND-SIDE DRIVERS
    2.4 FACTOR ANALYSIS 
           FIGURE 12 FACTOR ANALYSIS
    2.5 RESEARCH ASSUMPTIONS 
    2.6 RESEARCH LIMITATIONS 
    2.7 RISK ANALYSIS 
 
3 EXECUTIVE SUMMARY (Page No. - 43)
    FIGURE 13 AVAS MARKET OUTLOOK 
    FIGURE 14 AVAS MARKET, BY REGION 
    FIGURE 15 PASSENGER CAR SEGMENT TO LEAD MARKET DURING FORECAST PERIOD 
    FIGURE 16 BATTERY ELECTRIC VEHICLE SEGMENT TO LEAD MARKET DURING FORECAST PERIOD 
    FIGURE 17 KEY PLAYERS IN AVAS MARKET 
 
4 PREMIUM INSIGHTS (Page No. - 48)
    4.1 ATTRACTIVE OPPORTUNITIES FOR PLAYERS IN AVAS MARKET 
           FIGURE 18 GOVERNMENT REGULATIONS AND EMPHASIS ON COMMUTER SAFETY TO DRIVE MARKET
    4.2 AVAS MARKET, BY PROPULSION TYPE 
           FIGURE 19 BATTERY ELECTRIC VEHICLE TO BE LARGEST PROPULSION TYPE DURING FORECAST PERIOD
    4.3 AVAS MARKET, BY VEHICLE TYPE 
           FIGURE 20 PASSENGER CAR TO BE LEADING VEHICLE TYPE DURING FORECAST PERIOD
    4.4 AVAS MARKET, BY MOUNTING POSITION 
           FIGURE 21 INTEGRATED AVAS TO DOMINATE MARKET DURING FORECAST PERIOD
    4.5 AVAS MARKET, BY SALES CHANNEL 
           FIGURE 22 OEM SEGMENT TO GROW AT SIGNIFICANT RATE DURING FORECAST PERIOD
    4.6 AVAS MARKET, BY ELECTRIC 2-WHEELER 
           FIGURE 23 E-SCOOTER/MOPED SEGMENT TO GENERATE HIGHER DEMAND FOR AVAS DURING FORECAST PERIOD
    4.7 AVAS MARKET, BY REGION 
           FIGURE 24 ASIA PACIFIC TO ACCOUNT FOR DOMINANT MARKET SHARE IN 2024
 
5 MARKET OVERVIEW (Page No. - 52)
    5.1 INTRODUCTION 
           FIGURE 25 ACOUSTIC VEHICLE ALERTING SYSTEM
    5.2 MARKET DYNAMICS 
           FIGURE 26 DRIVERS, RESTRAINTS, OPPORTUNITIES, AND CHALLENGES
           5.2.1 DRIVERS
                    5.2.1.1 Favorable government policies for implementing AVAS
                               FIGURE 27 AVAS REGULATIONS WORLDWIDE
                    5.2.1.2 Booming electric vehicle market
                               FIGURE 28 ELECTRIC VEHICLE SALES, 2020–2023
                    5.2.1.3 Rising emphasis on pedestrian safety
                               FIGURE 29 ELECTRIC VEHICLE WARNING SOUNDS FOR PEDESTRIANS AND BIKERS
                    5.2.1.4 Growing adoption of electric 2-wheelers
                               FIGURE 30 ELECTRIC 2-WHEELER SALES, 2020–2023
           5.2.2 RESTRAINTS
                    5.2.2.1 Inconsistent speed range regulations
                               TABLE 8 MINIMUM SOUND REQUIREMENTS FOR AVAS IN US AND EUROPE
           5.2.3 OPPORTUNITIES
                    5.2.3.1 Rapid growth of micro-mobility sector
                               FIGURE 31 AVAS FOR SHARED AND MICRO-MOBILITY FLEETS
                    5.2.3.2 Increasing inclination toward customized solutions
           5.2.4 CHALLENGES
                    5.2.4.1 Compliance with sound standardization mandates
                               TABLE 9 IMPACT OF MARKET DYNAMICS
    5.3 TRENDS/DISRUPTIONS IMPACTING CUSTOMERS 
           FIGURE 32 TRENDS/DISRUPTIONS IMPACTING CUSTOMERS
    5.4 VALUE CHAIN ANALYSIS 
           FIGURE 33 VALUE CHAIN ANALYSIS
    5.5 TECHNOLOGY ANALYSIS 
           5.5.1 INTRODUCTION
           5.5.2 KEY TECHNOLOGIES
                    5.5.2.1 Pre-designed Sound Libraries
                               FIGURE 34 SOUND DESIGN PROCESS
                    5.5.2.2 Innovative Actuator-based Acoustic Systems
                               FIGURE 35 CONTINENTAL AG: AVAS SOLUTION
                               FIGURE 36 AVAS LAYOUT
                    5.5.2.3 Digital Signal Processing (DSP)
                               FIGURE 37 AVAS: BLOCK DIAGRAM
           5.5.3 COMPLEMENTARY TECHNOLOGIES
                    5.5.3.1 V2X Communication
                               FIGURE 38 TYPES OF V2X COMMUNICATION
                               FIGURE 39 V2P COMMUNICATION
                               5.5.3.2 Navigation and GPS Systems
                               FIGURE 40 BLOCK DIAGRAM OF VEHICLE NAVIGATION SYSTEM
           5.5.4 ADJACENT TECHNOLOGIES
                    5.5.4.1 Conjunction of ADAS, Camera, and Artificial Intelligence
                               FIGURE 41 SENSOR FUSION TECHNOLOGY
                    5.5.4.2 Autonomous Vehicles: Cybersecurity and Data Privacy
                               FIGURE 42 DATA FROM AUTONOMOUS VEHICLES
           5.5.5 UPCOMING TECHNOLOGICAL ADVANCEMENTS
    5.6 PRICING ANALYSIS 
           5.6.1 AVERAGE SELLING PRICE TREND OF KEY PLAYERS FOR ELECTRIC 2- AND 4-WHEELERS
                    TABLE 10 AVERAGE SELLING PRICE OF KEY PLAYERS FOR 2-WHEELERS, 2023 (USD)
                    TABLE 11 AVERAGE SELLING PRICE BY KEY PLAYERS FOR 4-WHEELERS, 2023 (USD)
           5.6.2 AVERAGE SELLING PRICE TREND, BY REGION
                    TABLE 12 AVERAGE SELLING PRICE TREND, BY REGION, 2020–2024 (USD/UNIT)
    5.7 ECOSYSTEM ANALYSIS 
           FIGURE 43 ECOSYSTEM ANALYSIS
           5.7.1 OEMS
           5.7.2 CHIP SUPPLIERS
           5.7.3 AVAS PROVIDERS
                    TABLE 13 ROLE OF COMPANIES IN ECOSYSTEM
    5.8 KEY OEM OFFERINGS 
           5.8.1 JAGUAR LAND ROVER LIMITED
           5.8.2 GENERAL MOTORS
           5.8.3 BMW AG
           5.8.4 AUDI
           5.8.5 MERCEDES-BENZ
           5.8.6 PORSCHE AG
           5.8.7 NISSAN MOTOR CO., LTD.
           5.8.8 HYUNDAI MOBIS
           5.8.9 MARUTI SUZUKI INDIA LIMITED
           5.8.10 OTHERS
    5.9 KEY STAKEHOLDERS AND BUYING CRITERIA 
           5.9.1 KEY STAKEHOLDERS IN BUYING PROCESS
                    FIGURE 44 INFLUENCE OF STAKEHOLDERS ON BUYING PROCESS FOR TOP 2 VEHICLE TYPES
                    TABLE 14 INFLUENCE OF STAKEHOLDERS ON BUYING PROCESS FOR TOP 2 VEHICLE TYPES (%)
           5.9.2 BUYING CRITERIA
                    FIGURE 45 KEY BUYING CRITERIA FOR TOP 2 VEHICLE TYPES
                    TABLE 15 KEY BUYING CRITERIA FOR TOP 2 VEHICLE TYPES
    5.10 CASE STUDY ANALYSIS 
           5.10.1 IMPLEMENTATION OF QUIET VEHICLE SOUNDER (QVS) BY CONWAY
           5.10.2 SAFETY ENHANCEMENT WITH QUIET VEHICLE SOUNDERS AT UNIVERSITY OF BIRMINGHAM
           5.10.3 NESOBUS SAFETY ENHANCEMENT WITH BRIGADE’S QVS
           5.10.4 HYUNDAI'S ACOUSTIC INNOVATION IN ELECTRIC VEHICLES
           5.10.5 BMW'S CREATIVE APPROACH TO ELECTRIC VEHICLE SOUND DESIGN
           5.10.6 PORSCHE'S INNOVATIVE AVAS FOR ELECTRIC VEHICLES
           5.10.7 REDEFINING ELECTRIC VEHICLE SAFETY WITH AUDI'S CUSTOMIZED AVAS
           5.10.8 MERCEDES-BENZ AVAS SET NEW STANDARD FOR ELECTRIC CARS
           5.10.9 MICRO-MOBILITY SAFETY ENHANCEMENT WITH THOR AVAS
    5.11 PATENT ANALYSIS 
           5.11.1 INTRODUCTION
                    FIGURE 46 PATENT ANALYSIS, 2014–2023
           5.11.2 LEGAL STATUS OF PATENTS
                    FIGURE 47 LEGAL STATUS OF PATENTS FILED FOR AVAS, 2014–2024
                    TABLE 16 INNOVATIONS AND PATENT REGISTRATIONS, 2020–2024
    5.12 REGULATORY LANDSCAPE 
           5.12.1 EUROPE
                    FIGURE 48 APPLICATION OF UN ECE REGULATION 138
           5.12.2 US
                    FIGURE 49 APPLICATION OF FMVSS 141
           5.12.3 CHINA
                    FIGURE 50 APPLICATION OF GB/T 37153-2018
           5.12.4 JAPAN
           5.12.5 INDIA
           5.12.6 REGULATORY BODIES, GOVERNMENT AGENCIES, AND OTHER ORGANIZATIONS
                    TABLE 17 ASIA PACIFIC: REGULATORY BODIES, GOVERNMENT AGENCIES, AND OTHER ORGANIZATIONS
                    TABLE 18 NORTH AMERICA: REGULATORY BODIES, GOVERNMENT AGENCIES, AND OTHER ORGANIZATIONS
                    TABLE 19 EUROPE: REGULATORY BODIES, GOVERNMENT AGENCIES, AND OTHER ORGANIZATIONS
    5.13 KEY CONFERENCES AND EVENTS 
                    TABLE 20 KEY CONFERENCES AND EVENTS, 2024–2025
    5.14 AVAS OPERATIONS IN MANAGING SOUND COMPLEXITY 
                    FIGURE 51 WORKING OF AVAS
 
6 AVAS MARKET, BY ELECTRIC 2-WHEELER (Page No. - 93)
    6.1 INTRODUCTION 
           FIGURE 52 AVAS MARKET, BY ELECTRIC 2-WHEELER, 2024–2030 (USD MILLION)
           TABLE 21 AVAS MARKET, BY ELECTRIC 2-WHEELER, 2020–2023 (THOUSAND UNITS)
           TABLE 22 AVAS MARKET, BY ELECTRIC 2-WHEELER, 2024–2030 (THOUSAND UNITS)
           TABLE 23 AVAS MARKET, BY ELECTRIC 2-WHEELER, 2020–2023 (USD MILLION)
           TABLE 24 AVAS MARKET, BY ELECTRIC 2-WHEELER, 2024–2030 (USD MILLION)
    6.2 E-SCOOTER/MOPED 
           6.2.1 REGULATIONS FOR PEDESTRIAN SAFETY IN LOW-SPEED VEHICLES TO DRIVE MARKET
                    TABLE 25 E-SCOOTER/MOPED: AVAS MARKET, BY REGION, 2020–2023 (THOUSAND UNITS)
                    TABLE 26 E-SCOOTER/MOPED: AVAS MARKET, BY REGION, 2024–2030 (THOUSAND UNITS)
                    TABLE 27 E-SCOOTER/MOPED: AVAS MARKET, BY REGION, 2020–2023 (USD MILLION)
                    TABLE 28 E-SCOOTER/MOPED: AVAS MARKET, BY REGION, 2024–2030 (USD MILLION)
    6.3 E-MOTORCYCLE 
           6.3.1 RISING DEMAND FOR ENGINE SOUNDS IN ELECTRIC MOTORCYCLES TO DRIVE MARKET
                    TABLE 29 E-MOTORCYCLE: AVAS MARKET, BY REGION, 2020–2023 (THOUSAND UNITS)
                    TABLE 30 E-MOTORCYCLE: AVAS MARKET, BY REGION, 2024–2030 (THOUSAND UNITS)
                    TABLE 31 E-MOTORCYCLE: AVAS MARKET, BY REGION, 2020–2023 (USD MILLION)
                    TABLE 32 E-MOTORCYCLE: AVAS MARKET, BY REGION, 2024–2030 (USD MILLION)
    6.4 KEY PRIMARY INSIGHTS 
 
7 AVAS MARKET, BY SALES CHANNEL (Page No. - 99)
    7.1 INTRODUCTION 
           FIGURE 53 AVAS MARKET, BY SALES CHANNEL, 2024–2030 (USD MILLION)
           TABLE 33 AVAS MARKET, BY SALES CHANNEL, 2020–2023 (THOUSAND UNITS)
           TABLE 34 AVAS MARKET, BY SALES CHANNEL, 2024–2030 (THOUSAND UNITS)
           TABLE 35 AVAS MARKET, BY SALES CHANNEL, 2020–2023 (USD MILLION)
           TABLE 36 AVAS MARKET, BY SALES CHANNEL, 2024–2030 (USD MILLION)
    7.2 OEM 
           7.2.1 DEVELOPMENT OF UNIQUE SOUND SIGNATURES BY OEMS TO DRIVE MARKET
                    TABLE 37 OEM: AVAS MARKET, BY REGION, 2020–2023 (THOUSAND UNITS)
                    TABLE 38 OEM: AVAS MARKET, BY REGION, 2024–2030 (THOUSAND UNITS)
                    TABLE 39 OEM: AVAS MARKET, BY REGION, 2020–2023 (USD MILLION)
                    TABLE 40 OEM: AVAS MARKET, BY REGION, 2024–2030 (USD MILLION)
    7.3 AFTERMARKET 
    7.4 KEY PRIMARY INSIGHTS 
 
8 AVAS MARKET, BY MOUNTING POSITION (Page No. - 104)
    8.1 INTRODUCTION 
           FIGURE 54 INTEGRATED SEGMENT TO GROW AT HIGHER CAGR DURING FORECAST PERIOD
           TABLE 41 AVAS MARKET, BY MOUNTING POSITION, 2020–2023 (THOUSAND UNITS)
           TABLE 42 AVAS MARKET, BY MOUNTING POSITION, 2024–2030 (THOUSAND UNITS)
           TABLE 43 AVAS MARKET, BY MOUNTING POSITION, 2020–2023 (USD MILLION)
           TABLE 44 AVAS MARKET, BY MOUNTING POSITION, 2024–2030 (USD MILLION)
    8.2 SEPARATED 
           8.2.1 FLEXIBLE PLACEMENT ACROSS DIFFERENT VEHICLE TYPES AND MODELS TO DRIVE MARKET
                    TABLE 45 SEPARATED POSITION: AVAS MARKET, BY REGION, 2020–2023 (THOUSAND UNITS)
                    TABLE 46 SEPARATED POSITION: AVAS MARKET, BY REGION, 2024–2030 (THOUSAND UNITS)
                    TABLE 47 SEPARATED POSITION: AVAS MARKET, BY REGION, 2020–2023 (USD MILLION)
                    TABLE 48 SEPARATED POSITION: AVAS MARKET, BY REGION, 2024–2030 (USD MILLION)
    8.3 INTEGRATED 
           8.3.1 TECHNOLOGICAL ADVANCEMENTS AND OEM COLLABORATIONS WITH TIER I SUPPLIERS TO DRIVE MARKET
                    TABLE 49 INTEGRATED POSITION: AVAS MARKET, BY REGION, 2020–2023 (THOUSAND UNITS)
                    TABLE 50 INTEGRATED POSITION: AVAS MARKET, BY REGION, 2024–2030 (THOUSAND UNITS)
                    TABLE 51 INTEGRATED POSITION: AVAS MARKET, BY REGION, 2020–2023 (USD MILLION)
                    TABLE 52 INTEGRATED POSITION: AVAS MARKET, BY REGION, 2024–2030 (USD MILLION)
    8.4 KEY PRIMARY INSIGHTS 
 
9 AVAS MARKET, BY PROPULSION TYPE (Page No. - 110)
    9.1 INTRODUCTION 
           TABLE 53 APPLICATION OF AVAS IN BATTERY ELECTRIC VEHICLE VS. PLUG-IN HYBRID ELECTRIC VEHICLE VS. FUEL CELL ELECTRIC VEHICLE
           FIGURE 55 BATTERY ELECTRIC VEHICLE SEGMENT TO LEAD MARKET DURING FORECAST PERIOD (USD MILLION)
           TABLE 54 AVAS MARKET, BY PROPULSION TYPE, 2020–2023 (THOUSAND UNITS)
           TABLE 55 AVAS MARKET, BY PROPULSION TYPE, 2024–2030 (THOUSAND UNITS)
           TABLE 56 AVAS MARKET, BY PROPULSION TYPE, 2020–2023 (USD MILLION)
           TABLE 57 AVAS MARKET, BY PROPULSION TYPE, 2024–2030 (USD MILLION)
    9.2 OPERATIONAL DATA 
           FIGURE 56 ELECTRIC VEHICLE SALES BY LEADING OEMS IN 2023
    9.3 BATTERY ELECTRIC VEHICLE 
           9.3.1 AVAILABILITY IN MULTIPLE SEGMENTS TO DRIVE MARKET
                    TABLE 58 BATTERY ELECTRIC VEHICLE: AVAS MARKET, BY REGION, 2020–2023 (THOUSAND UNITS)
                    TABLE 59 BATTERY ELECTRIC VEHICLE: AVAS MARKET, BY REGION, 2024–2030 (THOUSAND UNITS)
                    TABLE 60 BATTERY ELECTRIC VEHICLE: AVAS MARKET, BY REGION, 2020–2023 (USD MILLION)
                    TABLE 61 BATTERY ELECTRIC VEHICLE: AVAS MARKET, BY REGION, 2024–2030 (USD MILLION)
    9.4 PLUG-IN HYBRID ELECTRIC VEHICLE 
           9.4.1 INCREASING NUMBER OF CHARGING STATIONS TO DRIVE MARKET
                    TABLE 62 PLUG-IN HYBRID ELECTRIC VEHICLE: AVAS MARKET, BY REGION, 2020–2023 (THOUSAND UNITS)
                    TABLE 63 PLUG-IN HYBRID ELECTRIC VEHICLE: AVAS MARKET, BY REGION, 2024–2030 (THOUSAND UNITS)
                    TABLE 64 PLUG-IN HYBRID ELECTRIC VEHICLE: AVAS MARKET, BY REGION, 2020–2023 (USD MILLION)
                    TABLE 65 PLUG-IN HYBRID ELECTRIC VEHICLE: AVAS MARKET, BY REGION, 2024–2030 (USD MILLION)
    9.5 FUEL CELL ELECTRIC VEHICLE 
           9.5.1 LONGER DRIVING RANGE AND BETTER ENVIRONMENTAL SUSTAINABILITY THAN OTHER EVS TO DRIVE MARKET
                    TABLE 66 FUEL CELL ELECTRIC VEHICLE: AVAS MARKET, BY REGION, 2020–2023 (THOUSAND UNITS)
                    TABLE 67 FUEL CELL ELECTRIC VEHICLE: AVAS MARKET, BY REGION, 2024–2030 (THOUSAND UNITS)
                    TABLE 68 FUEL CELL ELECTRIC VEHICLE: AVAS MARKET, BY REGION, 2020–2023 (USD MILLION)
                    TABLE 69 FUEL CELL ELECTRIC VEHICLE: AVAS MARKET, BY REGION, 2024–2030 (USD MILLION)
    9.6 KEY PRIMARY INSIGHTS 
 
10 AVAS MARKET, BY VEHICLE TYPE (Page No. - 119)
     10.1 INTRODUCTION 
               FIGURE 57 PASSENGER CAR SEGMENT TO LEAD MARKET DURING FORECAST PERIOD
               TABLE 70 AVAS MARKET, BY VEHICLE TYPE, 2020–2023 (THOUSAND UNITS)
               TABLE 71 AVAS MARKET, BY VEHICLE TYPE, 2024–2030 (THOUSAND UNITS)
               TABLE 72 AVAS MARKET, BY VEHICLE TYPE, 2020–2023 (USD MILLION)
               TABLE 73 AVAS MARKET, BY VEHICLE TYPE, 2024–2030 (USD MILLION)
     10.2 COMMERCIAL VEHICLE 
             10.2.1 GROWTH IN E-COMMERCE, LOGISTICS, AND SHARED MOBILITY SECTORS TO DRIVE MARKET
                       TABLE 74 COMMERCIAL VEHICLE: AVAS MARKET, BY REGION, 2020–2023 (THOUSAND UNITS)
                       TABLE 75 COMMERCIAL VEHICLE: AVAS MARKET, BY REGION, 2024–2030 (THOUSAND UNITS)
                       TABLE 76 COMMERCIAL VEHICLE: AVAS MARKET, BY REGION, 2020–2023 (USD MILLION)
                       TABLE 77 COMMERCIAL VEHICLE: AVAS MARKET, BY REGION, 2024–2030 (USD MILLION)
     10.3 PASSENGER CAR 
             10.3.1 GOVERNMENT INCENTIVES FOR PASSENGER CARS EQUIPPED WITH AVAS TO DRIVE MARKET
                       TABLE 78 PASSENGER CAR: AVAS MARKET, BY REGION, 2020–2023 (THOUSAND UNITS)
                       TABLE 79 PASSENGER CAR: AVAS MARKET, BY REGION, 2024–2030 (THOUSAND UNITS)
                       TABLE 80 PASSENGER CAR: AVAS MARKET, BY REGION, 2020–2023 (USD MILLION)
                       TABLE 81 PASSENGER CAR: AVAS MARKET, BY REGION, 2024–2030 (USD MILLION)
     10.4 KEY PRIMARY INSIGHTS 
 
11 AVAS MARKET, BY REGION (Page No. - 126)
     11.1 INTRODUCTION 
               TABLE 82 COMPARISON OF EUROPEAN AND US REGULATIONS ON MINIMUM SOUND REQUIREMENTS FOR HYBRID ELECTRIC VEHICLES
               TABLE 83 COMPARISON OF EUROPEAN AND US MINIMUM OVERALL SOUND PRESSURE LEVEL REQUIREMENTS FOR ELECTRIC VEHICLES
               FIGURE 58 AVAS MARKET, BY REGION, 2024 VS. 2030 (USD MILLION)
               TABLE 84 AVAS MARKET, BY REGION, 2020–2023 (THOUSAND UNITS)
               TABLE 85 AVAS MARKET, BY REGION, 2024–2030 (THOUSAND UNITS)
               TABLE 86 AVAS MARKET, BY REGION, 2020–2023 (USD MILLION)
               TABLE 87 AVAS MARKET, BY REGION, 2024–2030 (USD MILLION)
     11.2 ASIA PACIFIC 
             11.2.1 RECESSION IMPACT ANALYSIS
                       FIGURE 59 ASIA PACIFIC: AVAS MARKET SNAPSHOT
                       TABLE 88 ASIA PACIFIC: AVAS MARKET, BY COUNTRY, 2020–2023 (THOUSAND UNITS)
                       TABLE 89 ASIA PACIFIC: AVAS MARKET, BY COUNTRY, 2024–2030 (THOUSAND UNITS)
                       TABLE 90 ASIA PACIFIC: AVAS MARKET, BY COUNTRY, 2020–2023 (USD MILLION)
                       TABLE 91 ASIA PACIFIC: AVAS MARKET, BY COUNTRY, 2024–2030 (USD MILLION)
             11.2.2 CHINA
                       11.2.2.1 Strong electric vehicle supply chain to drive market
                                   TABLE 92 CHINA: TOTAL ELECTRIC VEHICLES ON ROAD (THOUSAND UNITS)
                                   TABLE 93 CHINA: AVAS MARKET, BY PROPULSION TYPE, 2020–2023 (THOUSAND UNITS)
                                   TABLE 94 CHINA: AVAS MARKET, BY PROPULSION TYPE, 2024–2030 (THOUSAND UNITS)
                                   TABLE 95 CHINA: AVAS MARKET, BY PROPULSION TYPE, 2020–2023 (USD MILLION)
                                   TABLE 96 CHINA: AVAS MARKET, BY PROPULSION TYPE, 2024–2030 (USD MILLION)
             11.2.3 INDIA
                       11.2.3.1 Growing adoption of electric vehicles and upcoming AVAS mandates to drive market
                                   TABLE 97 INDIA: TOTAL ELECTRIC VEHICLES ON ROAD (THOUSAND UNITS)
                                   TABLE 98 INDIA: AVAS MARKET, BY PROPULSION TYPE, 2020–2023 (THOUSAND UNITS)
                                   TABLE 99 INDIA: AVAS MARKET, BY PROPULSION TYPE, 2024–2030 (THOUSAND UNITS)
                                   TABLE 100 INDIA: AVAS MARKET, BY PROPULSION TYPE, 2020–2023 (USD MILLION)
                                   TABLE 101 INDIA: AVAS MARKET, BY PROPULSION TYPE, 2024–2030 (USD MILLION)
             11.2.4 JAPAN
                       11.2.4.1 Presence of leading electric vehicle manufacturers to drive market
                                   TABLE 102 JAPAN: AVAS MARKET, BY PROPULSION TYPE, 2020–2023 (THOUSAND UNITS)
                                   TABLE 103 JAPAN: AVAS MARKET, BY PROPULSION TYPE, 2024–2030 (THOUSAND UNITS)
                                   TABLE 104 JAPAN: AVAS MARKET, BY PROPULSION TYPE, 2020–2023 (USD MILLION)
                                   TABLE 105 JAPAN: AVAS MARKET, BY PROPULSION TYPE, 2024–2030 (USD MILLION)
             11.2.5 SOUTH KOREA
                       11.2.5.1 Tax incentives and subsidies for buying electric vehicles to drive market
                                   TABLE 106 SOUTH KOREA: AVAS MARKET, BY PROPULSION TYPE, 2020–2023 (THOUSAND UNITS)
                                   TABLE 107 SOUTH KOREA: AVAS MARKET, BY PROPULSION TYPE, 2024–2030 (THOUSAND UNITS)
                                   TABLE 108 SOUTH KOREA: AVAS MARKET, BY PROPULSION TYPE, 2020–2023 (USD MILLION)
                                   TABLE 109 SOUTH KOREA: AVAS MARKET, BY PROPULSION TYPE, 2024–2030 (USD MILLION)
     11.3 EUROPE 
               FIGURE 60 EUROPE: AVAS MARKET, BY COUNTRY, 2024–2030
               TABLE 110 EUROPE: AVAS MARKET, BY COUNTRY, 2020–2023 (THOUSAND UNITS)
               TABLE 111 EUROPE: AVAS MARKET, BY COUNTRY, 2024–2030 (THOUSAND UNITS)
               TABLE 112 EUROPE: AVAS MARKET, BY COUNTRY, 2020–2023 (USD MILLION)
               TABLE 113 EUROPE: AVAS MARKET, BY COUNTRY, 2024–2030 (USD MILLION)
             11.3.1 RECESSION IMPACT ANALYSIS
             11.3.2 FRANCE
                       11.3.2.1 Plans to boost electric car sales four times by 2027 to drive market
                                   TABLE 114 FRANCE: AVAS MARKET, BY PROPULSION TYPE, 2020–2023 (THOUSAND UNITS)
                                   TABLE 115 FRANCE: AVAS MARKET, BY PROPULSION TYPE, 2024–2030 (THOUSAND UNITS)
                                   TABLE 116 FRANCE: AVAS MARKET, BY PROPULSION TYPE, 2020–2023 (USD MILLION)
                                   TABLE 117 FRANCE: AVAS MARKET, BY PROPULSION TYPE, 2024–2030 (USD MILLION)
             11.3.3 GERMANY
                       11.3.3.1 Government initiatives to promote electric vehicles to drive market
                                   TABLE 118 GERMANY: AVAS MARKET, BY PROPULSION TYPE, 2020–2023 (THOUSAND UNITS)
                                   TABLE 119 GERMANY: AVAS MARKET, BY PROPULSION TYPE, 2024–2030 (THOUSAND UNITS)
                                   TABLE 120 GERMANY: AVAS MARKET, BY PROPULSION TYPE, 2020–2023 (USD MILLION)
                                   TABLE 121 GERMANY: AVAS MARKET, BY PROPULSION TYPE, 2024–2030 (USD MILLION)
             11.3.4 NETHERLANDS
                       11.3.4.1 Plans for ICE vehicle ban by 2030 to drive market
                                   TABLE 122 NETHERLANDS: AVAS MARKET, BY PROPULSION TYPE, 2020–2023 (THOUSAND UNITS)
                                   TABLE 123 NETHERLANDS: AVAS MARKET, BY PROPULSION TYPE, 2024–2030 (THOUSAND UNITS)
                                   TABLE 124 NETHERLANDS: AVAS MARKET, BY PROPULSION TYPE, 2020–2023 (USD MILLION)
                                   TABLE 125 NETHERLANDS: AVAS MARKET, BY PROPULSION TYPE, 2024–2030 (USD MILLION)
             11.3.5 NORWAY
                       11.3.5.1 Full commercialization of electric vehicle industry to drive market
                                   TABLE 126 NORWAY: AVAS MARKET, BY PROPULSION TYPE, 2020–2023 (THOUSAND UNITS)
                                   TABLE 127 NORWAY: AVAS MARKET, BY PROPULSION TYPE, 2024–2030 (THOUSAND UNITS)
                                   TABLE 128 NORWAY: AVAS MARKET, BY PROPULSION TYPE, 2020–2023 (USD MILLION)
                                   TABLE 129 NORWAY: AVAS MARKET, BY PROPULSION TYPE, 2024–2030 (USD MILLION)
             11.3.6 SWEDEN
                       11.3.6.1 Growing sales of battery electric vehicles to drive market
                                   TABLE 130 SWEDEN: AVAS MARKET, BY PROPULSION TYPE, 2020–2023 (THOUSAND UNITS)
                                   TABLE 131 SWEDEN: AVAS MARKET, BY PROPULSION TYPE, 2024–2030 (THOUSAND UNITS)
                                   TABLE 132 SWEDEN: AVAS MARKET, BY PROPULSION TYPE, 2020–2023 (USD MILLION)
                                   TABLE 133 SWEDEN: AVAS MARKET, BY PROPULSION TYPE, 2024–2030 (USD MILLION)
             11.3.7 DENMARK
                       11.3.7.1 Focus on tax rebates and sustainable energy production to drive market
                                   TABLE 134 DENMARK: AVAS MARKET, BY PROPULSION TYPE, 2020–2023 (THOUSAND UNITS)
                                   TABLE 135 DENMARK: AVAS MARKET, BY PROPULSION TYPE, 2024–2030 (THOUSAND UNITS)
                                   TABLE 136 DENMARK: AVAS MARKET, BY PROPULSION TYPE, 2020–2023 (USD MILLION)
                                   TABLE 137 DENMARK: AVAS MARKET, BY PROPULSION TYPE, 2024–2030 (USD MILLION)
             11.3.8 AUSTRIA
                       11.3.8.1 Fast transition to zero-emission vehicles to drive market
                                   TABLE 138 AUSTRIA: AVAS MARKET, BY PROPULSION TYPE, 2020–2023 (THOUSAND UNITS)
                                   TABLE 139 AUSTRIA: AVAS MARKET, BY PROPULSION TYPE, 2024–2030 (THOUSAND UNITS)
                                   TABLE 140 AUSTRIA: AVAS MARKET, BY PROPULSION TYPE, 2020–2023 (USD MILLION)
                                   TABLE 141 AUSTRIA: AVAS MARKET, BY PROPULSION TYPE, 2024–2030 (USD MILLION)
             11.3.9 SWITZERLAND
                       11.3.9.1 Expansion of electric vehicle charging infrastructure to drive market
                                   TABLE 142 SWITZERLAND: AVAS MARKET, BY PROPULSION TYPE, 2020–2023 (THOUSAND UNITS)
                                   TABLE 143 SWITZERLAND: AVAS MARKET, BY PROPULSION TYPE, 2024–2030 (THOUSAND UNITS)
                                   TABLE 144 SWITZERLAND: AVAS MARKET, BY PROPULSION TYPE, 2020–2023 (USD MILLION)
                                   TABLE 145 SWITZERLAND: AVAS MARKET, BY PROPULSION TYPE, 2024–2030 (USD MILLION)
               11.3.10 SPAIN
            11.3.10.1 Subsidies for faster adoption of electric vehicles to drive market
                                   TABLE 146 SPAIN: AVAS MARKET, BY PROPULSION TYPE, 2020–2023 (THOUSAND UNITS)
                                   TABLE 147 SPAIN: AVAS MARKET, BY PROPULSION TYPE, 2024–2030 (THOUSAND UNITS)
                                   TABLE 148 SPAIN: AVAS MARKET, BY PROPULSION TYPE, 2020–2023 (USD MILLION)
                                   TABLE 149 SPAIN: AVAS MARKET, BY PROPULSION TYPE, 2024–2030 (USD MILLION)
               11.3.11 UK
            11.3.11.1 Several grants for vehicles providing electric range and CO2 emissions to drive market
                                   TABLE 150 UK: AVAS MARKET, BY PROPULSION TYPE, 2020–2023 (THOUSAND UNITS)
                                   TABLE 151 UK: AVAS MARKET, BY PROPULSION TYPE, 2024–2030 (THOUSAND UNITS)
                                   TABLE 152 UK: AVAS MARKET, BY PROPULSION TYPE, 2020–2023 (USD MILLION)
                                   TABLE 153 UK: AVAS MARKET, BY PROPULSION TYPE, 2024–2030 (USD MILLION)
     11.4 NORTH AMERICA 
             11.4.1 RECESSION IMPACT ANALYSIS
                       FIGURE 61 NORTH AMERICA: AVAS MARKET SNAPSHOT
            TABLE 154 NORTH AMERICA: AVAS MARKET, BY COUNTRY, 2020–2023 (THOUSAND UNITS)
                       TABLE 155 NORTH AMERICA: AVAS MARKET, BY COUNTRY, 2024–2030 (THOUSAND UNITS)
                       TABLE 156 NORTH AMERICA: AVAS MARKET, BY COUNTRY, 2020–2023 (USD MILLION)
                       TABLE 157 NORTH AMERICA: AVAS MARKET, BY COUNTRY, 2024–2030 (USD MILLION)
             11.4.2 CANADA
                       11.4.2.1 Government regulations for mandating AVAS to drive market
                                   TABLE 158 CANADA: AVAS MARKET, BY PROPULSION TYPE, 2020–2023 (THOUSAND UNITS)
                                   TABLE 159 CANADA: AVAS MARKET, BY PROPULSION TYPE, 2024–2030 (THOUSAND UNITS)
                                   TABLE 160 CANADA: AVAS MARKET, BY PROPULSION TYPE, 2020–2023 (USD MILLION)
                                   TABLE 161 CANADA: AVAS MARKET, BY PROPULSION TYPE, 2024–2030 (USD MILLION)
                                   11.4.3 US
                       11.4.3.1 Private and public sector investments in affordable electric vehicles to drive market
                                   TABLE 162 US: AVAS MARKET, BY PROPULSION TYPE, 2020–2023 (THOUSAND UNITS)
                                   TABLE 163 US: AVAS MARKET, BY PROPULSION TYPE, 2024–2030 (THOUSAND UNITS)
                                   TABLE 164 US: AVAS MARKET, BY PROPULSION TYPE, 2020–2023 (USD MILLION)
                                   TABLE 165 US: AVAS MARKET, BY PROPULSION TYPE, 2024–2030 (USD MILLION)
 
12 COMPETITIVE LANDSCAPE (Page No. - 162)
     12.1 OVERVIEW 
     12.2 MARKET RANKING ANALYSIS 
               FIGURE 62 MARKET RANKING OF KEY PLAYERS, 2023
     12.3 REVENUE ANALYSIS 
               FIGURE 63 REVENUE ANALYSIS OF KEY PLAYERS, 2019−2023
     12.4 COMPANY VALUATION AND FINANCIAL METRICS 
               FIGURE 64 COMPANY VALUATION OF AVAS PROVIDERS, APRIL 2024
               FIGURE 65 FINANCIAL METRICS OF AVAS PROVIDERS, MARCH 2024
               12.5 BRAND/PRODUCT COMPARISON
                                   FIGURE 66 BRAND/PRODUCT COMPARISON OF TOP 5 PLAYERS
     12.6 COMPANY EVALUATION MATRIX: KEY PLAYERS, 2023 
             12.6.1 STARS
             12.6.2 EMERGING LEADERS
             12.6.3 PERVASIVE PLAYERS
             12.6.4 PARTICIPANTS
                       FIGURE 67 AVAS MARKET: COMPANY EVALUATION MATRIX, 2023
             12.6.5 COMPANY FOOTPRINT: KEY PLAYERS, 2023
                       FIGURE 68 AVAS MARKET: COMPANY FOOTPRINT, 2023
                       TABLE 166 AVAS MARKET: REGION FOOTPRINT, 2023
                       TABLE 167 AVAS MARKET: VEHICLE TYPE FOOTPRINT, 2023
     12.7 COMPANY EVALUATION MATRIX: START-UPS/SMES, 2023 
             12.7.1 PROGRESSIVE COMPANIES
             12.7.2 RESPONSIVE COMPANIES
             12.7.3 DYNAMIC COMPANIES
             12.7.4 STARTING BLOCKS
                       FIGURE 69 AVAS MARKET: START-UP/SME EVALUATION MATRIX, 2023
             12.7.5 COMPETITIVE BENCHMARKING
                       TABLE 168 KEY START-UPS/SMES
                       TABLE 169 COMPETITIVE BENCHMARKING OF KEY START-UPS/SMES
     12.8 COMPETITIVE SCENARIOS AND TRENDS 
             12.8.1 PRODUCT LAUNCHES
            TABLE 170 AVAS MARKET: PRODUCT LAUNCHES, 2020–2024
                       12.8.2 DEALS
                                   TABLE 171 AVAS MARKET: DEALS, 2020–2024
 
13 COMPANY PROFILES (Page No. - 175)
(Business overview, Products offered, Recent developments & MnM View)*
     13.1 KEY PLAYERS 
             13.1.1 CONTINENTAL AG
            TABLE 172 CONTINENTAL AG: COMPANY OVERVIEW
                                   FIGURE 70 CONTINENTAL AG: COMPANY SNAPSHOT
                                   FIGURE 71 CONTINENTAL AG: AVAS SOLUTION FOR ELECTRIC 2-WHEELERS
                                   FIGURE 72 CONTINENTAL AG: AVAS USE CASE
                                   TABLE 173 CONTINENTAL AG: PRODUCTS OFFERED
             13.1.2 HELLA GMBH & CO. KGAA
                       TABLE 174 HELLA GMBH & CO. KGAA: COMPANY OVERVIEW
                       FIGURE 73 HELLA GMBH & CO. KGAA: COMPANY SNAPSHOT
                       TABLE 175 HELLA GMBH & CO. KGAA: TECHNICAL SPECIFICATIONS OF AVAS
                       TABLE 176 HELLA GMBH & CO. KGAA: TECHNICAL DATA CONTROL AREA NETWORK (CAN) BUS INTERFACE
                       FIGURE 74 HELLA GMBH & CO. KGAA: AVAS APPLICATIONS
                       TABLE 177 HELLA GMBH & CO. KGAA: PRODUCTS OFFERED
             13.1.3 KENDRION N.V.
                       TABLE 178 KENDRION N.V.: COMPANY OVERVIEW
                       FIGURE 75 KENDRION N.V.: COMPANY SNAPSHOT
                       FIGURE 76 KENDRION N.V.: PHANTONE SOUND SYSTEM
                       FIGURE 77 KENDRION N.V.: PHANTONE ONEBOX
                       TABLE 179 KENDRION N.V.: PRODUCTS OFFERED
             13.1.4 HARMAN INTERNATIONAL
                       TABLE 180 HARMAN INTERNATIONAL: COMPANY OVERVIEW
                       TABLE 181 HARMAN INTERNATIONAL: PRODUCTS OFFERED
                       TABLE 182 HARMAN INTERNATIONAL: DEALS
             13.1.5 DENSO CORPORATION
                       TABLE 183 DENSO CORPORATION: COMPANY OVERVIEW
                       FIGURE 78 DENSO CORPORATION: COMPANY SNAPSHOT
                       FIGURE 79 DENSO CORPORATION: AVAS
                       TABLE 184 DENSO CORPORATION: PRODUCTS OFFERED
             13.1.6 THOR
                       TABLE 185 THOR: COMPANY OVERVIEW
                       FIGURE 80 HOW THOR AVAS WORKS
                       FIGURE 81 THOR AVAS COMPONENTS
                       TABLE 186 THOR: PRODUCTS OFFERED
             13.1.7 SONAVOX
                       TABLE 187 SONAVOX: COMPANY OVERVIEW
                       TABLE 188 SONAVOX: PRODUCTS OFFERED
             13.1.8 STMICROELECTRONICS
                       TABLE 189 STMICROELECTRONICS: COMPANY OVERVIEW
                       FIGURE 82 STMICROELECTRONICS: COMPANY SNAPSHOT
                       FIGURE 83 STMICROELECTRONICS: AVAS
                       FIGURE 84 STMICROELECTRONICS: AVAS BLOCK DIAGRAM
                       FIGURE 85 STMICROELECTRONICS: AVAS SOLUTION
                       TABLE 190 STMICROELECTRONICS: INTEGRATED STEREO AVAS SOLUTION
                       TABLE 191 STMICROELECTRONICS: PRODUCTS OFFERED
                       TABLE 192 STMICROELECTRONICS: PRODUCT LAUNCHES
             13.1.9 TEXAS INSTRUMENTS INCORPORATED
                       TABLE 193 TEXAS INSTRUMENTS INCORPORATED: COMPANY OVERVIEW
                       FIGURE 86 TEXAS INSTRUMENTS INCORPORATED: COMPANY SNAPSHOT
                       FIGURE 87 TEXAS INSTRUMENTS INCORPORATED: AVAS BLOCK DIAGRAM
                       TABLE 194 TEXAS INSTRUMENTS INCORPORATED: PRODUCTS OFFERED
               13.1.10 BESTAR TECHNOLOGIES INC.
                                   TABLE 195 BESTAR TECHNOLOGIES INC.: COMPANY OVERVIEW
                                   FIGURE 88 BESTAR TECHNOLOGIES INC.: AVAS
                                   TABLE 196 BESTAR TECHNOLOGIES INC.: PRODUCTS OFFERED
               13.1.11 BRIGADE ELECTRONICS GROUP PLC
                                   TABLE 197 BRIGADE ELECTRONICS GROUP PLC: COMPANY OVERVIEW
                                   FIGURE 89 BRIGADE ELECTRONICS GROUP PLC: AVAS
                                   TABLE 198 BRIGADE ELECTRONICS GROUP PLC: PRODUCTS OFFERED
               13.1.12 ARDENT LIMITED
                                   TABLE 199 ARDENT LIMITED: COMPANY OVERVIEW
                                   TABLE 200 ARDENT LIMITED: AVAS BENEFITS
                                   FIGURE 90 ARDENT LIMITED: AVAS LAYOUT
                                   TABLE 201 ARDENT LIMITED: PRODUCTS OFFERED
*Details on Business overview, Products offered, Recent developments & MnM View might not be captured in case of unlisted companies.
     13.2 OTHER PLAYERS 
             13.2.1 NOVOSIM
             13.2.2 SOUNDRACER
             13.2.3 TIANJIN BODUN ELECTRONICS CO., LTD
             13.2.4 UNO MINDA
             13.2.5 ROBERT BOSCH GMBH
             13.2.6 CRISPAUDIO
             13.2.7 ANALOG DEVICES, INC.
             13.2.8 SIEMENS
             13.2.9 MICROCHIP TECHNOLOGY INC.
             13.2.10 SEGER
             13.2.11 NISSHINBO MICRO DEVICES INC.
             13.2.12 EDAG GROUP
             13.2.13 MÜLLER-BBM VIBROAKUSTIK SYSTEME GMBH
             13.2.14 HL KLEMOVE
             13.2.15 TVS SENSING SOLUTIONS
             13.2.16 ERA ELEKTRONIK A.S.
 
14 RECOMMENDATIONS BY MARKETSANDMARKETS (Page No. - 223)
     14.1 ASIA PACIFIC TO BE LARGEST AVAS MARKET DURING FORECAST PERIOD 
     14.2 ELECTRIC 2-WHEELERS TO INCREASE DEMAND FOR AVAS 
     14.3 SOUND CUSTOMIZATION AS EMERGING TREND 
     14.4 CONCLUSION 
 
15 APPENDIX (Page No. - 225)
     15.1 KEY INSIGHTS FROM INDUSTRY EXPERTS 
     15.2 DISCUSSION GUIDE 
     15.3 KNOWLEDGESTORE: MARKETSANDMARKETS’ SUBSCRIPTION PORTAL 
     15.4 CUSTOMIZATION OPTIONS 
             15.4.1 AVAS MARKET, BY ELECTRIC 2-WHEELER, AT COUNTRY LEVEL
             15.4.2 AVAS MARKET, BY VEHICLE TYPE, AT COUNTRY LEVEL
             15.4.3 PROFILING OF ADDITIONAL MARKET PLAYERS (UP TO 3)
     15.5 RELATED REPORTS 
     15.6 AUTHOR DETAILS 

The study involved four major activities in estimating the current size of the AVAS market. Exhaustive secondary research was done to collect information on the market, the peer market, and the child markets. The next step was to validate these findings, assumptions, and sizing with the industry experts across value chains through primary research. The top-down and bottom-up approaches were employed to estimate the complete market size. Thereafter, market breakdown and data triangulation processes were used to estimate the market size of segments and subsegments.

Secondary Research

In the secondary research process, various secondary sources such as company annual reports/presentations, press releases, industry association publications [for example, International Organization of Motor Vehicle Manufacturers (OICA), National Highway Traffic Safety Administration (NHTSA), International Energy Association (IEA)], articles, directories, technical handbooks, trade websites, technical articles, and databases (for example, Marklines, and Factiva) have been used to identify and collect information useful for an extensive commercial study of the global AVAS market.

Primary Research

Extensive primary research was conducted after acquiring an understanding of the AVAS market scenario through secondary research. Several primary interviews were conducted with market experts from both the demand (automotive OEMs) and supply (AVAS providers) sides across major regions, namely, North America, Europe, and Asia Pacific. Approximately 23% and 77% of primary interviews were conducted from the demand and supply sides, respectively. Primary data was collected through questionnaires, emails, and telephonic interviews.

In the canvassing of primaries, various departments within organizations, such as sales, operations, and marketing, were covered to provide a holistic viewpoint in the report. After interacting with industry experts, brief sessions were also conducted with highly experienced independent consultants to reinforce the findings from primaries. This, along with the in-house subject matter experts’ opinions, led to the findings described in the remainder of this report.

AVAS Market Size, and Share

To know about the assumptions considered for the study, download the pdf brochure

Market Size Estimation

The bottom-up approach was used to estimate and validate the size of the AVAS market. This method was also used extensively to estimate the size of various subsegments in the market. The research methodology used to estimate the market size includes the following:

  • The key players in the industry and markets have been identified through extensive secondary research.
  • The industry’s supply chain and market size, in terms of volume, have been determined through primary and secondary research processes.

All percentage shares, splits, and breakdowns have been determined using secondary sources and verified through primary sources.

AVAS Market Bottom Up Approach

To know about the assumptions considered for the study, Request for Free Sample Report

Market Size Validation

The top-down approach has been used to estimate and validate the size of the AVAS market by mounting position type in terms of volume and value. The top-down approach has been used to estimate and validate the size of the market. In this approach, the global market is bifurcated into mounting position type based on the penetration of each mounting position, which will give the volume of the market by mounting position at the regional level. Further, multiplying the volume by ASP results in the market for mounting position type by value.

AVAS Market Top Down Approach

Data Triangulation

After arriving at the overall market size—using the market size estimation processes as explained above—the market was split into several segments and subsegments. To complete the overall market engineering process and arrive at the exact statistics of each market segment and subsegment, data triangulation, and market breakdown procedures were employed, wherever applicable. The data was triangulated by studying various factors and trends from both the demand and supply sides.

Market Definition

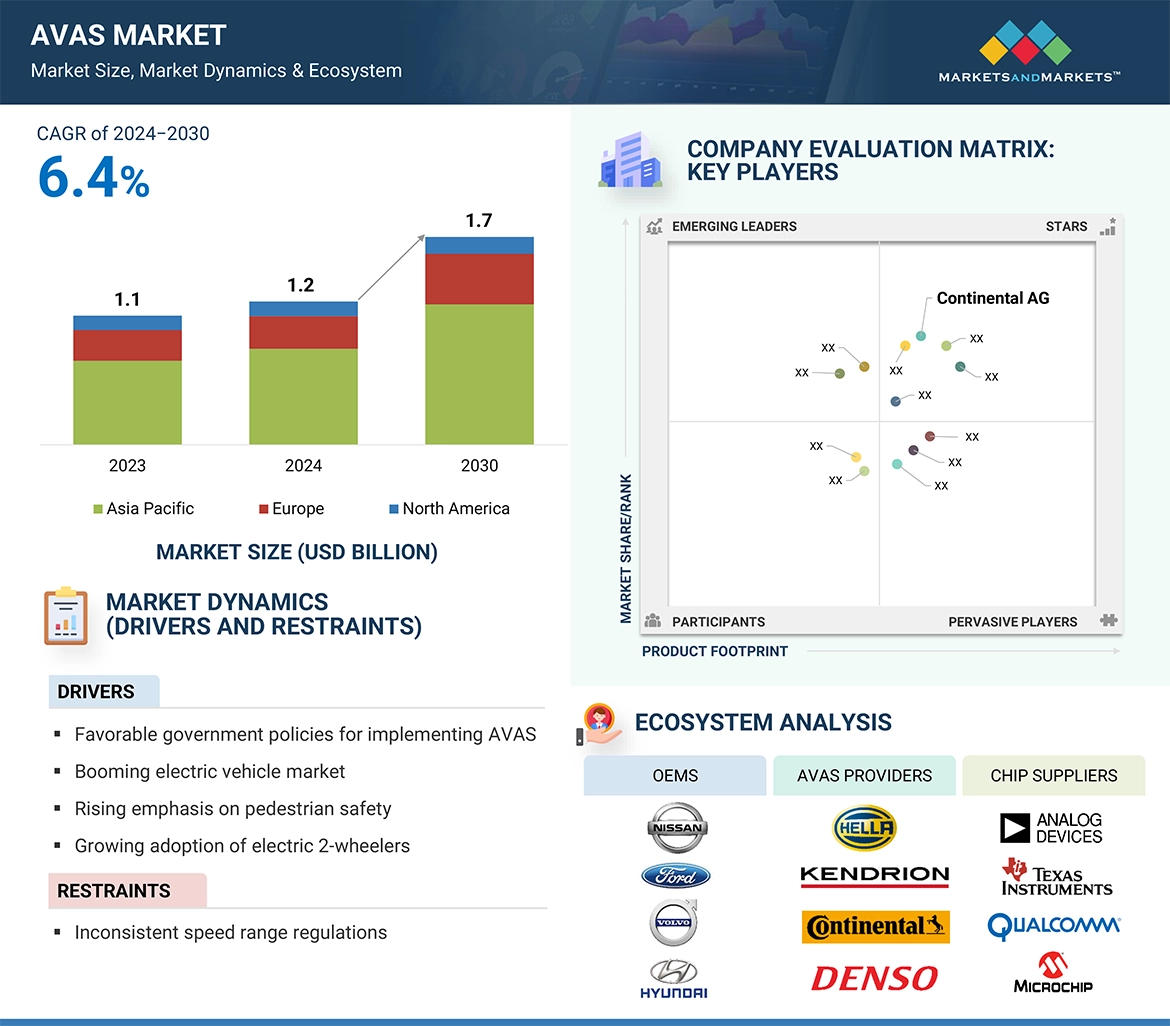
An AVAS is a sound emitting device assembled in pure electric vehicles and hybrid electric vehicles that produce a lower level sound than traditional ICE vehicles—whenever the vehicle is operating at a low speed—to warn pedestrians and other vulnerable road commuters about the vehicle's presence. Also, the sound rises and drops in pitch to signal whether the vehicle is accelerating or decelerating, respectively.

List of Key Stakeholders

  • Acoustic consultants
  • Associations, forums, and alliances related to electric vehicles
  • Automobile manufacturers
  • Automotive sensor manufacturers
  • Automotive software providers
  • Autonomous vehicle manufacturers
  • AVAS manufacturers
  • EV component manufacturers
  • EV distributors and retailers
  • EV manufacturers
  • Government agencies and policy makers

Report Objectives

  • To analyze and forecast the acoustic vehicle alerting system (AVAS) market in terms of value (USD million) and volume (thousand units) from 2024 to 2030
  • To segment the market by vehicle type, mounting position, propulsion type, sales channel, electric 2-wheeler, and region
    • To segment and forecast the market size by value and volume based on vehicle type (passenger car and commercial vehicle)
    • To segment and forecast the market size by value and volume based on mounting position (separated and integrated)
    • To segment and forecast the market size by value and volume based on propulsion type {battery electric vehicle (BEV), plug-in hybrid electric vehicle (PHEV), and fuel cell electric vehicle (FCEV)}
    • To segment and forecast the market size by value and volume based on sales channel (OEM and aftermarket)
    • To segment and forecast the market size by value and volume based on electric 2-wheeler (E-scooter/E-moped and E-motorcycle)
    • To segment and forecast the market by value and volume based on region (Asia Pacific, Europe, and North America)
  • To provide detailed information about the factors influencing the market growth (drivers, challenges, restraints, and opportunities)
  • To strategically analyze the market with respect to individual growth trends, prospects, and contributions to the total market
  • To study the following with respect to the market
    • Value Chain Analysis
    • Ecosystem Analysis
    • Technology Analysis
    • Case Study Analysis
    • Patent Analysis
    • Tariff and Regulatory Landscape
    • Average Selling Price Analysis
    • Key stakeholders and Buying Criteria
  • To strategically profile the key players and comprehensively analyze their market share and core competencies
    • To analyze the opportunities for stakeholders and the competitive landscape for market leaders
  • To track and analyze competitive developments such as deals, product launches/developments, expansions, and other activities undertaken by the key industry participants

Available Customizations

With the given market data, MarketsandMarkets offers customizations in accordance with the company’s specific needs.

  • AVAS market, by electric 2-wheeler, at country level
  • AVAS market, by propulsion type, at country level
  • Profiling of additional market players (up to 3)
Custom Market Research Services

We will customize the research for you, in case the report listed above does not meet with your exact requirements. Our custom research will comprehensively cover the business information you require to help you arrive at strategic and profitable business decisions.

Request Customization
Report Code
AT 7301
Published ON
Jun, 2024
Choose License Type
BUY NOW
  • SHARE
X
Request Customization
Speak to Analyst
Speak to Analyst
OR FACE-TO-FACE MEETING
PERSONALIZE THIS RESEARCH
  • Triangulate with your Own Data
  • Get Data as per your Format and Definition
  • Gain a Deeper Dive on a Specific Application, Geography, Customer or Competitor
  • Any level of Personalization
REQUEST A FREE CUSTOMIZATION
LET US HELP YOU!
  • What are the Known and Unknown Adjacencies Impacting the AVAS Market
  • What will your New Revenue Sources be?
  • Who will be your Top Customer; what will make them switch?
  • Defend your Market Share or Win Competitors
  • Get a Scorecard for Target Partners
CUSTOMIZED WORKSHOP REQUEST
  • Call Us
  • +1-888-600-6441 (Corporate office hours)
  • +1-888-600-6441 (US/Can toll free)
  • +44-800-368-9399 (UK office hours)
CONNECT WITH US
ABOUT TRUST ONLINE
©2024 MarketsandMarkets Research Private Ltd. All rights reserved
DMCA.com Protection Status Website Feedback