Fake Image Detection Market

Fake Image Detection Market by Offering (Solutions and Services), Target User, Technology, Application, Deployment Mode (On-premises and Cloud), Organization Size (Large Enterprises and SMEs), Vertical and Region - Global Forecast to 2029

Report Code: TC 8983 Apr, 2024, by marketsandmarkets.com

[296 Pages Report] The Fake Image Detection Market size is projected to grow from USD 0.6 billion in 2024 to USD 3.9 billion by 2029 at a Compound Annual Growth Rate (CAGR) of 41.6% during the forecast period. Adoption of fake image detection solutions is imperative to maintain competitive advantage and market differentiation. In an increasingly crowded digital landscape, organizations recognize the importance of offering users a secure and reliable experience. By proactively implementing fake image detection technologies, companies can distinguish themselves as leaders in combating misinformation, attracting users who prioritize authenticity and trustworthiness. This strategic move not only safeguards their brand reputation but also positions them as industry pioneers, driving customer loyalty and market share growth.

Fake Image Detection Market

To know about the assumptions considered for the study, Request for Free Sample Report

Fake Image Detection Market Opportunities

To know about the assumptions considered for the study, download the pdf brochure

Fake Image Detection Market Dynamics

Driver: Advancements in AI and ML

Advancements in AI and Machine Learning (ML) play a pivotal role in fake image detection, offering sophisticated tools and techniques to combat the increasing sophistication of image manipulation. Deep learning, a subset of machine learning, has emerged as a compelling approach. Convolutional Neural Networks (CNNs) have proven effective in image analysis tasks, enabling the identification of complex patterns and subtle anomalies within images. These neural networks can be trained on extensive datasets, learning to recognize authentic and manipulated features. Transfer learning is another crucial aspect of AI and ML advancements in fake image detection. With transfer learning, models pre-trained on large datasets for general image recognition tasks can be fine-tuned to identify manipulated or synthetic images. This approach leverages the knowledge gained from diverse datasets, allowing the models to adapt and generalize effectively to new challenges in the evolving landscape of image manipulation.

Furthermore, AI and ML enable the development of ensemble models that combine multiple algorithms to enhance overall detection accuracy. These ensemble models can integrate various techniques, such as feature-based Analysis, statistical methods, and behavioral pattern recognition, creating a more comprehensive and robust approach to identifying fake images. Explainability and interpretability are also essential considerations in the context of AI and ML advancements. Understanding how a model arrives at its decisions is crucial as the stakes are high in detecting fake images. Ongoing research focuses on making AI and ML models more explainable, transparent, and accountable, ensuring stakeholders can trust and comprehend the results of these advanced detection systems. In essence, the continuous progress in AI and ML empowers the development of sophisticated, adaptable, and accurate fake image detection systems. These technologies keep pace with evolving manipulation techniques and offer the potential for more nuanced and practical solutions in the ongoing battle against misinformation and deceptive images.

Restraint: Evolving techniques of image manipulation

The constant evolution of image manipulation techniques presents a challenge in detecting fake images. As technology advances, so do the sophistication and variety of methods employed to manipulate visuals. Adversarial attacks emerge as a significant obstacle in the pursuit of accurate detection. In these attacks, manipulations are strategically crafted to deceive detection algorithms, exploiting vulnerabilities and weaknesses in existing systems. The dynamic and adaptive nature of these adversarial techniques makes it difficult for traditional detection methods to keep pace, necessitating continuous innovation in fake image detection technologies to effectively counter the ever-evolving landscape of image manipulation.

Opportunity: Advancements in camera technology embedding digital signatures in images

Camera manufacturers are increasing their efforts to guarantee the authenticity and integrity of visual content. It is in response to the global upsurge in fraudulent photos produced by AI or altered by humans. Leading manufacturers of cameras, including Nikon, Sony, and Canon, are incorporating digital signatures into pictures and movies so that a web-based service called Verify can validate them. Digital signatures are encryption that appends a unique code to an image, bearing details like the date, time, place, and photographer. This code is unchangeable and can be found using a verification tool like Verify. A coalition of international news outlets, tech firms, and camera manufacturers introduced this free service. These are crucial because they can assist in differentiating between authentic and fraudulent photos and films, which could harm society, politics, commerce, and journalism. Deepfakes of Japanese Prime Minister Fumio Kishida and former US President Donald Trump, for instance, became popular this year, casting doubt on the reliability and validity of visual content. These can also aid in defending the reputation and legal rights of photographers and other content producers, protecting against moral or legal problems if their pictures or movies are exploited without permission.

In 2024, Nikon intends to provide mirrorless cameras with authentication technology for professionals such as photojournalists. There will be an automatic feature in the cameras that adds them to photos.

Sony plans to integrate these technologies into three professional-grade mirrorless SLR cameras through a firmware update by the spring of 2024. The IT company also aims to integrate the technology with video. Sony's authentication servers will detect digital signatures and the presence of artificial intelligence (AI) in photos. In October, Sony and The Associated Press field tested this gadget.

Also, Canon plans to offer a camera with comparable functionality as early as 2024. The business is also working on technology that enables digital signatures to be added to videos. In 2019, Stanford University and the University of Southern California co-founded the Starling Lab for Data Integrity, with which Thomson Reuters and Canon have joined to form a project team. Additionally, Canon is releasing an image management application to tell whether humans take images.

Challenge: Privacy Concerns

The challenge of privacy concerns in fake image detection revolves around the potential infringement on individuals' privacy rights as detection technologies become more advanced. As fake image detection systems analyze and scrutinize images to identify manipulated content, there is a risk that legitimate, non-manipulated images containing sensitive or private information may also be subjected to scrutiny. This raises concerns about the unintentional exposure of personal details, potentially compromising the privacy of individuals. In detecting fake images, the technologies used may involve intricate analyses of facial features, body attributes, or other identifying elements. This scrutiny, even if automated and aimed at detecting manipulations, could inadvertently intrude upon the privacy of individuals captured in the images. Striking a balance between effective fake image detection and respecting privacy rights becomes a delicate challenge, as false positives or unintended consequences could result in unwarranted exposure or data mishandling. Moreover, as fake image detection systems often require access to diverse datasets for training, concerns arise about the privacy of individuals contributing to these datasets. Ensuring the ethical collection and usage of data becomes essential to prevent potential misuse and safeguard the privacy of those individuals' images as part of the training process.

Addressing privacy concerns in the context of fake image detection necessitates the development of robust ethical frameworks, transparent policies, and secure practices. Striving for a balance between effective detection and privacy protection is crucial to fostering public trust and ensuring that such technologies' deployment aligns with ethical standards and legal considerations. This challenge underscores the importance of advancing detection methods while being mindful of the potential impact on individual privacy.

Fake Image Detection Market Ecosystem

Top Companies in Fake Image Detection Market

By end user, Government is expected to grow at the highest CAGR during the forecast period.

Government sector is increasingly adopting fake image detection technologies to combat the proliferation of misinformation and disinformation. In an era where the spread of false information can have profound societal and political consequences, governments recognize the urgent need to safeguard public trust and democratic integrity. By deploying advanced image analysis algorithms, authorities can swiftly identify, and flag manipulated or fabricated images circulated on social media platforms, news outlets, and other online channels. This proactive approach not only helps in mitigating the potential damage caused by fake images but also serves as a deterrent against malicious actors seeking to exploit public sentiment for immoral purposes. Moreover, by promoting transparency and authenticity in digital content, governments can foster a more informed and resilient citizenry, crucial for upholding democratic principles in the digital age.

By organization size, the SMEs segment is expected to grow at the highest CAGR during the forecast period.

The adoption of fake image detection technology among small and medium-sized enterprises (SMEs) is experiencing high growth as there is increasing awareness of the dangers posed by manipulated images. SMEs are increasingly recognizing the importance of safeguarding their online presence against the proliferation of fake images. With the availability of user-friendly and cost-effective fake image detection tools, SMEs are efficiently detecting and mitigating the risks associated with manipulated images across their digital platforms. By investing in these technologies, SMEs are securing their credibility, protecting their brand reputation, and instill trust among customers and stakeholders. The cloud deployment mode provides a feasible solution for the adoption of technology. In the coming years, it is expected that the low cost of fake image detection solutions will help SMEs around the world deploy the solution.

By region, North America accounts for the highest market size during the forecast period.

North America is projected to lead the fake image detection market during the forecast period. The presence of economically and technologically advanced countries such as the US and Canada, the adoption of new and emerging technologies, and the strong financial position of market players are some of the major factors that help organizations in North America have a competitive edge over others. 

The fake image detection market in North America is experiencing significant growth and is expected to continue expanding during the forecast period. The US and Canada are expected to be major contributors to the North American market. With the increase in the use of AI and ML processes, there is a sudden increase in the advancements in fake image detection technology in the region. The US consists of major AI-based fake image detection companies and SMEs such as Microsoft, Clearview AI, and Iproov due to which there is increased fake image detection solution adoption in the country. As a result, many companies move towards the US market to develop AI capabilities. At present, North America generates the highest revenue in the fake image detection market and is expected to dominate the market for the next five years.

North American Fake Image Detection Market Size, and Share

Key Market Pleyers

The key players in the fake image detection market are iProov (UK),  Q-integrity (Switzerland), iDenfy (Lithuania), Truepic (US), Reality Defender (US),  Microsoft Corporation (US), Gradiant (Spian), Primeau Forensics, Sentinel AI (Estonia), Sensity AI (Netherlands), BioID (Germany), and Kairos (US).

Get online access to the report on the World's First Market Intelligence Cloud

  • Easy to Download Historical Data & Forecast Numbers
  • Company Analysis Dashboard for high growth potential opportunities
  • Research Analyst Access for customization & queries
  • Competitor Analysis with Interactive dashboard
  • Latest News, Updates & Trend analysis
Request Sample

Scope of the Report

Report Metrics

Details

Market size available for years

2018-2029

Base year considered

2023

Forecast period

2024–2029

Forecast units

Value (USD Million/USD Billion) 

Segments Covered

Offering, Technology, Application, Target User, Deployment Mode, Organization Size, Vertical, and Region.

Geographies covered

North America, Europe, Asia pacific, Middle east & Africa and Latin America

Companies covered

Major vendors in the fake image detection market include Microsoft Corporation (US), Gradient (Spain), Facia (UK), Image Forgery Detector (Belgium), Q-integrity (Switzerland), iDenfy (Lithuania), DuckDuckGoose AI (Netherlands), Primeau Forensics, Sentinel AI (Estonia), iProov (UK), Sensity AI (Netherlands), Truepic (US), BioID (Germany), Reality Defender (US), Clearview AI (US), and Kairos (US).

The study categorizes the fake image detection market into Offering, Technology, Application, Target User, Deployment Mode, Organization Size, Vertical, and Region.

By Offering:
  • Solutions
    • Photoshopped Image Detection
    • Deepfake Image detection
    • AI-generated Content Detection
    • Content Authenticity Verification
    • Real-time Detection
    • Browser Extensions
    • Mobile Apps
  • Services
    • Consulting
    • Deployment and Integration
    • Support and Maintenance
By Target User:
  • Individual
  • Professional
  • Enterprise Grade
By Technology:
  • ML and DL
    • CNNS
    • GANs
  • Image Forensics
    • Error Level Analysis
    • Metadata Analysis
By Deployment Mode:
  • On-Premises
  • Cloud
By Organization Size:
  • Large Enterprises
  • Small and Medium Enterprises (SMEs)
By Application:
  • Social media and content moderation
  • Digital forensics
  • Fraud Detection
  • Healthcare and medical imaging
  • Recruitment
By Vertical:
  • Government
  • Banking, Financial Services and Insurance (BFSI)
  • Healthcare
  • Telecom
  • Real Estate
  • Media & Entertainment
  • Other Verticals
By Region:
  • North America
    • US
    • Canada
  • Europe
    • UK
    • Germany
    • France
    • Italy
    • Rest of Europe
  • Asia Pacific
    • China
    • Japan
    • India
    • Rest of Asia Pacific
  • Middle East and Africa
    • Middle East
    • Africa
  • Latin America
    • Brazil
    • Mexico
    • Rest of Latin America

Recent Developments

  • In March 2024, BioID released a new version of its deepfake detection software to secure biometric authentication and digital identity verification against manipulated images and videos. The software prevents identity spoofing by detecting deepfakes and content generated or manipulated by AI, with real-time analysis and feedback on both photos and videos.
  • In June 2023, iDenfy, recently partnered with LeakIX, a cybersecurity platform analyzing Internet data to aid organizations in risk mitigation. Integrating iDenfy’s ID verification solution, LeakIX aims to bolster payment fraud detection and thwart the creation of fake accounts.
  • In August 2022, Microsoft launched a Video Authenticator software that detects deepfake photos and videos. The application gives a confidence score sorts to help users identify whether the media is artificially manipulated.

Frequently Asked Questions (FAQ):

To speak to our analyst for a discussion on the above findings, click Speak to Analyst

TABLE OF CONTENTS
 
1 INTRODUCTION (Page No. - 50)
    1.1 STUDY OBJECTIVES 
    1.2 MARKET DEFINITION 
           1.2.1 INCLUSIONS AND EXCLUSIONS
    1.3 MARKET SCOPE 
           1.3.1 MARKET SEGMENTATION
           1.3.2 REGIONS COVERED
    1.4 YEARS CONSIDERED 
    1.5 CURRENCY CONSIDERED 
           TABLE 1 USD EXCHANGE RATES, 2018–2023
    1.6 STAKEHOLDERS 
 
2 RESEARCH METHODOLOGY (Page No. - 56)
    2.1 RESEARCH DATA 
           FIGURE 1 FAKE IMAGE DETECTION MARKET: RESEARCH DESIGN
           2.1.1 SECONDARY DATA
           2.1.2 PRIMARY DATA
                    2.1.2.1 Breakup of primaries
                    2.1.2.2 Key industry insights
    2.2 DATA TRIANGULATION 
           FIGURE 2 MARKET: DATA TRIANGULATION
           FIGURE 3 MARKET ESTIMATION: RESEARCH FLOW
    2.3 MARKET SIZE ESTIMATION 
           2.3.1 TOP-DOWN APPROACH
                    FIGURE 4 APPROACH 1 (SUPPLY SIDE): REVENUE FROM SOLUTIONS AND SERVICES OF FAKE IMAGE DETECTION VENDORS
                    FIGURE 5 APPROACH 1: SUPPLY-SIDE ANALYSIS
           2.3.2 BOTTOM-UP APPROACH
                    FIGURE 6 APPROACH 2 - BOTTOM-UP (DEMAND SIDE): FAKE IMAGE DETECTION
    2.4 MARKET FORECAST 
           TABLE 2 FACTOR ANALYSIS
    2.5 COMPANY EVALUATION METHODOLOGY 
           2.5.1 FOR STARTUPS
                    FIGURE 7 COMPANY EVALUATION (STARTUPS): CRITERIA WEIGHTAGE
    2.6 ASSUMPTIONS 
           TABLE 3 MARKET: ASSUMPTIONS
    2.7 LIMITATIONS 
           TABLE 4 MARKET: LIMITATIONS
 
3 EXECUTIVE SUMMARY (Page No. - 67)
    FIGURE 8 GLOBAL MARKET TO WITNESS SIGNIFICANT GROWTH DURING FORECAST PERIOD 
    FIGURE 9 MARKET: SNAPSHOT OF SEGMENTS 
    FIGURE 10 MARKET: REGIONAL SNAPSHOT 
 
4 PREMIUM INSIGHTS (Page No. - 71)
    4.1 ATTRACTIVE OPPORTUNITIES FOR FAKE IMAGE DETECTION MARKET PLAYERS 
           FIGURE 11 ADVANCEMENTS IN AI & ML TECHNOLOGIES AND INCREASING USE CASES AND APPLICATIONS OF FAKE IMAGE DETECTION ACROSS SECTORS TO BOOST MARKET GROWTH
    4.2 MARKET, BY OFFERING 
           FIGURE 12 SOLUTIONS TO HOLD LARGER MARKET SIZE DURING FORECAST PERIOD
    4.3 MARKET, BY TARGET USER 
           FIGURE 13 PROFESSIONAL SEGMENT TO BE MOST PREFERRED DURING FORECAST PERIOD
    4.4 MARKET, BY TECHNOLOGY 
           FIGURE 14 MACHINE AND DEEP LEARNING TO HOLD LARGER MARKET SIZE DURING FORECAST PERIOD
    4.5 MARKET, BY APPLICATION 
           FIGURE 15 SOCIAL MEDIA AND CONTENT MODERATION APPLICATION TO BE PREFERRED DURING FORECAST PERIOD
    4.6 MARKET, BY DEPLOYMENT MODE 
           FIGURE 16 ON-PREMISES SEGMENT TO HOLD LARGER MARKET SIZE DURING FORECAST PERIOD
    4.7 MARKET, BY ORGANIZATION SIZE 
           FIGURE 17 LARGE ENTERPRISES TO HOLD LARGER MARKET SIZE DURING FORECAST PERIOD
    4.8 MARKET, BY VERTICAL 
           FIGURE 18 GOVERNMENT VERTICAL TO BE DOMINANT DURING FORECAST PERIOD
    4.9 MARKET INVESTMENT SCENARIO 
           FIGURE 19 EUROPE TO EMERGE AS BEST MARKET FOR INVESTMENTS IN NEXT FIVE YEARS
 
5 MARKET OVERVIEW AND INDUSTRY TRENDS (Page No. - 76)
    5.1 INTRODUCTION 
    5.2 MARKET DYNAMICS 
           FIGURE 20 FAKE IMAGE DETECTION MARKET: DRIVERS, RESTRAINTS, OPPORTUNITIES, AND CHALLENGES
           5.2.1 DRIVERS
                    5.2.1.1 Advancements in AI and ML
                    5.2.1.2 Increasing deepfakes posing threat to digital identity
                               FIGURE 21 ADOPTION OF FAKE IMAGE DETECTION SOLUTIONS WORLDWIDE
                    5.2.1.3 Rapid spread of misinformation
           5.2.2 RESTRAINTS
                    5.2.2.1 Evolving techniques of image manipulation
                    5.2.2.2 Volume and diversity of image data
           5.2.3 OPPORTUNITIES
                    5.2.3.1 Advancements in camera technology embedding digital signatures in images
                    5.2.3.2 Increase in demand for big data analytics
           5.2.4 CHALLENGES
                    5.2.4.1 Lack of awareness of deepfakes
                               FIGURE 22 AWARENESS OF DEEPFAKE IMAGES WORLDWIDE
                    5.2.4.2 Privacy concerns
    5.3 FAKE IMAGE DETECTION TECHNOLOGY EVOLUTION 
           FIGURE 23 MARKET: EVOLUTION
           5.3.1 DIGITAL ERA AND PHOTOSHOP (1980S)
           5.3.2 IMAGE FORENSICS EMERGES (1990S)
           5.3.3 SENSOR PATTERN NOISE ANALYSIS (2008)
           5.3.4 CONTENT-BASED IMAGE FORGERY DETECTION (2010S)
           5.3.5 DEEP LEARNING AND NEURAL NETWORKS (2010S)
           5.3.6 BLOCKCHAIN FOR IMAGE AUTHENTICATION (2010S)
           5.3.7 GANS AND DEEPFAKE CHALLENGES (2010S)
           5.3.8 ADVANCEMENTS IN DEEPFAKE DETECTION (2020S)
           5.3.9 INTEGRATION IN SOCIAL MEDIA PLATFORMS (PRESENT)
    5.4 CASE STUDY ANALYSIS 
           5.4.1 IPROYAL REDUCED TIME TO VERIFY NEW USERS WHILE BUILDING CUSTOM-TAILORED KYC ONBOARDING FLOW
           5.4.2 MICROBLINK LEVERAGED LIVENESS DETECTION FOR QUICK, EASY, AND SECURE ID VERIFICATION
           5.4.3 PAYPAY STREAMLINED DIGITAL ONBOARDING WITH ENHANCED ID VERIFICATION
    5.5 VALUE CHAIN ANALYSIS 
           FIGURE 24 FAKE IMAGE DETECTION MARKET: VALUE CHAIN ANALYSIS
           5.5.1 PLANNING AND DESIGNING
           5.5.2 FAKE IMAGE DETECTION SOFTWARE PROVIDERS
           5.5.3 SYSTEM INTEGRATORS
           5.5.4 DISTRIBUTION
           5.5.5 END USERS
    5.6 ECOSYSTEM ANALYSIS 
           FIGURE 25 MARKET: ECOSYSTEM
           TABLE 5 MARKET: ECOSYSTEM
    5.7 PORTER'S FIVE FORCES ANALYSIS 
           TABLE 6 PORTER'S FIVE FORCES IMPACT ON MARKET
           FIGURE 26 MARKET: PORTER'S FIVE FORCES ANALYSIS
           5.7.1 THREAT OF NEW ENTRANTS
           5.7.2 BARGAINING POWER OF SUPPLIERS
           5.7.3 BARGAINING POWER OF BUYERS
           5.7.4 THREAT OF SUBSTITUTES
           5.7.5 INTENSITY OF COMPETITIVE RIVALRY
    5.8 PRICING ANALYSIS 
           5.8.1 AVERAGE SELLING PRICE TREND OF KEY PLAYERS, BY OFFERING
                    FIGURE 27 AVERAGE SELLING PRICES OF KEY PLAYERS FOR TOP THREE OFFERINGS
                    TABLE 7 AVERAGE SELLING PRICES OF KEY PLAYERS FOR THE TOP THREE OFFERINGS
           5.8.2 INDICATIVE PRICING ANALYSIS
                    5.8.2.1 Indicative pricing analysis of fake image detection solutions
                               TABLE 8 INDICATIVE PRICING LEVELS OF FAKE IMAGE DETECTION SOLUTIONS
    5.9 TECHNOLOGY ANALYSIS 
           5.9.1 KEY TECHNOLOGIES
                    5.9.1.1 Deep Learning and Neural Networks
                    5.9.1.2 Convolutional Neural Networks (CNNs)
                    5.9.1.3 Generative Adversarial Networks (GANs)
                    5.9.1.4 Blockchain
           5.9.2 COMPLEMENTARY TECHNOLOGIES
                    5.9.2.1 Computer Vision
                    5.9.2.2 Multimodal Analysis
           5.9.3 ADJACENT TECHNOLOGIES
                    5.9.3.1 Artificial Intelligence (AI)
                    5.9.3.2 Machine Learning (ML)
    5.10 PATENT ANALYSIS 
           5.10.1 FAKE IMAGE DETECTION MARKET
                    FIGURE 28 LIST OF MAJOR PATENTS FOR FAKE IMAGE DETECTION
                    FIGURE 29 REGIONAL ANALYSIS OF PATENTS GRANTED FOR MARKET
                    TABLE 9 LIST OF MAJOR PATENTS
    5.11 TRENDS/DISRUPTIONS IMPACTING CUSTOMERS’ BUSINESSES 
                    FIGURE 30 MARKET: TRENDS/DISRUPTIONS IMPACTING CUSTOMERS’ BUSINESSES
    5.12 TECHNOLOGY ROADMAP 
           5.12.1 FAKE IMAGE DETECTION TECHNOLOGY ROADMAP TILL 2030
                    5.12.1.1 Short-term roadmap (2023–2025)
                    5.12.1.2 Mid-term roadmap (2026–2028)
                    5.12.1.3 Long-term roadmap (2029–2030)
    5.13 BEST PRACTICES IN FAKE IMAGE DETECTION MARKET 
           5.13.1 METADATA ANALYSIS
           5.13.2 REVERSE IMAGE SEARCH
           5.13.3 IMAGE FORENSICS TOOLS
           5.13.4 BLUR AND NOISE ANALYSIS
           5.13.5 WATERMARK ANALYSIS
           5.13.6 CONTEXTUAL ANALYSIS
           5.13.7 FACE AND FACIAL EXPRESSION ANALYSIS
           5.13.8 MACHINE LEARNING MODELS
           5.13.9 BLOCKCHAIN AND DIGITAL SIGNATURES
                    5.13.10 HUMAN EXPERTISE
                    5.13.11 MULTI-MODAL APPROACHES
                    5.13.12 EDUCATE USERS
    5.14 REGULATORY LANDSCAPE 
           5.14.1 REGULATORY BODIES, GOVERNMENT AGENCIES, AND OTHER ORGANIZATIONS
                    TABLE 10 NORTH AMERICA: LIST OF REGULATORY BODIES, GOVERNMENT AGENCIES, AND OTHER ORGANIZATIONS
                    TABLE 11 EUROPE: LIST OF REGULATORY BODIES, GOVERNMENT AGENCIES, AND OTHER ORGANIZATIONS
                    TABLE 12 ASIA PACIFIC: LIST OF REGULATORY BODIES, GOVERNMENT AGENCIES, AND OTHER ORGANIZATIONS
                    TABLE 13 REST OF THE WORLD: LIST OF REGULATORY BODIES, GOVERNMENT AGENCIES, AND OTHER ORGANIZATIONS
                    5.14.1.1 North America
                               5.14.1.1.1 US
                    5.14.1.2 Europe
                    5.14.1.3 Asia Pacific
                               5.14.1.3.1 India
                               5.14.1.3.2 China
                    5.14.1.4 Middle East & Africa
                               5.14.1.4.1 UAE
                    5.14.1.5 Latin America
                               5.14.1.5.1 Brazil
                               5.14.1.5.2 Mexico
    5.15 KEY STAKEHOLDERS & BUYING CRITERIA 
           5.15.1 KEY STAKEHOLDERS IN BUYING PROCESS
                    FIGURE 31 INFLUENCE OF STAKEHOLDERS ON BUYING PROCESS FOR TOP THREE VERTICALS
                    TABLE 14 INFLUENCE OF STAKEHOLDERS ON BUYING PROCESS FOR TOP THREE VERTICALS
           5.15.2 BUYING CRITERIA
                    FIGURE 32 KEY BUYING CRITERIA FOR TOP THREE VERTICALS
                    TABLE 15 KEY BUYING CRITERIA FOR TOP THREE VERTICALS
    5.16 KEY CONFERENCES & EVENTS IN 2023–2024 
                    TABLE 16 FAKE IMAGE DETECTION MARKET: DETAILED LIST OF CONFERENCES & EVENTS
    5.17 INVESTMENT LANDSCAPE 
                    FIGURE 33 LEADING GLOBAL FAKE IMAGE DETECTION INVESTMENT ROUNDS AND FUNDING RAISED BY COMPANIES FROM 2017 TO 2022
 
6 FAKE IMAGE DETECTION MARKET, BY PRODUCT (Page No. - 107)
    6.1 INTRODUCTION 
    6.2 FUNCTIONALITY 
           6.2.1 BASIC DETECTION
           6.2.2 ADVANCED ANALYSIS
           6.2.3 CONTENT MODERATION
           6.2.4 FORENSIC ANALYSIS
    6.3 INTEGRATION LEVEL 
           6.3.1 STANDALONE APPLICATIONS
           6.3.2 APIS AND SDKS
           6.3.3 CLOUD-BASED SERVICES
 
7 FAKE IMAGE DETECTION MARKET, BY OFFERING (Page No. - 111)
    7.1 INTRODUCTION 
           FIGURE 34 SOLUTIONS SEGMENT TO ACCOUNT FOR LARGER MARKET SIZE DURING FORECAST PERIOD
           TABLE 17 MARKET, BY OFFERING, 2018–2023 (USD MILLION)
           TABLE 18 MARKET, BY OFFERING, 2024–2029 (USD MILLION)
           7.1.1 OFFERING: MARKET DRIVERS
    7.2 SOLUTIONS 
           7.2.1 RISING ADOPTION OF FAKE IMAGE DETECTION SOLUTIONS WITH INCREASING IMAGE FORGERY AND MANIPULATED CONTENT
           7.2.2 PHOTOSHOPPED IMAGE DETECTION
           7.2.3 DEEPFAKE IMAGE DETECTION
           7.2.4 AI-GENERATED CONTENT DETECTION
           7.2.5 CONTENT AUTHENTICITY VERIFICATION
           7.2.6 REAL-TIME DETECTION
           7.2.7 BROWSER EXTENSIONS
           7.2.8 MOBILE APPS
                    TABLE 19 SOLUTIONS: MARKET, BY REGION, 2018–2023 (USD MILLION)
                    TABLE 20 SOLUTIONS: MARKET, BY REGION, 2024–2029 (USD MILLION)
    7.3 SERVICES 
           7.3.1 PROACTIVE MONITORING AND RESPONSIVE MAINTENANCE SERVICES FOR FAKE IMAGE DETECTION
                    TABLE 21 SERVICES: MARKET, BY REGION, 2018–2023 (USD MILLION)
                    TABLE 22 SERVICES: MARKET, BY REGION, 2024–2029 (USD MILLION)
           7.3.2 CONSULTING
           7.3.3 DEPLOYMENT AND INTEGRATION
           7.3.4 SUPPORT AND MAINTENANCE
 
8 FAKE IMAGE DETECTION MARKET, BY DEPLOYMENT MODE (Page No. - 118)
    8.1 INTRODUCTION 
           FIGURE 35 ON-PREMISES SEGMENT TO ACCOUNT FOR LARGER MARKET SIZE DURING FORECAST PERIOD
           TABLE 23 MARKET, BY DEPLOYMENT MODE, 2018–2023 (USD MILLION)
           TABLE 24 MARKET, BY DEPLOYMENT MODE, 2024–2029 (USD MILLION)
           8.1.1 DEPLOYMENT MODE: MARKET DRIVERS
    8.2 CLOUD 
           8.2.1 ENHANCING FAKE IMAGE DETECTION CAPABILITIES THROUGH CLOUD DEPLOYMENT
                    TABLE 25 CLOUD: MARKET, BY REGION, 2018–2023 (USD MILLION)
                    TABLE 26 CLOUD: MARKET, BY REGION, 2024–2029 (USD MILLION)
    8.3 ON-PREMISES 
           8.3.1 MAXIMIZING DATA CONTROL WITH ON-PREMISES DEPLOYMENT IN FAKE IMAGE DETECTION
                    TABLE 27 ON-PREMISES: MARKET, BY REGION, 2018–2023 (USD MILLION)
                    TABLE 28 ON-PREMISES: MARKET, BY REGION, 2024–2029 (USD MILLION)
 
9 FAKE IMAGE DETECTION MARKET, BY ORGANIZATION SIZE (Page No. - 123)
    9.1 INTRODUCTION 
           FIGURE 36 LARGE ENTERPRISES SEGMENT TO ACCOUNT FOR LARGER MARKET SIZE DURING FORECAST PERIOD
           TABLE 29 MARKET, BY ORGANIZATION SIZE, 2018–2023 (USD MILLION)
           TABLE 30 MARKET, BY ORGANIZATION SIZE, 2024–2029 (USD MILLION)
           9.1.1 ORGANIZATION SIZE: FAKE IMAGE DETECTION MARKET DRIVERS
    9.2 LARGE ENTERPRISES 
           9.2.1 LARGE ENTERPRISES TO SECURE THEIR ONLINE PRESENCE WITH FAKE IMAGE DETECTION
                    TABLE 31 LARGE ENTERPRISES: MARKET, BY REGION, 2018–2023 (USD MILLION)
                    TABLE 32 LARGE ENTERPRISES: MARKET, BY REGION, 2024–2029 (USD MILLION)
    9.3 SMALL & MEDIUM-SIZED ENTERPRISES (SMES) 
           9.3.1 SMES TO BUILD TRUST AMONG CUSTOMERS BY EMBRACING FAKE IMAGE DETECTION SOLUTIONS
                    TABLE 33 SMES: MARKET, BY REGION, 2018–2023 (USD MILLION)
                    TABLE 34 SMES: MARKET, BY REGION, 2024–2029 (USD MILLION)
 
10 FAKE IMAGE DETECTION MARKET, BY TARGET USER (Page No. - 128)
     10.1 INTRODUCTION 
               FIGURE 37 PROFESSIONAL SEGMENT TO ACCOUNT FOR LARGEST MARKET SIZE DURING FORECAST PERIOD
               TABLE 35 MARKET, BY TARGET USER, 2018–2023 (USD MILLION)
               TABLE 36 MARKET, BY TARGET USER, 2024–2029 (USD MILLION)
             10.1.1 TARGET USER: FAKE IMAGE DETECTION MARKET DRIVERS
     10.2 INDIVIDUAL 
             10.2.1 GROWING AWARENESS AMONG INDIVIDUAL USERS REGARDING FAKE IMAGES
                       TABLE 37 INDIVIDUAL: MARKET, BY REGION, 2018–2023 (USD MILLION)
                       TABLE 38 INDIVIDUAL: MARKET, BY REGION, 2024–2029 (USD MILLION)
     10.3 PROFESSIONAL 
             10.3.1 NEED TO ENSURE AUTHENTICITY OF IMAGES IN VARIOUS FIELDS BY PROFESSIONAL USERS
                       TABLE 39 PROFESSIONAL: MARKET, BY REGION, 2018–2023 (USD MILLION)
                       TABLE 40 PROFESSIONAL: MARKET, BY REGION, 2024–2029 (USD MILLION)
     10.4 ENTERPRISE GRADE 
             10.4.1 INCREASING MANIPULATED MEDIA AND NEED TO COMBAT MISINFORMATION
                       TABLE 41 ENTERPRISE GRADE: MARKET, BY REGION, 2018–2023 (USD MILLION)
                       TABLE 42 ENTERPRISE GRADE: MARKET, BY REGION, 2024–2029 (USD MILLION)
 
11 FAKE IMAGE DETECTION MARKET, BY TECHNOLOGY (Page No. - 134)
     11.1 INTRODUCTION 
               FIGURE 38 MACHINE AND DEEP LEARNING SEGMENT TO ACCOUNT FOR LARGER MARKET DURING FORECAST PERIOD
               TABLE 43 MARKET, BY TECHNOLOGY, 2018–2023 (USD MILLION)
               TABLE 44 MARKET, BY TECHNOLOGY, 2024–2029 (USD MILLION)
             11.1.1 TECHNOLOGY: FAKE IMAGE DETECTION MARKET DRIVERS
     11.2 MACHINE AND DEEP LEARNING 
             11.2.1 DEEP LEARNING’S VITAL ROLE IN FAKE IMAGE DETECTION
                       TABLE 45 MACHINE AND DEEP LEARNING: MARKET, BY REGION, 2018–2023 (USD MILLION)
                       TABLE 46 MACHINE AND DEEP LEARNING: MARKET, BY REGION, 2024–2029 (USD MILLION)
             11.2.2 CONVOLUTIONAL NEURAL NETWORKS (CNNS)
             11.2.3 GENERATIVE ADVERSARIAL NETWORKS (GANS)
     11.3 IMAGE FORENSICS 
             11.3.1 IMAGE FORENSIC TO EXPERIENCE FAST GROWTH IN MARKET
                       TABLE 47 IMAGE FORENSICS: MARKET, BY REGION, 2018–2023 (USD MILLION)
                       TABLE 48 IMAGE FORENSICS: MARKET, BY REGION, 2024–2029 (USD MILLION)
             11.3.2 ERROR-LEVEL ANALYSIS (ELA)
             11.3.3 METADATA ANALYSIS
 
12 FAKE IMAGE DETECTION MARKET, BY APPLICATION (Page No. - 140)
     12.1 INTRODUCTION 
               FIGURE 39 SOCIAL MEDIA AND CONTENT MODERATION SEGMENT TO ACCOUNT FOR LARGEST MARKET DURING FORECAST PERIOD
               TABLE 49 FAKE IMAGE DETECTION MARKET, BY APPLICATION, 2018–2023 (USD MILLION)
               TABLE 50 MARKET, BY APPLICATION, 2024–2029 (USD MILLION)
             12.1.1 APPLICATION: MARKET DRIVERS
     12.2 SOCIAL MEDIA AND CONTENT MODERATION 
             12.2.1 INCREASING USE OF FAKE IMAGE DETECTION SOLUTIONS BY SOCIAL MEDIA PLATFORMS TO PROTECT USER IDENTITY
                       TABLE 51 SOCIAL MEDIA AND CONTENT MODERATION: MARKET, BY REGION, 2018–2023 (USD MILLION)
                       TABLE 52 SOCIAL MEDIA AND CONTENT MODERATION: MARKET, BY REGION, 2024–2029 (USD MILLION)
     12.3 DIGITAL FORENSICS 
             12.3.1 ROLE OF FAKE IMAGE DETECTION TO BE CRUCIAL IN DIGITAL FORENSICS
                       TABLE 53 DIGITAL FORENSICS: MARKET, BY REGION, 2018–2023 (USD MILLION)
                       TABLE 54 DIGITAL FORENSICS: MARKET, BY REGION, 2024–2029 (USD MILLION)
     12.4 FRAUD DETECTION 
             12.4.1 INCREASING FRAUDS IN ID VERIFICATION, BRAND PROTECTION, INTELLECTUAL PROPERTY RIGHTS, AND GAMING ASSETS SECTORS
                       TABLE 55 FRAUD DETECTION: MARKET, BY REGION, 2018–2023 (USD MILLION)
                       TABLE 56 FRAUD DETECTION: MARKET, BY REGION, 2024–2029 (USD MILLION)
     12.5 HEALTHCARE AND MEDICAL IMAGING 
             12.5.1 RESEARCH AND DEVELOPMENT EFFORTS IN HEALTHCARE SECTOR TO COMBAT IMAGE MANIPULATION
                       TABLE 57 HEALTHCARE AND MEDICAL IMAGING: MARKET, BY REGION, 2018–2023 (USD MILLION)
                       TABLE 58 HEALTHCARE AND MEDICAL IMAGING: MARKET, BY REGION, 2024–2029 (USD MILLION)
     12.6 RECRUITMENT 
             12.6.1 ENHANCING HIRING EFFICIENCY WITH IMAGE AUTHENTICATION
                       TABLE 59 RECRUITMENT: MARKET, BY REGION, 2018–2023 (USD MILLION)
                       TABLE 60 RECRUITMENT: MARKET, BY REGION, 2024–2029 (USD MILLION)
 
13 FAKE IMAGE DETECTION MARKET, BY VERTICAL (Page No. - 148)
     13.1 INTRODUCTION 
               FIGURE 40 GOVERNMENT SEGMENT TO ACCOUNT FOR LARGEST MARKET DURING FORECAST PERIOD
               TABLE 61 MARKET, BY VERTICAL, 2018–2023 (USD MILLION)
               TABLE 62 MARKET, BY VERTICAL, 2024–2029 (USD MILLION)
             13.1.1 VERTICAL: FAKE IMAGE DETECTION MARKET DRIVERS
     13.2 BANKING, FINANCIAL SERVICES, AND INSURANCE (BFSI) 
             13.2.1 INCREASING USE OF FAKE IMAGE DETECTION SOLUTIONS IN VERIFYING IDENTITY, DOCUMENTS, AND INSURANCE CLAIM
             13.2.2 BANKING, FINANCIAL SERVICES, AND INSURANCE (BFSI): FAKE IMAGE DETECTION USE CASES
                       13.2.2.1 Document Authentication
                       13.2.2.2 Identity Verification
                       13.2.2.3 Insurance Claim Verification
                       13.2.2.4 Forgery Detection
                                   TABLE 63 BANKING, FINANCIAL SERVICES, AND INSURANCE: MARKET, BY REGION, 2018–2023 (USD MILLION)
                                   TABLE 64 BANKING, FINANCIAL SERVICES, AND INSURANCE: MARKET, BY REGION, 2024–2029 (USD MILLION)
     13.3 TELECOMMUNICATIONS 
             13.3.1 SAFEGUARDING NETWORK INTEGRITY WITH FAKE IMAGE DETECTION
             13.3.2 TELECOMMUNICATIONS: FAKE IMAGE DETECTION USE CASES
                       13.3.2.1 Network Security Monitoring
                       13.3.2.2 Identity Verification
                       13.3.2.3 Content Moderation
                                   TABLE 65 TELECOMMUNICATIONS: MARKET, BY REGION, 2018–2023 (USD MILLION)
                                   TABLE 66 TELECOMMUNICATIONS: MARKET, BY REGION, 2024–2029 (USD MILLION)
     13.4 GOVERNMENT 
             13.4.1 TO COMBAT MISINFORMATION, GOVERNMENT SECTOR IMPLEMENTS FAKE IMAGE DETECTION
             13.4.2 GOVERNMENT: FAKE IMAGE DETECTION USE CASES
                       13.4.2.1 Law Enforcement and National Security
                       13.4.2.2 Border Security and Immigration
                       13.4.2.3 Disaster Response and Crisis Management
                       13.4.2.4 Public Safety and Emergency Response
                                   TABLE 67 GOVERNMENT: MARKET, BY REGION, 2018–2023 (USD MILLION)
                                   TABLE 68 GOVERNMENT: MARKET, BY REGION, 2024–2029 (USD MILLION)
     13.5 HEALTHCARE 
             13.5.1 LEVERAGING FAKE IMAGE DETECTION TECHNOLOGY TO COMBAT DEEPFAKES
             13.5.2 HEALTHCARE: FAKE IMAGE DETECTION USE CASES
                       13.5.2.1 Medical Imaging Authentication
                       13.5.2.2 Telemedicine Image Verification
                       13.5.2.3 Surgical Image Verification
                                   TABLE 69 HEALTHCARE: FAKE IMAGE DETECTION MARKET, BY REGION, 2018–2023 (USD MILLION)
                                   TABLE 70 HEALTHCARE: MARKET, BY REGION, 2024–2029 (USD MILLION)
     13.6 REAL ESTATE 
             13.6.1 TO ENSURE TRANSPARENCY IN LISTINGS WITH FAKE IMAGE DETECTION
             13.6.2 REAL ESTATE: FAKE IMAGE DETECTION USE CASES
                       13.6.2.1 Listing Verification
                       13.6.2.2 Property Ownership Verification
                       13.6.2.3 Property Condition Assessment
                                   TABLE 71 REAL ESTATE: FAKE IMAGE DETECTION MARKET, BY REGION, 2018–2023 (USD MILLION)
                                   TABLE 72 REAL ESTATE: MARKET, BY REGION, 2024–2029 (USD MILLION)
     13.7 MEDIA AND ENTERTAINMENT 
             13.7.1 RISING DEEPFAKES ON SOCIAL MEDIA PLATFORMS
             13.7.2 MEDIA & ENTERTAINMENT: FAKE IMAGE DETECTION USE CASES
                       13.7.2.1 Social Media Content Moderation
                       13.7.2.2 Advertising and Marketing
                       13.7.2.3 Brand Protection
                                   TABLE 73 MEDIA AND ENTERTAINMENT: MARKET, BY REGION, 2018–2023 (USD MILLION)
                                   TABLE 74 MEDIA AND ENTERTAINMENT: MARKET, BY REGION, 2024–2029 (USD MILLION)
     13.8 OTHER VERTICALS 
             13.8.1 OTHER VERTICALS: FAKE IMAGE DETECTION USE CASES
                       13.8.1.1 Vehicle Insurance Claims
                       13.8.1.2 Online Exam Monitoring
                       13.8.1.3 Restaurant Reviews
 
14 FAKE IMAGE DETECTION MARKET, BY REGION (Page No. - 161)
     14.1 INTRODUCTION 
               FIGURE 41 EUROPE TO GROW AT HIGHEST CAGR DURING FORECAST PERIOD
               TABLE 75 MARKET, BY REGION, 2018–2023 (USD MILLION)
               TABLE 76 MARKET, BY REGION, 2024–2029 (USD MILLION)
     14.2 NORTH AMERICA 
             14.2.1 NORTH AMERICA: FAKE IMAGE DETECTION MARKET DRIVERS
             14.2.2 NORTH AMERICA: REGULATORY LANDSCAPE
                       FIGURE 42 NORTH AMERICA: MARKET SNAPSHOT
                       TABLE 77 NORTH AMERICA: MARKET, BY OFFERING, 2018–2023 (USD MILLION)
                       TABLE 78 NORTH AMERICA: MARKET, BY OFFERING, 2024–2029 (USD MILLION)
                       TABLE 79 NORTH AMERICA: MARKET, BY TARGET USER, 2018–2023 (USD MILLION)
                       TABLE 80 NORTH AMERICA: MARKET, BY TARGET USER, 2024–2029 (USD MILLION)
                       TABLE 81 NORTH AMERICA: MARKET, BY TECHNOLOGY, 2018–2023 (USD MILLION)
                       TABLE 82 NORTH AMERICA: MARKET, BY TECHNOLOGY, 2024–2029 (USD MILLION)
                       TABLE 83 NORTH AMERICA: MARKET, BY DEPLOYMENT MODE, 2018–2023 (USD MILLION)
                       TABLE 84 NORTH AMERICA: MARKET, BY DEPLOYMENT MODE, 2024–2029 (USD MILLION)
                       TABLE 85 NORTH AMERICA: MARKET, BY VERTICAL, 2018–2023 (USD MILLION)
                       TABLE 86 NORTH AMERICA: MARKET, BY VERTICAL, 2024–2029 (USD MILLION)
                       TABLE 87 NORTH AMERICA: MARKET, BY ORGANIZATION SIZE, 2018–2023 (USD MILLION)
                       TABLE 88 NORTH AMERICA: MARKET, BY ORGANIZATION SIZE, 2024–2029 (USD MILLION)
                       TABLE 89 NORTH AMERICA: MARKET, BY APPLICATION, 2018–2023 (USD MILLION)
                       TABLE 90 NORTH AMERICA: MARKET, BY APPLICATION, 2024–2029 (USD MILLION)
                       TABLE 91 NORTH AMERICA: MARKET, BY COUNTRY, 2018–2023 (USD MILLION)
                       TABLE 92 NORTH AMERICA: MARKET, BY COUNTRY, 2024–2029 (USD MILLION)
             14.2.3 US
                       14.2.3.1 Rising document forgery frauds in US leading to increased adoption of fake image detection solutions
                                   TABLE 93 US: FAKE IMAGE DETECTION MARKET, BY OFFERING, 2018–2023 (USD MILLION)
                                   TABLE 94 US: MARKET, BY OFFERING, 2024–2029 (USD MILLION)
                                   TABLE 95 US: MARKET, BY TARGET USER, 2018–2023 (USD MILLION)
                                   TABLE 96 US: MARKET, BY TARGET USER, 2024–2029 (USD MILLION)
                                   TABLE 97 US: MARKET, BY TECHNOLOGY, 2018–2023 (USD MILLION)
                                   TABLE 98 US: MARKET, BY TECHNOLOGY, 2024–2029 (USD MILLION)
                                   TABLE 99 US: MARKET, BY DEPLOYMENT MODE, 2018–2023 (USD MILLION)
                                   TABLE 100 US: MARKET, BY DEPLOYMENT MODE, 2024–2029 (USD MILLION)
                                   TABLE 101 US: MARKET, BY VERTICAL, 2018–2023 (USD MILLION)
                                   TABLE 102 US: MARKET, BY VERTICAL, 2024–2029 (USD MILLION)
                                   TABLE 103 US: MARKET, BY ORGANIZATION SIZE, 2018–2023 (USD MILLION)
                                   TABLE 104 US: MARKET, BY ORGANIZATION SIZE, 2024–2029 (USD MILLION)
                                   TABLE 105 US: MARKET, BY APPLICATION, 2018–2023 (USD MILLION)
                                   TABLE 106 US: MARKET, BY APPLICATION, 2024–2029 (USD MILLION)
             14.2.4 CANADA
                       14.2.4.1 Increasing concerns of deepfakes in Canada
                                   TABLE 107 CANADA: FAKE IMAGE DETECTION MARKET, BY OFFERING, 2018–2023 (USD MILLION)
                                   TABLE 108 CANADA: MARKET, BY OFFERING, 2024–2029 (USD MILLION)
                                   TABLE 109 CANADA: MARKET, BY TARGET USER, 2018–2023 (USD MILLION)
                                   TABLE 110 CANADA: MARKET, BY TARGET USER, 2024–2029 (USD MILLION)
                                   TABLE 111 CANADA: MARKET, BY TECHNOLOGY, 2018–2023 (USD MILLION)
                                   TABLE 112 CANADA: MARKET, BY TECHNOLOGY, 2024–2029 (USD MILLION)
                                   TABLE 113 CANADA: MARKET, BY DEPLOYMENT MODE, 2018–2023 (USD MILLION)
                                   TABLE 114 CANADA: MARKET, BY DEPLOYMENT MODE, 2024–2029 (USD MILLION)
                                   TABLE 115 CANADA: MARKET, BY VERTICAL, 2018–2023 (USD MILLION)
                                   TABLE 116 CANADA: MARKET, BY VERTICAL, 2024–2029 (USD MILLION)
                                   TABLE 117 CANADA: MARKET, BY ORGANIZATION SIZE, 2018–2023 (USD MILLION)
                                   TABLE 118 CANADA: MARKET, BY ORGANIZATION SIZE, 2024–2029 (USD MILLION)
                                   TABLE 119 CANADA: MARKET, BY APPLICATION, 2018–2023 (USD MILLION)
                                   TABLE 120 CANADA: MARKET, BY APPLICATION, 2024–2029 (USD MILLION)
     14.3 EUROPE 
             14.3.1 EUROPE: FAKE IMAGE DETECTION MARKET DRIVERS
             14.3.2 EUROPE: REGULATORY LANDSCAPE
                       FIGURE 43 EUROPE: FAKE IMAGE DETECTION MARKET SNAPSHOT
                       TABLE 121 EUROPE: MARKET, BY OFFERING, 2018–2023 (USD MILLION)
                       TABLE 122 EUROPE: MARKET, BY OFFERING, 2024–2029 (USD MILLION)
                       TABLE 123 EUROPE: MARKET, BY TARGET USER, 2018–2023 (USD MILLION)
                       TABLE 124 EUROPE: MARKET, BY TARGET USER, 2024–2029 (USD MILLION)
                       TABLE 125 EUROPE: MARKET, BY TECHNOLOGY, 2018–2023 (USD MILLION)
                       TABLE 126 EUROPE: MARKET, BY TECHNOLOGY, 2024–2029 (USD MILLION)
                       TABLE 127 EUROPE: MARKET, BY DEPLOYMENT MODE, 2018–2023 (USD MILLION)
                       TABLE 128 EUROPE: MARKET, BY DEPLOYMENT MODE, 2024–2029 (USD MILLION)
                       TABLE 129 EUROPE: MARKET, BY VERTICAL, 2018–2023 (USD MILLION)
                       TABLE 130 EUROPE: MARKET, BY VERTICAL, 2024–2029 (USD MILLION)
                       TABLE 131 EUROPE: MARKET, BY ORGANIZATION SIZE, 2018–2023 (USD MILLION)
                       TABLE 132 EUROPE: MARKET, BY ORGANIZATION SIZE, 2024–2029 (USD MILLION)
                       TABLE 133 EUROPE: MARKET, BY APPLICATION, 2018–2023 (USD MILLION)
                       TABLE 134 EUROPE: MARKET, BY APPLICATION, 2024–2029 (USD MILLION)
                       TABLE 135 EUROPE: MARKET, BY COUNTRY, 2018–2023 (USD MILLION)
                       TABLE 136 EUROPE: MARKET, BY COUNTRY, 2024–2029 (USD MILLION)
             14.3.3 UK
                       14.3.3.1 Adoption of fake image detection solutions to combat spread of misinformation and disinformation
                                   TABLE 137 UK: FAKE IMAGE DETECTION MARKET, BY OFFERING, 2018–2023 (USD MILLION)
                                   TABLE 138 UK: MARKET, BY OFFERING, 2024–2029 (USD MILLION)
                                   TABLE 139 UK: MARKET, BY TARGET USER, 2018–2023 (USD MILLION)
                                   TABLE 140 UK: MARKET, BY TARGET USER, 2024–2029 (USD MILLION)
                                   TABLE 141 UK: MARKET, BY TECHNOLOGY, 2018–2023 (USD MILLION)
                                   TABLE 142 UK: MARKET, BY TECHNOLOGY, 2024–2029 (USD MILLION)
                                   TABLE 143 UK: MARKET, BY DEPLOYMENT MODE, 2018–2023 (USD MILLION)
                                   TABLE 144 UK: MARKET, BY DEPLOYMENT MODE, 2024–2029 (USD MILLION)
                                   TABLE 145 UK: MARKET, BY VERTICAL, 2018–2023 (USD MILLION)
                                   TABLE 146 UK: MARKET, BY VERTICAL, 2024–2029 (USD MILLION)
                                   TABLE 147 UK: MARKET, BY ORGANIZATION SIZE, 2018–2023 (USD MILLION)
                                   TABLE 148 UK: MARKET, BY ORGANIZATION SIZE, 2024–2029 (USD MILLION)
                                   TABLE 149 UK: MARKET, BY APPLICATION, 2018–2023 (USD MILLION)
                                   TABLE 150 UK: MARKET, BY APPLICATION, 2024–2029 (USD MILLION)
             14.3.4 GERMANY
                       14.3.4.1 Focus on advanced fake image detection methods in Germany
                                   TABLE 151 GERMANY: FAKE IMAGE DETECTION MARKET, BY OFFERING, 2018–2023 (USD MILLION)
                                   TABLE 152 GERMANY: FAKE IMAGE DETECTION MARKET, BY OFFERING, 2024–2029 (USD MILLION)
                                   TABLE 153 GERMANY: MARKET, BY TARGET USER, 2018–2023 (USD MILLION)
                                   TABLE 154 GERMANY: MARKET, BY TARGET USER, 2024–2029 (USD MILLION)
                                   TABLE 155 GERMANY: MARKET, BY TECHNOLOGY, 2018–2023 (USD MILLION)
                                   TABLE 156 GERMANY: MARKET, BY TECHNOLOGY, 2024–2029 (USD MILLION)
                                   TABLE 157 GERMANY: MARKET, BY DEPLOYMENT MODE, 2018–2023 (USD MILLION)
                                   TABLE 158 GERMANY: MARKET, BY DEPLOYMENT MODE, 2024–2029 (USD MILLION)
                                   TABLE 159 GERMANY: MARKET, BY VERTICAL, 2018–2023 (USD MILLION)
                                   TABLE 160 GERMANY: MARKET, BY VERTICAL, 2024–2029 (USD MILLION)
                                   TABLE 161 GERMANY: MARKET, BY ORGANIZATION SIZE, 2018–2023 (USD MILLION)
                                   TABLE 162 GERMANY: MARKET, BY ORGANIZATION SIZE, 2024–2029 (USD MILLION)
                                   TABLE 163 GERMANY: MARKET, BY APPLICATION, 2018–2023 (USD MILLION)
                                   TABLE 164 GERMANY: MARKET, BY APPLICATION, 2024–2029 (USD MILLION)
             14.3.5 FRANCE
                       14.3.5.1 France's legal and technical initiatives to propel fake image detection adoption
                                   TABLE 165 FRANCE: FAKE IMAGE DETECTION MARKET, BY OFFERING, 2018–2023 (USD MILLION)
                                   TABLE 166 FRANCE: MARKET, BY OFFERING, 2024–2029 (USD MILLION)
                                   TABLE 167 FRANCE: MARKET, BY TARGET USER, 2018–2023 (USD MILLION)
                                   TABLE 168 FRANCE: MARKET, BY TARGET USER, 2024–2029 (USD MILLION)
                                   TABLE 169 FRANCE: MARKET, BY TECHNOLOGY, 2018–2023 (USD MILLION)
                                   TABLE 170 FRANCE: MARKET, BY TECHNOLOGY, 2024–2029 (USD MILLION)
                                   TABLE 171 FRANCE: MARKET, BY DEPLOYMENT MODE, 2018–2023 (USD MILLION)
                                   TABLE 172 FRANCE: MARKET, BY DEPLOYMENT MODE, 2024–2029 (USD MILLION)
                                   TABLE 173 FRANCE: MARKET, BY VERTICAL, 2018–2023 (USD MILLION)
                                   TABLE 174 FRANCE: MARKET, BY VERTICAL, 2024–2029 (USD MILLION)
                                   TABLE 175 FRANCE: MARKET, BY ORGANIZATION SIZE, 2018–2023 (USD MILLION)
                                   TABLE 176 FRANCE: MARKET, BY ORGANIZATION SIZE, 2024–2029 (USD MILLION)
                                   TABLE 177 FRANCE: MARKET, BY APPLICATION, 2018–2023 (USD MILLION)
                                   TABLE 178 FRANCE: MARKET, BY APPLICATION, 2024–2029 (USD MILLION)
             14.3.6 ITALY
                       14.3.6.1 Increasing research initiatives to combat image manipulation in Italy
                                   TABLE 179 ITALY: FAKE IMAGE DETECTION MARKET, BY OFFERING, 2018–2023 (USD MILLION)
                                   TABLE 180 ITALY: MARKET, BY OFFERING, 2024–2029 (USD MILLION)
                                   TABLE 181 ITALY: MARKET, BY TARGET USER, 2018–2023 (USD MILLION)
                                   TABLE 182 ITALY: MARKET, BY TARGET USER, 2024–2029 (USD MILLION)
                                   TABLE 183 ITALY: MARKET, BY TECHNOLOGY, 2018–2023 (USD MILLION)
                                   TABLE 184 ITALY: MARKET, BY TECHNOLOGY, 2024–2029 (USD MILLION)
                                   TABLE 185 ITALY: MARKET, BY DEPLOYMENT MODE, 2018–2023 (USD MILLION)
                                   TABLE 186 ITALY: MARKET, BY DEPLOYMENT MODE, 2024–2029 (USD MILLION)
                                   TABLE 187 ITALY: MARKET, BY VERTICAL, 2018–2023 (USD MILLION)
                                   TABLE 188 ITALY: MARKET, BY VERTICAL, 2024–2029 (USD MILLION)
                                   TABLE 189 ITALY: MARKET, BY ORGANIZATION SIZE, 2018–2023 (USD MILLION)
                                   TABLE 190 ITALY: MARKET, BY ORGANIZATION SIZE, 2024–2029 (USD MILLION)
                                   TABLE 191 ITALY: MARKET, BY APPLICATION, 2018–2023 (USD MILLION)
                                   TABLE 192 ITALY: MARKET, BY APPLICATION, 2024–2029 (USD MILLION)
             14.3.7 REST OF EUROPE
                       TABLE 193 REST OF EUROPE: FAKE IMAGE DETECTION MARKET, BY OFFERING, 2018–2023 (USD MILLION)
                       TABLE 194 REST OF EUROPE: MARKET, BY OFFERING, 2024–2029 (USD MILLION)
                       TABLE 195 REST OF EUROPE: MARKET, BY TARGET USER, 2018–2023 (USD MILLION)
                       TABLE 196 REST OF EUROPE: MARKET, BY TARGET USER, 2024–2029 (USD MILLION)
                       TABLE 197 REST OF EUROPE: MARKET, BY TECHNOLOGY, 2018–2023 (USD MILLION)
                       TABLE 198 REST OF EUROPE: MARKET, BY TECHNOLOGY, 2024–2029 (USD MILLION)
                       TABLE 199 REST OF EUROPE: MARKET, BY DEPLOYMENT MODE, 2018–2023 (USD MILLION)
                       TABLE 200 REST OF EUROPE: MARKET, BY DEPLOYMENT MODE, 2024–2029 (USD MILLION)
                       TABLE 201 REST OF EUROPE: MARKET, BY VERTICAL, 2018–2023 (USD MILLION)
                       TABLE 202 REST OF EUROPE: MARKET, BY VERTICAL, 2024–2029 (USD MILLION)
                       TABLE 203 REST OF EUROPE: MARKET, BY ORGANIZATION SIZE, 2018–2023 (USD MILLION)
                       TABLE 204 REST OF EUROPE: MARKET, BY ORGANIZATION SIZE, 2024–2029 (USD MILLION)
                       TABLE 205 REST OF EUROPE: MARKET, BY APPLICATION, 2018–2023 (USD MILLION)
                       TABLE 206 REST OF EUROPE: MARKET, BY APPLICATION, 2024–2029 (USD MILLION)
     14.4 ASIA PACIFIC 
             14.4.1 ASIA PACIFIC: FAKE IMAGE DETECTION MARKET DRIVERS
             14.4.2 ASIA PACIFIC: REGULATORY LANDSCAPE
                       TABLE 207 ASIA PACIFIC: FAKE IMAGE DETECTION MARKET, BY OFFERING, 2018–2023 (USD MILLION)
                       TABLE 208 ASIA PACIFIC: MARKET, BY OFFERING, 2024–2029 (USD MILLION)
                       TABLE 209 ASIA PACIFIC: MARKET, BY TARGET USER, 2018–2023 (USD MILLION)
                       TABLE 210 ASIA PACIFIC: MARKET, BY TARGET USER, 2024–2029 (USD MILLION)
                       TABLE 211 ASIA PACIFIC: MARKET, BY TECHNOLOGY, 2018–2023 (USD MILLION)
                       TABLE 212 ASIA PACIFIC: MARKET, BY TECHNOLOGY, 2024–2029 (USD MILLION)
                       TABLE 213 ASIA PACIFIC: MARKET, BY DEPLOYMENT MODE, 2018–2023 (USD MILLION)
                       TABLE 214 ASIA PACIFIC: MARKET, BY DEPLOYMENT MODE, 2024–2029 (USD MILLION)
                       TABLE 215 ASIA PACIFIC: MARKET, BY VERTICAL, 2018–2023 (USD MILLION)
                       TABLE 216 ASIA PACIFIC: MARKET, BY VERTICAL, 2024–2029 (USD MILLION)
                       TABLE 217 ASIA PACIFIC: MARKET, BY ORGANIZATION SIZE, 2018–2023 (USD MILLION)
                       TABLE 218 ASIA PACIFIC: MARKET, BY ORGANIZATION SIZE, 2024–2029 (USD MILLION)
                       TABLE 219 ASIA PACIFIC: MARKET, BY APPLICATION, 2018–2023 (USD MILLION)
                       TABLE 220 ASIA PACIFIC: MARKET, BY APPLICATION, 2024–2029 (USD MILLION)
                       TABLE 221 ASIA PACIFIC: MARKET, BY COUNTRY, 2018–2023 (USD MILLION)
                       TABLE 222 ASIA PACIFIC: MARKET, BY COUNTRY, 2024–2029 (USD MILLION)
             14.4.3 CHINA
                       14.4.3.1 Government initiatives to combat deepfakes
                                   TABLE 223 CHINA: FAKE IMAGE DETECTION MARKET, BY OFFERING, 2018–2023 (USD MILLION)
                                   TABLE 224 CHINA: MARKET, BY OFFERING, 2024–2029 (USD MILLION)
                                   TABLE 225 CHINA: MARKET, BY TARGET USER, 2018–2023 (USD MILLION)
                                   TABLE 226 CHINA: MARKET, BY TARGET USER, 2024–2029 (USD MILLION)
                                   TABLE 227 CHINA: MARKET, BY TECHNOLOGY, 2018–2023 (USD MILLION)
                                   TABLE 228 CHINA: MARKET, BY TECHNOLOGY, 2024–2029 (USD MILLION)
                                   TABLE 229 CHINA: MARKET, BY DEPLOYMENT MODE, 2018–2023 (USD MILLION)
                                   TABLE 230 CHINA: MARKET, BY DEPLOYMENT MODE, 2024–2029 (USD MILLION)
                                   TABLE 231 CHINA: MARKET, BY VERTICAL, 2018–2023 (USD MILLION)
                                   TABLE 232 CHINA: MARKET, BY VERTICAL, 2024–2029 (USD MILLION)
                                   TABLE 233 CHINA: MARKET, BY ORGANIZATION SIZE, 2018–2023 (USD MILLION)
                                   TABLE 234 CHINA: MARKET, BY ORGANIZATION SIZE, 2024–2029 (USD MILLION)
                                   TABLE 235 CHINA: MARKET, BY APPLICATION, 2018–2023 (USD MILLION)
                                   TABLE 236 CHINA: MARKET, BY APPLICATION, 2024–2029 (USD MILLION)
             14.4.4 JAPAN
                       14.4.4.1 Rising awareness of fake images in Japan to drive market growth
                                   TABLE 237 JAPAN: FAKE IMAGE DETECTION MARKET, BY OFFERING, 2018–2023 (USD MILLION)
                                   TABLE 238 JAPAN: MARKET, BY OFFERING, 2024–2029 (USD MILLION)
                                   TABLE 239 JAPAN: MARKET, BY TARGET USER, 2018–2023 (USD MILLION)
                                   TABLE 240 JAPAN: MARKET, BY TARGET USER, 2024–2029 (USD MILLION)
                                   TABLE 241 JAPAN: MARKET, BY TECHNOLOGY, 2018–2023 (USD MILLION)
                                   TABLE 242 JAPAN: MARKET, BY TECHNOLOGY, 2024–2029 (USD MILLION)
                                   TABLE 243 JAPAN: MARKET, BY DEPLOYMENT MODE, 2018–2023 (USD MILLION)
                                   TABLE 244 JAPAN: MARKET, BY DEPLOYMENT MODE, 2024–2029 (USD MILLION)
                                   TABLE 245 JAPAN: MARKET, BY VERTICAL, 2018–2023 (USD MILLION)
                                   TABLE 246 JAPAN: MARKET, BY VERTICAL, 2024–2029 (USD MILLION)
                                   TABLE 247 JAPAN: MARKET, BY ORGANIZATION SIZE, 2018–2023 (USD MILLION)
                                   TABLE 248 JAPAN: MARKET, BY ORGANIZATION SIZE, 2024–2029 (USD MILLION)
                                   TABLE 249 JAPAN: MARKET, BY APPLICATION, 2018–2023 (USD MILLION)
                                   TABLE 250 JAPAN: MARKET, BY APPLICATION, 2024–2029 (USD MILLION)
             14.4.5 INDIA
                       14.4.5.1 Rising instances of deepfakes in India to propel market
                                   TABLE 251 INDIA: FAKE IMAGE DETECTION MARKET, BY OFFERING, 2018–2023 (USD MILLION)
                                   TABLE 252 INDIA: MARKET, BY OFFERING, 2024–2029 (USD MILLION)
                                   TABLE 253 INDIA: MARKET, BY TARGET USER, 2018–2023 (USD MILLION)
                                   TABLE 254 INDIA: MARKET, BY TARGET USER, 2024–2029 (USD MILLION)
                                   TABLE 255 INDIA: MARKET, BY TECHNOLOGY, 2018–2023 (USD MILLION)
                                   TABLE 256 INDIA: MARKET, BY TECHNOLOGY, 2024–2029 (USD MILLION)
                                   TABLE 257 INDIA: MARKET, BY DEPLOYMENT MODE, 2018–2023 (USD MILLION)
                                   TABLE 258 INDIA: MARKET, BY DEPLOYMENT MODE, 2024–2029 (USD MILLION)
                                   TABLE 259 INDIA: MARKET, BY VERTICAL, 2018–2023 (USD MILLION)
                                   TABLE 260 INDIA: MARKET, BY VERTICAL, 2024–2029 (USD MILLION)
                                   TABLE 261 INDIA: MARKET, BY ORGANIZATION SIZE, 2018–2023 (USD MILLION)
                                   TABLE 262 INDIA: MARKET, BY ORGANIZATION SIZE, 2024–2029 (USD MILLION)
                                   TABLE 263 INDIA: MARKET, BY APPLICATION, 2018–2023 (USD MILLION)
                                   TABLE 264 INDIA: MARKET, BY APPLICATION, 2024–2029 (USD MILLION)
             14.4.6 REST OF ASIA PACIFIC
                       TABLE 265 REST OF ASIA PACIFIC: FAKE IMAGE DETECTION MARKET, BY OFFERING, 2018–2023 (USD MILLION)
                       TABLE 266 REST OF ASIA PACIFIC: MARKET, BY OFFERING, 2024–2029 (USD MILLION)
                       TABLE 267 REST OF ASIA PACIFIC: MARKET, BY TARGET USER, 2018–2023 (USD MILLION)
                       TABLE 268 REST OF ASIA PACIFIC: MARKET, BY TARGET USER, 2024–2029 (USD MILLION)
                       TABLE 269 REST OF ASIA PACIFIC: MARKET, BY TECHNOLOGY, 2018–2023 (USD MILLION)
                       TABLE 270 REST OF ASIA PACIFIC: MARKET, BY TECHNOLOGY, 2024–2029 (USD MILLION)
                       TABLE 271 REST OF ASIA PACIFIC: MARKET, BY DEPLOYMENT MODE, 2018–2023 (USD MILLION)
                       TABLE 272 REST OF ASIA PACIFIC: MARKET, BY DEPLOYMENT MODE, 2024–2029 (USD MILLION)
                       TABLE 273 REST OF ASIA PACIFIC: MARKET, BY VERTICAL, 2018–2023 (USD MILLION)
                       TABLE 274 REST OF ASIA PACIFIC: MARKET, BY VERTICAL, 2024–2029 (USD MILLION)
                       TABLE 275 REST OF ASIA PACIFIC: MARKET, BY ORGANIZATION SIZE, 2018–2023 (USD MILLION)
                       TABLE 276 REST OF ASIA PACIFIC: MARKET, BY ORGANIZATION SIZE, 2024–2029 (USD MILLION)
                       TABLE 277 REST OF ASIA PACIFIC: MARKET, BY APPLICATION, 2018–2023 (USD MILLION)
                       TABLE 278 REST OF ASIA PACIFIC: MARKET, BY APPLICATION, 2024–2029 (USD MILLION)
     14.5 MIDDLE EAST & AFRICA 
             14.5.1 MIDDLE EAST & AFRICA: FAKE IMAGE DETECTION MARKET DRIVERS
             14.5.2 MIDDLE EAST & AFRICA: REGULATORY LANDSCAPE
                       TABLE 279 MIDDLE EAST & AFRICA: FAKE IMAGE DETECTION MARKET, BY OFFERING, 2018–2023 (USD MILLION)
                       TABLE 280 MIDDLE EAST & AFRICA: MARKET, BY OFFERING, 2024–2029 (USD MILLION)
                       TABLE 281 MIDDLE EAST & AFRICA: MARKET, BY TARGET USER, 2018–2023 (USD MILLION)
                       TABLE 282 MIDDLE EAST & AFRICA: MARKET, BY TARGET USER, 2024–2029 (USD MILLION)
                       TABLE 283 MIDDLE EAST & AFRICA: MARKET, BY TECHNOLOGY, 2018–2023 (USD MILLION)
                       TABLE 284 MIDDLE EAST & AFRICA: MARKET, BY TECHNOLOGY, 2024–2029 (USD MILLION)
                       TABLE 285 MIDDLE EAST & AFRICA: MARKET, BY DEPLOYMENT MODE, 2018–2023 (USD MILLION)
                       TABLE 286 MIDDLE EAST & AFRICA: MARKET, BY DEPLOYMENT MODE, 2024–2029 (USD MILLION)
                       TABLE 287 MIDDLE EAST & AFRICA: MARKET, BY VERTICAL, 2018–2023 (USD MILLION)
                       TABLE 288 MIDDLE EAST & AFRICA: MARKET, BY VERTICAL, 2024–2029 (USD MILLION)
                       TABLE 289 MIDDLE EAST & AFRICA: MARKET, BY ORGANIZATION SIZE, 2018–2023 (USD MILLION)
                       TABLE 290 MIDDLE EAST & AFRICA: MARKET, BY ORGANIZATION SIZE, 2024–2029 (USD MILLION)
                       TABLE 291 MIDDLE EAST & AFRICA: MARKET, BY APPLICATION, 2018–2023 (USD MILLION)
                       TABLE 292 MIDDLE EAST & AFRICA: MARKET, BY APPLICATION, 2024–2029 (USD MILLION)
                       TABLE 293 MIDDLE EAST & AFRICA: MARKET, BY REGION, 2018–2023 (USD MILLION)
                       TABLE 294 MIDDLE EAST & AFRICA: MARKET, BY REGION, 2024–2029 (USD MILLION)
             14.5.3 MIDDLE EAST
                       14.5.3.1 Proliferation of social media and widespread dissemination of digital content to drive demand for fake image detection solutions
             14.5.4 AFRICA
                       14.5.4.1 Advancements in AI technology in Africa to fuel market
     14.6 LATIN AMERICA 
             14.6.1 LATIN AMERICA: FAKE IMAGE DETECTION MARKET DRIVERS
             14.6.2 REGULATORY LANDSCAPE
                       TABLE 295 LATIN AMERICA: FAKE IMAGE DETECTION MARKET, BY OFFERING, 2018–2023 (USD MILLION)
                       TABLE 296 LATIN AMERICA: MARKET, BY OFFERING, 2024–2029 (USD MILLION)
                       TABLE 297 LATIN AMERICA: MARKET, BY TARGET USER, 2018–2023 (USD MILLION)
                       TABLE 298 LATIN AMERICA: MARKET, BY TARGET USER, 2024–2029 (USD MILLION)
                       TABLE 299 LATIN AMERICA: MARKET, BY TECHNOLOGY, 2018–2023 (USD MILLION)
                       TABLE 300 LATIN AMERICA: MARKET, BY TECHNOLOGY, 2024–2029 (USD MILLION)
                       TABLE 301 LATIN AMERICA: MARKET, BY DEPLOYMENT MODE, 2018–2023 (USD MILLION)
                       TABLE 302 LATIN AMERICA: MARKET, BY DEPLOYMENT MODE, 2024–2029 (USD MILLION)
                       TABLE 303 LATIN AMERICA: MARKET, BY VERTICAL, 2018–2023 (USD MILLION)
                       TABLE 304 LATIN AMERICA: MARKET, BY VERTICAL, 2024–2029 (USD MILLION)
                       TABLE 305 LATIN AMERICA: MARKET, BY ORGANIZATION SIZE, 2018–2023 (USD MILLION)
                       TABLE 306 LATIN AMERICA: MARKET, BY ORGANIZATION SIZE, 2024–2029 (USD MILLION)
                       TABLE 307 LATIN AMERICA: MARKET, BY APPLICATION, 2018–2023 (USD MILLION)
                       TABLE 308 LATIN AMERICA: MARKET, BY APPLICATION, 2024–2029 (USD MILLION)
                       TABLE 309 LATIN AMERICA: MARKET, BY COUNTRY, 2018–2023 (USD MILLION)
                       TABLE 310 LATIN AMERICA: MARKET, BY COUNTRY, 2024–2029 (USD MILLION)
             14.6.3 BRAZIL
                       14.6.3.1 Rising concerns regarding spread of misinformation in Brazil
                                   TABLE 311 BRAZIL: MARKET, BY OFFERING, 2018–2023 (USD MILLION)
                                   TABLE 312 BRAZIL: MARKET, BY OFFERING, 2024–2029 (USD MILLION)
                                   TABLE 313 BRAZIL: MARKET, BY TARGET USER, 2018–2023 (USD MILLION)
                                   TABLE 314 BRAZIL: MARKET, BY TARGET USER, 2024–2029 (USD MILLION)
                                   TABLE 315 BRAZIL: MARKET, BY TECHNOLOGY, 2018–2023 (USD MILLION)
                                   TABLE 316 BRAZIL: MARKET, BY TECHNOLOGY, 2024–2029 (USD MILLION)
                                   TABLE 317 BRAZIL: MARKET, BY DEPLOYMENT MODE, 2018–2023 (USD MILLION)
                                   TABLE 318 BRAZIL: MARKET, BY DEPLOYMENT MODE, 2024–2029 (USD MILLION)
                                   TABLE 319 BRAZIL: MARKET, BY VERTICAL, 2018–2023 (USD MILLION)
                                   TABLE 320 BRAZIL: MARKET, BY VERTICAL, 2024–2029 (USD MILLION)
                                   TABLE 321 BRAZIL: MARKET, BY ORGANIZATION SIZE, 2018–2023 (USD MILLION)
                                   TABLE 322 BRAZIL: MARKET, BY ORGANIZATION SIZE, 2024–2029 (USD MILLION)
                                   TABLE 323 BRAZIL: MARKET, BY APPLICATION, 2018–2023 (USD MILLION)
                                   TABLE 324 BRAZIL: MARKET, BY APPLICATION, 2024–2029 (USD MILLION)
             14.6.4 MEXICO
                       14.6.4.1 Adoption of fake image detection technology in nascent stage in Mexico
                                   TABLE 325 MEXICO: FAKE IMAGE DETECTION MARKET, BY OFFERING, 2018–2023 (USD MILLION)
                                   TABLE 326 MEXICO: MARKET, BY OFFERING, 2024–2029 (USD MILLION)
                                   TABLE 327 MEXICO: MARKET, BY TARGET USER, 2018–2023 (USD MILLION)
                                   TABLE 328 MEXICO: MARKET, BY TARGET USER, 2024–2029 (USD MILLION)
                                   TABLE 329 MEXICO: MARKET, BY TECHNOLOGY, 2018–2023 (USD MILLION)
                                   TABLE 330 MEXICO: MARKET, BY TECHNOLOGY, 2024–2029 (USD MILLION)
                                   TABLE 331 MEXICO: MARKET, BY DEPLOYMENT MODE, 2018–2023 (USD MILLION)
                                   TABLE 332 MEXICO: MARKET, BY DEPLOYMENT MODE, 2024–2029 (USD MILLION)
                                   TABLE 333 MEXICO: MARKET, BY VERTICAL, 2018–2023 (USD MILLION)
                                   TABLE 334 MEXICO: MARKET, BY VERTICAL, 2024–2029 (USD MILLION)
                                   TABLE 335 MEXICO: MARKET, BY ORGANIZATION SIZE, 2018–2023 (USD MILLION)
                                   TABLE 336 MEXICO: MARKET, BY ORGANIZATION SIZE, 2024–2029 (USD MILLION)
                                   TABLE 337 MEXICO: MARKET, BY APPLICATION, 2018–2023 (USD MILLION)
                                   TABLE 338 MEXICO: MARKET, BY APPLICATION, 2024–2029 (USD MILLION)
             14.6.5 REST OF LATIN AMERICA
                       TABLE 339 REST OF LATIN AMERICA: MARKET, BY OFFERING, 2018–2023 (USD MILLION)
                       TABLE 340 REST OF LATIN AMERICA: MARKET, BY OFFERING, 2024–2029 (USD MILLION)
                       TABLE 341 REST OF LATIN AMERICA: MARKET, BY TARGET USER, 2018–2023 (USD MILLION)
                       TABLE 342 REST OF LATIN AMERICA: MARKET, BY TARGET USER, 2024–2029 (USD MILLION)
                       TABLE 343 REST OF LATIN AMERICA: MARKET, BY TECHNOLOGY, 2018–2023 (USD MILLION)
                       TABLE 344 REST OF LATIN AMERICA: MARKET, BY TECHNOLOGY, 2024–2029 (USD MILLION)
                       TABLE 345 REST OF LATIN AMERICA: MARKET, BY DEPLOYMENT MODE, 2018–2023 (USD MILLION)
                       TABLE 346 REST OF LATIN AMERICA: MARKET, BY DEPLOYMENT MODE, 2024–2029 (USD MILLION)
                       TABLE 347 REST OF LATIN AMERICA: MARKET, BY VERTICAL, 2018–2023 (USD MILLION)
                       TABLE 348 REST OF LATIN AMERICA: MARKET, BY VERTICAL, 2024–2029 (USD MILLION)
                       TABLE 349 REST OF LATIN AMERICA: MARKET, BY ORGANIZATION SIZE, 2018–2023 (USD MILLION)
                       TABLE 350 REST OF LATIN AMERICA: MARKET, BY ORGANIZATION SIZE, 2024–2029 (USD MILLION)
                       TABLE 351 REST OF LATIN AMERICA: MARKET, BY APPLICATION, 2018–2023 (USD MILLION)
                       TABLE 352 REST OF LATIN AMERICA: FAKE IMAGE DETECTION MARKET, BY APPLICATION, 2024–2029 (USD MILLION)
 
15 COMPETITIVE LANDSCAPE (Page No. - 245)
     15.1 OVERVIEW 
     15.2 KEY PLAYER STRATEGIES/RIGHT TO WIN 
               TABLE 353 OVERVIEW OF STRATEGIES ADOPTED BY KEY FAKE IMAGE DETECTION VENDORS
     15.3 REVENUE ANALYSIS 
               FIGURE 44 REVENUE ANALYSIS OF KEY SMES OF FAKE IMAGE DETECTION VENDORS, 2019–2023 (USD MILLION)
     15.4 MARKET SHARE ANALYSIS 
               FIGURE 45 FAKE IMAGE DETECTION MARKET SHARE, 2023
               TABLE 354 MARKET: DEGREE OF COMPETITION
     15.5 PRODUCT/BRAND COMPARISON 
               FIGURE 46 BRAND COMPARISON/VENDOR PRODUCT LANDSCAPE
     15.6 STARTUP/SME EVALUATION MATRIX 
             15.6.1 PROGRESSIVE COMPANIES
             15.6.2 RESPONSIVE COMPANIES
             15.6.3 DYNAMIC COMPANIES
             15.6.4 STARTING BLOCKS
                       FIGURE 47 MARKET: STARTUP/SME EVALUATION MATRIX (2023)
             15.6.5 COMPETITIVE BENCHMARKING: STARTUPS/SMES
                       TABLE 355 MARKET: KEY STARTUPS/SMES
                       TABLE 356 VERTICAL FOOTPRINT OF STARTUPS/SMES
                       TABLE 357 REGIONAL FOOTPRINT OF STARTUPS/SMES
     15.7 COMPETITIVE SCENARIO AND TRENDS 
             15.7.1 PRODUCT LAUNCHES/DEVELOPMENTS
                       TABLE 358 MARKET: PRODUCT LAUNCHES/DEVELOPMENTS, AUGUST 2022–MARCH 2024
             15.7.2 DEALS
                       TABLE 359 MARKET: DEALS, JANUARY 2021–FEBRUARY 2024
     15.8 HARDWARE PLAYERS OVERVIEW 
             15.8.1 QUALCOMM
                       15.8.1.1 Recent Developments
             15.8.2 SONY CORPORATION
                       15.8.2.1 Recent Developments
             15.8.3 CANON
                       15.8.3.1 Recent Developments
             15.8.4 OTHERS
 
16 COMPANY PROFILES (Page No. - 257)
(Business overview, Products/Solutions/Services offered, Recent Developments, MnM view, Right to win, Strategic choices, Weaknesses and competitive threats) *
     16.1 MAJOR PLAYERS 
             16.1.1 MICROSOFT
                       TABLE 360 MICROSOFT: COMPANY OVERVIEW
                       FIGURE 48 MICROSOFT: COMPANY SNAPSHOT
                       TABLE 361 MICROSOFT: PRODUCTS/SOLUTIONS/SERVICES OFFERED
                       TABLE 362 MICROSOFT: PRODUCT LAUNCHES
             16.1.2 IPROOV
                       TABLE 363 IPROOV: COMPANY OVERVIEW
                       TABLE 364 IPROOV: PRODUCTS/SOLUTIONS/SERVICES OFFERED
             16.1.3 GRADIANT
                       TABLE 365 GRADIANT: BUSINESS OVERVIEW
                       TABLE 366 GRADIANT: PRODUCTS/SOLUTIONS/SERVICES OFFERED
             16.1.4 PRIMEAU FORENSICS
                       TABLE 367 PRIMEAU FORENSICS: COMPANY OVERVIEW
                       TABLE 368 PRIMEAU FORENSICS: PRODUCTS/SOLUTIONS/SERVICES OFFERED
             16.1.5 KAIROS
                       TABLE 369 KAIROS: COMPANY OVERVIEW
                       TABLE 370 KAIROS: PRODUCTS/SOLUTIONS/SERVICES OFFERED
             16.1.6 TRUEPIC
                       TABLE 371 TRUEPIC: COMPANY OVERVIEW
                       TABLE 372 TRUEPIC: PRODUCTS/SOLUTIONS/SERVICES OFFERED
             16.1.7 BIOID
                       TABLE 373 BIOID: COMPANY OVERVIEW
                       TABLE 374 BIOID: PRODUCTS/SOLUTIONS/SERVICES OFFERED
                       TABLE 375 BIOID: PRODUCT LAUNCHES
*Details on Business overview, Products/Solutions/Services offered, Recent Developments, MnM view, Key strengths, Strategic choices, Weaknesses and competitive threats might not be captured in case of unlisted companies.
     16.2 STARTUPS 
             16.2.1 IMAGE FORGERY DETECTOR
             16.2.2 QUANTUM INTEGRITY
             16.2.3 DUCKDUCKGOOSE AI
             16.2.4 SENTINEL AI
             16.2.5 REALITY DEFENDER
             16.2.6 CLEARVIEW AI
             16.2.7 SENSITY AI
             16.2.8 FACIA
             16.2.9 IDENFY
 
17 ADJACENT MARKETS (Page No. - 276)
     17.1 INTRODUCTION TO ADJACENT MARKETS 
               TABLE 376 ADJACENT MARKETS AND FORECASTS
             17.1.1 LIMITATIONS
     17.2 IDENTITY VERIFICATION MARKET 
               TABLE 377 IDENTITY VERIFICATION MARKET, BY OFFERING, 2017–2022 (USD MILLION)
               TABLE 378 IDENTITY VERIFICATION MARKET, BY OFFERING, 2023–2028 (USD MILLION)
               TABLE 379 IDENTITY VERIFICATION MARKET, BY TYPE, 2017–2022 (USD MILLION)
               TABLE 380 IDENTITY VERIFICATION MARKET, BY TYPE, 2023–2028 (USD MILLION)
               TABLE 381 IDENTITY VERIFICATION MARKET, BY ORGANIZATION SIZE, 2017–2022 (USD MILLION)
               TABLE 382 IDENTITY VERIFICATION MARKET, BY ORGANIZATION SIZE, 2023–2028 (USD MILLION)
               TABLE 383 IDENTITY VERIFICATION MARKET, BY DEPLOYMENT MODE, 2017–2022 (USD MILLION)
               TABLE 384 IDENTITY VERIFICATION MARKET, BY DEPLOYMENT MODE, 2023–2028 (USD MILLION)
               TABLE 385 IDENTITY VERIFICATION MARKET, BY APPLICATION, 2017–2022 (USD MILLION)
               TABLE 386 IDENTITY VERIFICATION MARKET, BY APPLICATION, 2023–2028 (USD MILLION)
               TABLE 387 IDENTITY VERIFICATION MARKET, BY VERTICAL, 2017–2022 (USD MILLION)
               TABLE 388 IDENTITY VERIFICATION MARKET, BY VERTICAL, 2023–2028 (USD MILLION)
               TABLE 389 IDENTITY VERIFICATION MARKET, BY REGION, 2017–2022 (USD MILLION)
               TABLE 390 IDENTITY VERIFICATION MARKET, BY REGION, 2023–2028 (USD MILLION)
     17.3 ARTIFICIAL INTELLIGENCE MARKET 
               TABLE 391 ARTIFICIAL INTELLIGENCE MARKET, BY OFFERING, 2017–2022 (USD MILLION)
               TABLE 392 ARTIFICIAL INTELLIGENCE MARKET, BY OFFERING, 2023–2030 (USD MILLION)
               TABLE 393 ARTIFICIAL INTELLIGENCE MARKET, BY HARDWARE, 2017–2022 (USD MILLION)
               TABLE 394 ARTIFICIAL INTELLIGENCE MARKET, BY HARDWARE, 2023–2030 (USD MILLION)
               TABLE 395 SOFTWARE: ARTIFICIAL INTELLIGENCE MARKET, BY TYPE, 2017–2022 (USD MILLION)
               TABLE 396 SOFTWARE: ARTIFICIAL INTELLIGENCE MARKET, BY TYPE, 2023–2030 (USD MILLION)
               TABLE 397 SOFTWARE: ARTIFICIAL INTELLIGENCE MARKET, BY DEPLOYMENT, 2017–2022 (USD MILLION)
               TABLE 398 SOFTWARE: ARTIFICIAL INTELLIGENCE MARKET, BY DEPLOYMENT, 2023–2030 (USD MILLION)
               TABLE 399 ARTIFICIAL INTELLIGENCE MARKET, BY SERVICE, 2017–2022 (USD MILLION)
               TABLE 400 ARTIFICIAL INTELLIGENCE MARKET, BY SERVICE, 2023–2030 (USD MILLION)
               TABLE 401 ARTIFICIAL INTELLIGENCE MARKET, BY PROFESSIONAL SERVICE, 2017–2022 (USD MILLION)
               TABLE 402 ARTIFICIAL INTELLIGENCE MARKET, BY PROFESSIONAL SERVICE, 2023–2030 (USD MILLION)
               TABLE 403 ARTIFICIAL INTELLIGENCE MARKET, BY TECHNOLOGY, 2017–2022 (USD MILLION)
               TABLE 404 ARTIFICIAL INTELLIGENCE MARKET, BY TECHNOLOGY, 2023–2030 (USD MILLION)
               TABLE 405 ARTIFICIAL INTELLIGENCE MARKET, BY BUSINESS FUNCTION, 2017–2022 (USD MILLION)
               TABLE 406 ARTIFICIAL INTELLIGENCE MARKET, BY BUSINESS FUNCTION, 2023–2030 (USD MILLION)
               TABLE 407 ARTIFICIAL INTELLIGENCE MARKET, BY VERTICAL, 2017–2022 (USD MILLION)
               TABLE 408 ARTIFICIAL INTELLIGENCE MARKET, BY VERTICAL, 2023–2030 (USD MILLION)
               TABLE 409 ARTIFICIAL INTELLIGENCE MARKET, BY REGION, 2017–2022 (USD MILLION)
               TABLE 410 ARTIFICIAL INTELLIGENCE MARKET, BY REGION, 2023–2030 (USD MILLION)
 
18 APPENDIX (Page No. - 288)
     18.1 DISCUSSION GUIDE 
     18.2 KNOWLEDGESTORE: MARKETSANDMARKETS’ SUBSCRIPTION PORTAL 
     18.3 CUSTOMIZATION OPTIONS 
     18.4 RELATED REPORTS 
     18.5 AUTHOR DETAILS 

The study involved significant activities in estimating the current market size for the fake image detection market. Exhaustive secondary research was done to collect information on the fake image detection industry. The next step was to validate these findings, assumptions, and sizing with industry experts across the value chain using primary research. Different approaches, such as top-down and bottom-up, were employed to estimate the total market size. After that, the market breakup and data triangulation procedures were used to estimate the market size of the segments and sub-segments of the Fake image detection market.

Secondary Research

The market for the companies offering fake image detection market solutions and services is arrived at by secondary data available through paid and unpaid sources, analyzing the product portfolios of the major companies in the ecosystem, and rating the companies by their performance and quality. Various sources were referred to in the secondary research process to identify and collect information for this study. The secondary sources include annual reports, press releases, investor presentations of companies, white papers, journals, certified publications, and articles from recognized authors, directories, and databases.

In the secondary research process, various secondary sources were referred to for identifying and collecting information related to the study. Secondary sources included annual reports, press releases, and investor presentations of the Fake image detection market vendors, forums, certified publications, and whitepapers. The secondary research was used to obtain critical information on the industry's value chain, the total pool of key players, market classification, and segmentation from the market and technology-oriented perspectives.

Primary Research

In the primary research process, various supply and demand sources were interviewed to obtain qualitative and quantitative information for this report. The primary sources from the supply side included industry experts, such as Chief Executive Officers (CEOs), Vice Presidents (VPs), marketing directors, technology and innovation directors, and related key executives from various key companies and organizations operating in the Fake image detection market.

After the complete market engineering (calculations for market statistics, market breakdown, market size estimations, market forecasting, and data triangulation), extensive primary research was conducted to gather information and verify and validate the critical numbers arrived at. Primary research was also undertaken to identify the segmentation types, industry trends, competitive landscape of Fake image detection solutions offered by various market players, and fundamental market dynamics, such as drivers, restraints, opportunities, challenges, industry trends, and key player strategies.

In the complete market engineering process, the top-down and bottom-up approaches and several data triangulation methods were extensively used to perform the market estimation and market forecasting for the overall market segments and subsegments listed in this report. Extensive qualitative and quantitative analysis was performed on the complete market engineering process to list the key information/insights throughout the report.

Following is the breakup of the primary study:
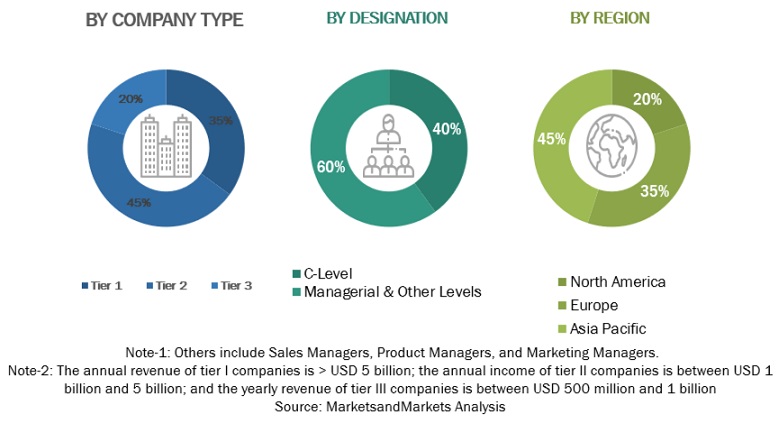
Fake Image Detection  Market Size, and Share

To know about the assumptions considered for the study, download the pdf brochure

Market Size Estimation

Top-down and bottom-up approaches were used to estimate and validate the size of the Fake image detection market and the size of various other dependent sub-segments in the overall Fake image detection market. The research methodology used to estimate the market size includes the following details: critical players in the market were identified through secondary research, and their market shares in the respective regions were determined through primary and secondary research. This entire procedure included the study of the annual and financial reports of the top market players, and extensive interviews were conducted for key insights from the industry leaders, such as CEOs, VPs, directors, and marketing executives.

All percentage splits and breakdowns were determined using secondary sources and verified through primary sources. All possible parameters that affect the market covered in this research study have been accounted for, viewed in extensive detail, verified through primary research, and analyzed to get the final quantitative and qualitative data. This data is consolidated and added to detailed inputs and analysis from MarketsandMarkets.

Infographic Depicting Bottom-Up And Top-Down Approaches
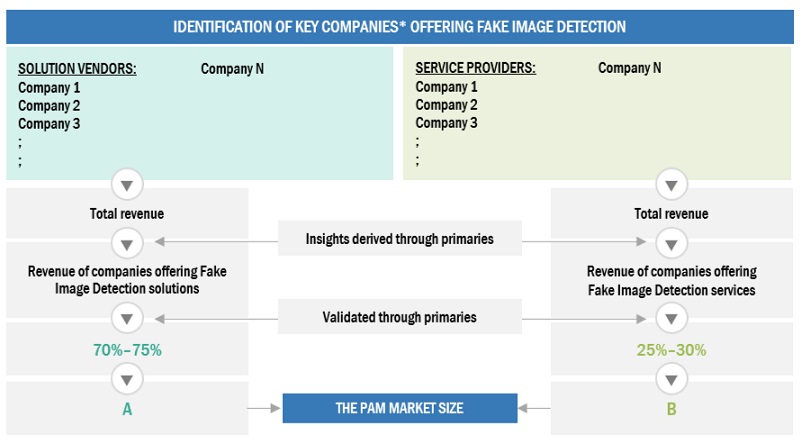
Fake Image Detection  Market Bottom Up Approach

To know about the assumptions considered for the study, Request for Free Sample Report
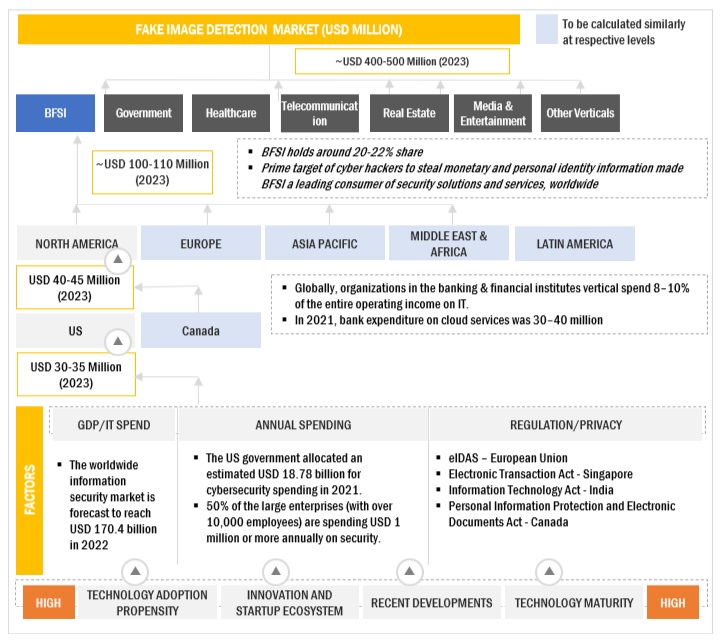
Fake Image Detection  Market Top Down Approach

Data Triangulation

The market was split into several segments and subsegments after arriving at the overall market size using the market size estimation processes explained above. The data triangulation and market breakup procedures were employed, wherever applicable, to complete the overall market engineering process and arrive at the exact statistics of each market segment and subsegment. The data was triangulated by studying various factors and trends from both the demand and supply sides. 

Market Definition

Fake image detection involves the identification of manipulated or fabricated images that are created to deceive viewers or convey false information. Still images manipulation or alterations, document forgery, photo image forgery, document/photo print forgery, deepfake image detection, and face swapping are considered in the definition of fake image detection.

Key Stakeholders

  • Chief Technology and Data Officers
  • Business Analysts
  • Information Technology (IT) Professionals
  • Government Agencies
  • Investors and Venture Capitalists
  • Small and Medium-Sized Enterprises (SMEs) And Large Enterprises
  • Third-Party Providers
  • Consultants/Consultancies/Advisory Firms
  • Automation Tool Vendor
  • OEMs
  • Third-Party Providers

Report Objectives

  • To describe and forecast the fake image detection market by offering, technology, application, target user, deployment mode, organization size, vertical, and region from 2024 to 2029, and analyze the various macroeconomic and microeconomic factors that affect market growth
  • To analyze the subsegments of the market concerning individual growth trends, prospects, and contributions to the overall market
  • To provide detailed information regarding major factors (drivers, restraints, opportunities, and challenges) influencing the growth of the market
  • To analyze the opportunities in the market for stakeholders and provide details of the competitive landscape for the major players
  • To profile the key market players; provide a comparative analysis based on the business overviews, regional presence, product offerings, business strategies, and critical financials; and illustrate the market's competitive landscape.
  • To track and analyze the competitive developments, such as mergers and acquisitions, product developments, partnerships and collaborations, and research development (R&D) activities, in the market

Customization Options

With the given market data, MarketsandMarkets offers customizations based on company-specific needs. The following customization options are available for the report:

Geographic Analysis

  • Further breakup of the Middle Eastern market into countries contributing 75% to the regional market size

Company Information

  • Detailed analysis and profiling of additional market players (up to 5)
Custom Market Research Services

We will customize the research for you, in case the report listed above does not meet with your exact requirements. Our custom research will comprehensively cover the business information you require to help you arrive at strategic and profitable business decisions.

Request Customization
Report Code
TC 8983
Published ON
Apr, 2024
Choose License Type
BUY NOW
  • SHARE
X
Request Customization
Speak to Analyst
Speak to Analyst
OR FACE-TO-FACE MEETING
PERSONALIZE THIS RESEARCH
  • Triangulate with your Own Data
  • Get Data as per your Format and Definition
  • Gain a Deeper Dive on a Specific Application, Geography, Customer or Competitor
  • Any level of Personalization
REQUEST A FREE CUSTOMIZATION
LET US HELP YOU!
  • What are the Known and Unknown Adjacencies Impacting the Fake Image Detection Market
  • What will your New Revenue Sources be?
  • Who will be your Top Customer; what will make them switch?
  • Defend your Market Share or Win Competitors
  • Get a Scorecard for Target Partners
CUSTOMIZED WORKSHOP REQUEST
  • Call Us
  • +1-888-600-6441 (Corporate office hours)
  • +1-888-600-6441 (US/Can toll free)
  • +44-800-368-9399 (UK office hours)
CONNECT WITH US
ABOUT TRUST ONLINE
©2024 MarketsandMarkets Research Private Ltd. All rights reserved
DMCA.com Protection Status
Website Feedback