
Field-Programmable Gate Array (FPGA) Market Size, Share & Trends

Field-Programmable Gate Array (FPGA) Market Size, Share & Trends by Configuration (Low-end FPGA, Mid-range FPGA, High-end FPGA), Technology (SRAM, Flash, Antifuse), Node Size (<16 nm, 20-90 nm, >90 nm), Vertical (Telecom, Data Center) and Region - Global Forecast to 2030


FIELD-PROGRAMMABLE GATE ARRAY (FPGA) MARKET SIZE, SHARE & TRENDS
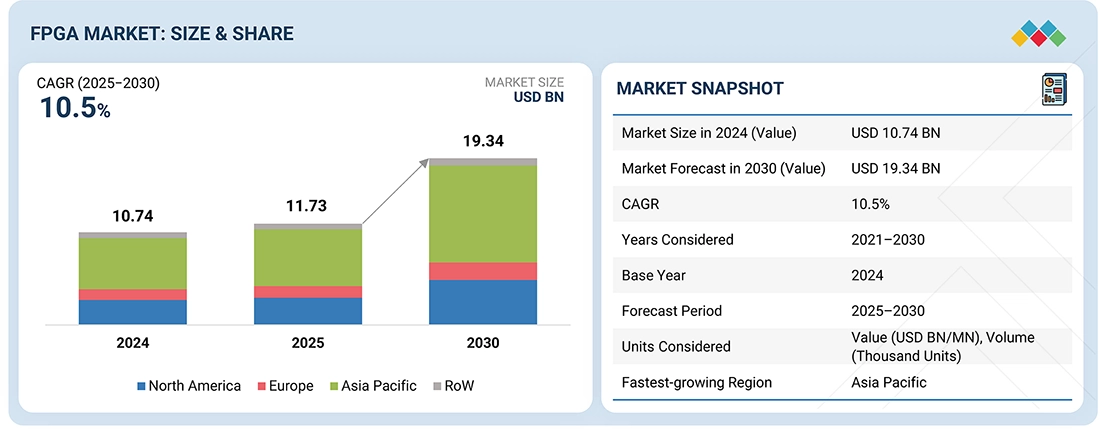
According to Marketsandmarkets, the Field-Programmable Gate Array (FPGA) market size was valued at USD 11.73 billion in 2025 and is projected to reach USD 19.34 billion in 2030 from , growing at a CAGR of 10.5% from 2025 to 2030. An FPGA is a reconfigurable semiconductor device that can be programmed after manufacturing to perform specific logic functions or digital processing tasks. The FPGA industry is driven by the rising demand for customizable and high-performance computing in data centers, telecommunications, and automotive applications, along with increasing adoption in AI acceleration, 5G infrastructure, and edge computing systems.
MARKET SNAPSHOT TABLE
| REPORT METRIC | DETAILS |
|---|---|
| Market Size in 2025 (Value) | USD 11.73 Billion |
| Market Forecast in 2030 (Value) | USD 19.34 Billion |
| Growth Rate | CAGR of 10.5% from 2025 to 2030 |
| Years Considered | 2021-2030 |
| Base Year | 2024 |
| Forecast Period | 2025-2030 |
| Units Considered | Value (USD Million/Billion), Volume (Thousand Units) |
| Report Coverage | Revenue forecast, company ranking, competitive landscape, growth factors, and trends |
| Top Companies |
|
| Growth Drivers |
|
| Segments Covered |
|
| Regional Scope | North America, Europe, Asia Pacific, and RoW |
The FPGA Market share has been expanding steadily due to the rising demand for high-performance and flexible semiconductor solutions across multiple industries. Field Programmable Gate Arrays are widely used in telecommunications, data centers, automotive electronics, and industrial automation, contributing significantly to overall FPGA Market growth. The increasing deployment of 5G infrastructure, artificial intelligence workloads, and edge computing devices is also strengthening the FPGA Market share of leading semiconductor companies. In addition, emerging FPGA Market trends such as heterogeneous computing, hardware acceleration, and low-power programmable chips are reshaping the global FPGA Industry, enabling organizations to build faster and more efficient processing systems.
Furthermore, the expansion of cloud computing and data center infrastructure is playing a crucial role in driving FPGA Market growth worldwide. Major technology companies are increasingly integrating FPGA-based accelerators to enhance computing performance, which is positively impacting the overall FPGA Market size. At the same time, evolving FPGA Market trends such as AI acceleration, automotive ADAS systems, and edge AI processing are opening new opportunities within the FPGA Industry. As innovation in programmable logic devices continues to advance, the FPGA Market share is expected to grow significantly, positioning the FPGA Industry as a key contributor to next-generation semiconductor technologies.
Market Size & Forecast
FIELD-PROGRAMMABLE GATE ARRAY (FPGA) MARKET KEY TAKEAWAYS
- The Asia Pacific FPGA market accounted for a 55.3% revenue share in 2024.
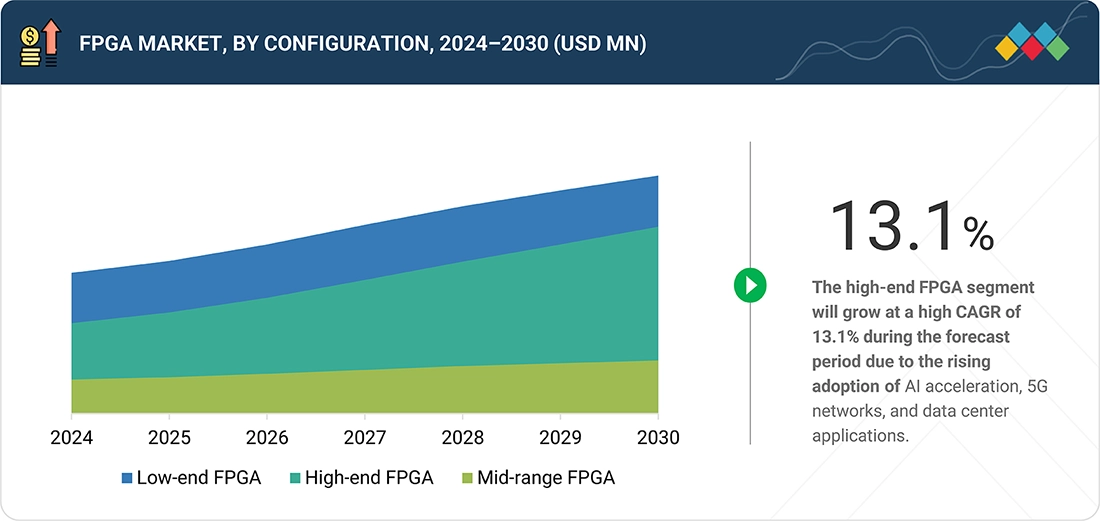
- By configuration, the high-end FPGA segment is expected to register the highest CAGR of 13.1%.
- By node size, the 20-90 NM segment is expected to dominate the market.
- By technology, the flash segment is projected to grow at the fastest rate from 2025 to 2030.
- By FPGA and eFPGA, the eFPGA segment is expected to grow at the highest CAGR of 18.4%.
- By vertical, the data center and computing segment is expected to grow at highest CAGR.
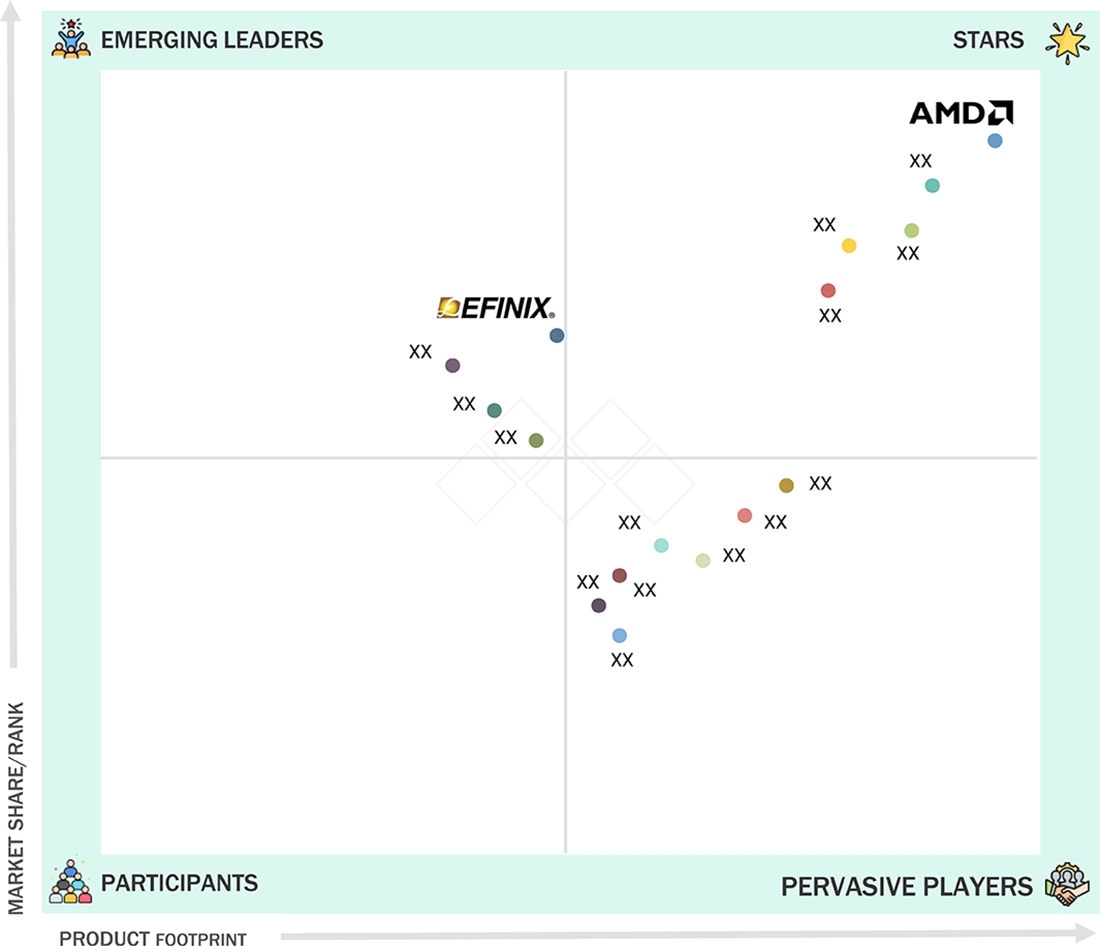
- Advanced Micro Devices, Inc., Altera Corporation, Lattice Semiconductor Corporation were identified as some of the star players in the FPGA market, given their strong market share and product footprint.
- QuickLogic Corporation, Efinix, Inc., GOWIN Semiconductor Corp., among others, have distinguished themselves among startups and SMEs by securing strong footholds in specialized niche areas, underscoring their potential as emerging market leaders
The FPGA market growth is experiencing strong growth driven by increasing demand for reconfigurable and high-performance computing across data centers, telecommunications, and automotive applications. The proliferation of AI and machine learning workloads, alongside rapid 5G network expansion, is accelerating FPGA adoption due to their parallel processing and low-latency capabilities. Additionally, advancements in system-on-chip (SoC) FPGAs and embedded FPGA (eFPGA) integration are broadening use cases in edge computing and IoT devices. As industries prioritize flexibility, energy efficiency, and faster prototyping, FPGAs are emerging as a cornerstone technology for next-generation intelligent hardware systems.
Source: Secondary Research, Interviews with Experts, MarketsandMarkets Analysis
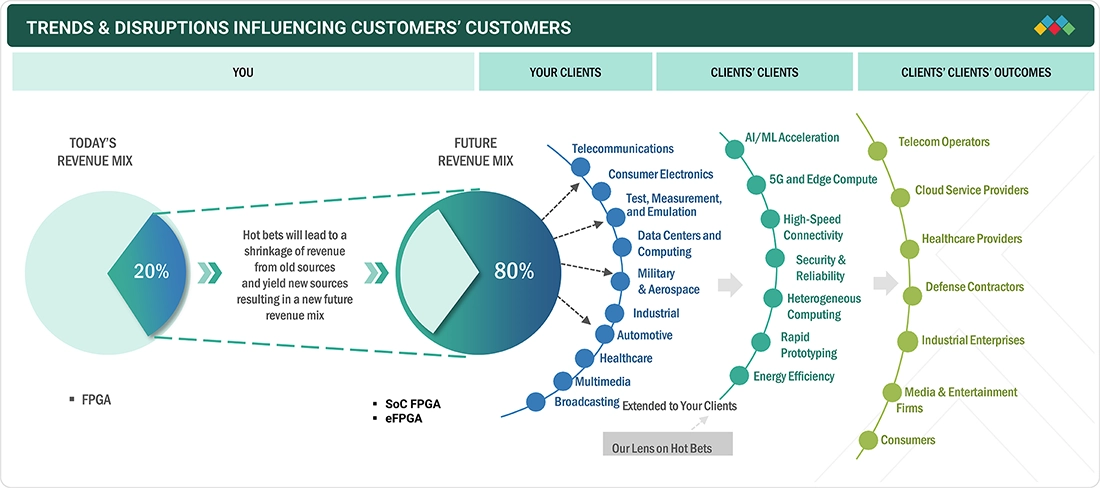
TRENDS & DISRUPTIONS IMPACTING CUSTOMERS' CUSTOMERS
Customers across telecommunications, data centers, automotive, healthcare, and industrial sectors are navigating a landscape of rapid technological evolution and market disruption, driven by AI/ML adoption, 5G rollout, edge computing, and heterogeneous computing architectures. The shift from traditional FPGA market trends applications toward SoC FPGAs and eFPGAs is enabling businesses to accelerate real-time processing, optimize energy efficiency, and deploy flexible, reprogrammable platforms.
Source: Secondary Research, Interviews with Experts, MarketsandMarkets Analysis
FIELD-PROGRAMMABLE GATE ARRAY (FPGA) MARKET DYNAMICS
Level
-
Wide adoption of AI and IoT technologies in aerospace & defense sector

-
Integration of FPGAs into advanced driver-assistance systems

Level
-
Limited availability of skilled FPGA developers

-
Risk of data security breaches arising from hidden bugs in FPGA chips

Level
-
Integration of FPGA technology into high-bandwidth devices

-
Rollout of 5G technology

Level
-
Lack of standardized FPGA verification and validation techniques

-
Extended design cycles due to complexities associated with FPGA programming

Source: Secondary Research, Interviews with Experts, MarketsandMarkets Analysis
Driver: Wide adoption of AI and IoT technologies in aerospace & defense sector
The aerospace & defense sector is increasingly leveraging AI and IoT technologies for real-time data analysis, autonomous systems, and mission-critical applications. FPGAs play a key role in enabling high-speed processing, low-latency computations, and reconfigurable hardware for radar, avionics, and satellite systems. The growing need for adaptive and secure systems in defense operations is driving FPGA adoption, as they allow rapid customization and integration with AI-enabled sensors and communication networks. This trend is accelerating investments in FPGA-based solutions to meet the sector’s evolving technological demands.
Restraint: Limited availability of skilled FPGA developers
The FPGA market faces a shortage of skilled engineers who can effectively design, program, and optimize complex FPGA architectures. This talent gap slows down development cycles, increases project costs, and limits adoption among small and mid-sized enterprises. As FPGA applications become more sophisticated, especially in AI, 5G, and automotive sectors, the demand for specialized knowledge in hardware description languages (HDLs), high-level synthesis, and embedded system design grows.
Opportunity: Integration of FPGA technology into high-bandwidth devices
Integrating FPGAs into high-bandwidth devices such as 5G base stations, data center accelerators, and edge AI platforms presents significant growth potential. FPGAs can provide real-time processing, low latency, and adaptability to evolving communication protocols, making them ideal for bandwidth-intensive applications. This integration enables OEMs and system designers to deliver scalable and future-proof solutions while optimizing energy efficiency and performance. As device complexity increases, the role of FPGAs in enhancing throughput and flexibility becomes even more critical.
Challenge: Lack of standardized FPGA verification and validation techniques
FPGA development often geta affected from the absence of standardized verification and validation methodologies, leading to longer design cycles and a higher risk of functional errors. Different vendors and toolchains use varying simulation and testing protocols, making cross-platform integration and reliability assurance difficult. This challenge is particularly pronounced in safety-critical industries such as automotive, aerospace, and healthcare, where errors can have severe consequences. Addressing this requires the development of unified verification frameworks, the adoption of automated validation tools, and adherence to industry-wide best practices.
Field-Programmable Gate Array (FPGA) Market: COMMERCIAL USE CASES ACROSS INDUSTRIES
| COMPANY | USE CASE DESCRIPTION | BENEFITS |
|---|---|---|
 |
Magewell used AMD Artix UltraScale+ FPGAs to develop a 4K media capture device supporting 20 Gb/s USB 3.2 Gen 2x2 connectivity, ensuring high-speed data transmission and power efficiency. | Achieved stable 20 Gb/s USB performance, enhanced I/O efficiency, reduced development time, lower power consumption, and faster time-to-market |
 |
DigiBird integrated Xilinx Kintex-7 and Kintex UltraScale+ FPGAs to build a lossless distributed audiovisual solution, replacing lossy H.264/H.265 compression for control room and conferencing systems. | Delivered ultra-low latency, lossless video streaming, faster product deployment, and high-quality visuals for mission-critical AV systems |
|
|
Newtouch Electronics employed Xilinx Virtex UltraScale+ VU19P FPGAs in its 4th-gen PHINEDesign platform for large-scale ASIC/SoC prototyping and verification in China’s semiconductors industry. | Improved verification efficiency by 30%, reduced workload by 50%, shortened verification cycles, and accelerated chip time-to-market |
 |
TU Berlin researchers utilized Gidel’s ProcStar FPGA boards to develop a flexible Software-defined Radio (SDR) system for research, teaching, and real-time digital signal processing. | Enabled 250 MHz RF bandwidth, scalable SDR capabilities, real-time processing, and flexible system upgrades using advanced FPGA hardware |
|
|
Flex Ltd. partnered with Intel to integrate Cyclone IV FPGAs into its SMT production line for real-time analytics, predictive maintenance, and Industry 4.0 transformation. | Enhanced productivity, reduced downtime, enabled predictive maintenance, improved flexibility, and achieved intelligent, connected manufacturing |
Logos and trademarks shown above are the property of their respective owners. Their use here is for informational and illustrative purposes only.
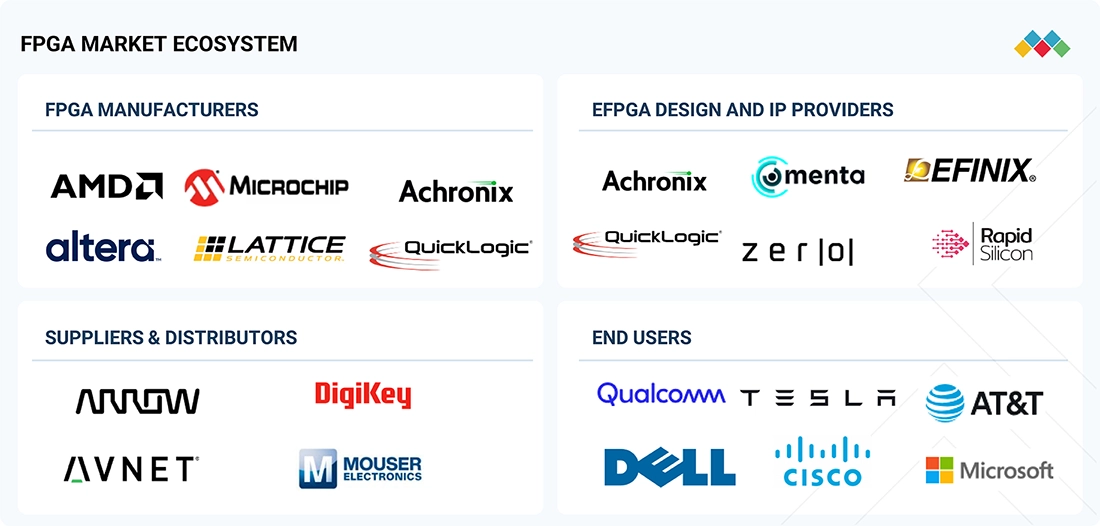
FIELD-PROGRAMMABLE GATE ARRAY (FPGA) MARKET ECOSYSTEM
The FPGA ecosystem is an interconnected network spanning device manufacturers, eFPGA design and IP providers, suppliers and distributors, and vertical end markets. FPGA manufacturers develop and produce programmable logic devices that serve as the foundation for diverse applications, while eFPGA IP providers and design partners enable the integration of customizable logic into SoCs and ASICs, accelerating time-to-market and supporting application-specific innovations.
Logos and trademarks shown above are the property of their respective owners. Their use here is for informational and illustrative purposes only.
FIELD-PROGRAMMABLE GATE ARRAY (FPGA) MARKET SEGMENTS
Source: Secondary Research, Interviews with Experts, MarketsandMarkets Analysis
FPGA Market, By Configuration
The low-end FPGA segment is expected to dominate the market due to its widespread use in cost-sensitive and power-efficient applications such as industrial control systems, consumer electronics, and IoT devices. These FPGAs offer the right balance of flexibility, low power consumption, and affordability, making them ideal for edge and embedded systems. The growing miniaturization of electronics and demand for rapid product customization are further driving the adoption of low-end FPGAs across multiple industries.
FPGA Market, By Node Size
FPGAs built on ≤16 nm process nodes are expected to witness the highest growth rate as they deliver superior performance, lower power consumption, and higher logic density. The shift toward smaller nodes enables the integration of AI acceleration and advanced signal processing in compact form factors, ideal for data center, automotive, and 5G applications. As semiconductor manufacturers invest in next-generation fabrication technologies, sub-16 nm FPGAs are becoming central to high-speed computing and AI-driven workloads.
FPGA Market, By Technology
SRAM-based FPGAs hold the largest market share owing to their reprogrammability, high-speed operation, and adaptability for complex system architectures. They are widely deployed in networking, data center, and defense applications that demand frequent updates and configuration flexibility. The continuous evolution of SRAM architectures with enhanced security and power optimization features further reinforces their dominance in the FPGA landscape.
FPGA and eFPGA Market Size
The eFPGA segment is projected to grow at a rapid pace as more chipmakers integrate reconfigurable logic blocks directly into ASICs and SoCs for application-specific flexibility. This trend allows developers to achieve performance efficiency while maintaining adaptability for evolving workloads in AI, edge, and automotive systems. Increasing collaboration between eFPGA IP providers and semiconductor foundries is also driving faster adoption across custom silicon designs.
FPGA Market, By Vertical
The telecommunications vertical dominates the FPGA market, fueled by the expansion of 5G infrastructure, network virtualization, and high-speed data transmission requirements. FPGAs enable real-time signal processing, beamforming, and low-latency communication, making them critical for telecom base stations and edge networks. The transition toward open and software-defined network architectures further amplifies FPGA deployment across the telecom ecosystem.
FIELD-PROGRAMMABLE GATE ARRAY (FPGA) MARKET BY REGION
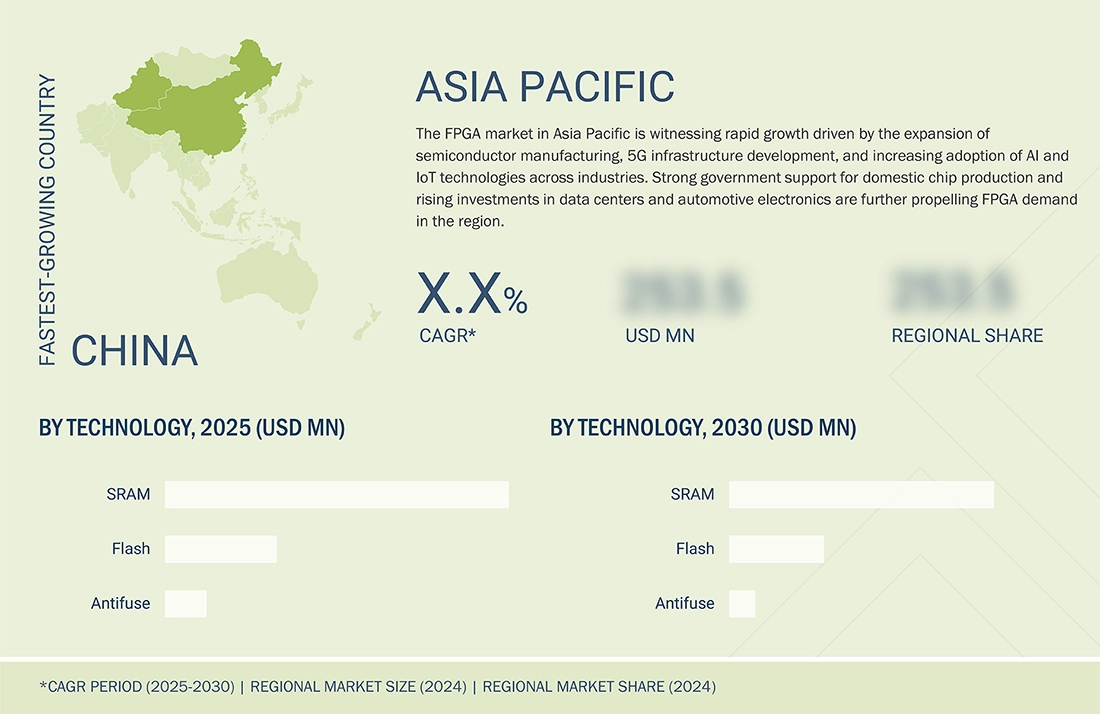
Asia Pacific to be fastest-growing region in global FPGA market during forecast period
The Asia Pacific is expected to register the fastest growth in the FPGA market, driven by strong semiconductor manufacturing bases in China, Japan, South Korea, and India. Rapid 5G deployment, industrial automation, and increasing adoption of AI-enabled devices are propelling regional demand. Furthermore, government initiatives supporting local chip production and R&D investments are positioning the Asia Pacific as a key hub for FPGA innovation and deployment.
Field-Programmable Gate Array (FPGA) Market: COMPANY EVALUATION MATRIX
The company evaluation matrix for the FPGA market highlights the positioning of key players based on their product capabilities, technological innovation, and market expansion strategies. In the FPGA market matrix, Advanced Micro Devices (AMD), Inc. leads with its broad portfolio of high-performance and adaptive FPGA solutions, advanced AI acceleration capabilities, and strong presence across data center, telecommunications, and automotive applications. Efinix, Inc. on the other hand, is rapidly gaining momentum with its innovative Trion FPGAs and low-power, cost-efficient solutions, targeting emerging applications in edge computing, IoT, and industrial automation.
Source: Secondary Research, Interviews with Experts, MarketsandMarkets Analysis
WHAT IS IN IT FOR YOU: Field-Programmable Gate Array (FPGA) Market REPORT CONTENT GUIDE
DELIVERED CUSTOMIZATIONS
We have successfully delivered the following deep-dive customizations:
| CLIENT REQUEST | CUSTOMIZATION DELIVERED | VALUE ADDS |
|---|---|---|
| Local Competitive Landscape | Profiles of key regional players in the FPGA market, including market share, revenue, product portfolios, and strategic initiatives in programmable logic devices and adaptive computing | Facilitated competitive benchmarking and informed strategy development |
| Regional Market Entry Strategy | Country- or region-specific go-to-market strategies, including barriers, regulations, and competitive landscape for FPGA technologies in semiconductors and electronics | Minimized entry risk and accelerated market adoption |
| Local Risk & Opportunity Assessment | Identification of regional risks, barriers, and untapped opportunities by market or sector in FPGA applications | Enabled proactive risk mitigation and strategic investments |
| Technology Adoption by Region | Insights on local adoption of key FPGA technologies (SRAM, Flash, Antifuse) and node sizes (≤16 nm, 20-90 nm, >90 nm) | Guided R&D, product positioning, and investment decisions |
| Vertical-specific Customization Strategies | Tailored analyses for sectors like telecommunications, data centers, automotive, and aerospace, covering FPGA use cases, integration challenges, and scalability | Enhanced sector-specific innovation and deployment efficiency |
RECENT DEVELOPMENTS IN FIELD-PROGRAMMABLE GATE ARRAY (FPGA)
- September 2025 : Altera Corporation completed the Silver Lake acquisition, finalizing its transition into the world’s largest independent FPGA solutions provider. The investment empowers Altera to enhance customer and partner support through a full-stack FPGA portfolio, robust software tools, and resilient supply chains, ensuring accessible, high-performance AI and programmable solutions across global markets.
- July 2024 : Microchip Technology Inc. introduced new milestones for its Radiation-Tolerant (RT) PolarFire family, including the availability of engineering samples for the RT PolarFire SoC FPGA. Leveraging nonvolatile technology for radiation immunity and up to 50% lower power consumption than SRAM-based devices, the RT PolarFire SoC FPGA ensures mission-critical reliability, reduced system complexity, and optimized SWaP for advanced space applications.
- January 2025 : QuickLogic Corporation and Honeywell International Inc. entered a strategic collaboration to develop Radiation-Hardened (SRH) FPGA technology for aerospace and Department of Defense applications. Valued at approximately USD 15 million over 4 years, the collaboration focuses on advanced FPGAs tailored for strategic space systems and defense needs.
- July 2025 : Lattice Semiconductor Corporation and Mitsubishi Electric collaborated to integrate Lattice’s low-power CertusPro-NX FPGAs into Mitsubishi Electric’s CNC solutions. This collaboration enables high-accuracy, adaptable, and energy-efficient factory automation, supporting industrial applications in machine building, automotive, and electronics.
- March 2024 : Advanced Micro Devices, Inc. launched the Spartan UltraScale+ FPGA family, expanding its portfolio of cost-optimized FPGAs for I/O-intensive edge applications. Built on a proven 16nm fabric, these devices offer the industry's highest I/O to logic cell ratio in their class, up to 30 percent lower total power than the previous generation, and robust security features. The Spartan UltraScale+ FPGAs enable seamless any-to-any connectivity for sensing and control with high I/O counts, flexible interfaces, and an ultra-compact footprint.
Table of Contents
 Exclusive indicates content/data unique to MarketsandMarkets and not available with any competitors.
Methodology
The study involved four major activities in estimating the current size of the field programmable gate array (FPGA) market. Exhaustive secondary research collected information on the market, peer, and parent markets. The next step was to validate these findings, assumptions, and sizing with industry experts across the value chain through primary research. Both top-down and bottom-up approaches were employed to estimate the complete market size. After that, market breakdown and data triangulation techniques were used to estimate the market size of segments and subsegments.
Secondary Research
The secondary research process has referred to various secondary sources to identify and collect necessary information for this study. The secondary sources include annual reports, press releases, and investor presentations of companies; white papers; journals and certified publications; and articles from recognized authors, websites, directories, and databases. Secondary research was conducted to obtain critical information about the industry’s supply chain, the market’s value chain, the total pool of key players, market segmentation according to the industry trends (to the bottom-most level), regional markets, and key developments from market- and technology-oriented perspectives. Secondary data was collected and analyzed to determine the overall market size, which was further validated through primary research.
Primary Research
Extensive primary research was conducted after gaining knowledge about the current scenario of the FPGA market through secondary research. Several primary interviews were conducted with experts from the demand and supply sides across four major regions: North America, Europe, the Asia Pacific, and the Rest of the World (RoW). This primary data was collected through questionnaires, emails, and telephone interviews.
 Market Size, and Share")
Notes: Other designations include technology heads, media analysts, sales managers, marketing managers, and product managers.
The three tiers of the companies are based on their total revenues as of 2024; Tier 1: >USD 1 billion, Tier 2: USD 500 million–1 billion, and Tier 3: USD 500 million.
To know about the assumptions considered for the study, download the pdf brochure
Market Size Estimation
In the complete market engineering process, top-down and bottom-up approaches and several data triangulation methods were used to estimate and forecast the overall market segments and subsegments listed in this report. Key players in the market were identified through secondary research, and their market shares in the respective regions were determined through primary and secondary research. This entire procedure includes the study of annual and financial reports of the top market players and extensive interviews for key insights (quantitative and qualitative) with industry experts (CEOs, VPs, directors, and marketing executives).
All percentage shares, splits, and breakdowns were determined using secondary sources and verified through primary sources. All the parameters affecting the markets covered in this research study were accounted for, viewed in detail, verified through primary research, and analyzed to obtain the final quantitative and qualitative data. This data was consolidated and supplemented with detailed inputs and analysis from MarketsandMarkets and presented in this report.
Field-Programmable Gate Array (FPGA) Market : Top-Down and Bottom-Up Approach
 Market Top Down and Bottom Up Approach")
Data Triangulation
After arriving at the overall market size, the market was split into several segments and subsegments using the market size estimation processes explained above. Data triangulation and market breakdown procedures were employed to complete the entire market engineering process and determine the exact statistics of each market segment and subsegment. The data was triangulated by studying various factors and trends from the demand and supply sides in the FPGA market.
Market Definition
FPGAs are reconfigurable semiconductor devices that can be programmed post-manufacturing to perform specific logic functions, enabling flexible hardware customization. They are built on different technologies such as SRAM-based FPGAs for reprogrammability, Flash-based FPGAs for non-volatility and low power, and Antifuse-based FPGAs for permanent, high-security configurations. FPGAs are categorized as low-end, mid-range, and high-end devices depending on their logic density, performance, and power efficiency. They are widely used across industries, including telecommunications, data centers, automotive, industrial automation, military and aerospace, consumer electronics, healthcare, test and measurement, broadcasting, and multimedia, for applications requiring high-speed parallel processing and adaptability.
Key Stakeholders
- Original equipment manufacturers (OEMs)
- Technology solution providers
- Research institutes
- Market research and consulting firms
- Forums, alliances, and associations related to the FPGA market
- Technology investors
- Governments and financial institutions
- Analysts and strategic business planners
- Existing end users and prospective ones
- Business providers
- Professional service/solution providers
- Cloud service providers
- Software & platform providers
- Enterprise users
- Developers & researchers
- Data center operators
- Telecom & networking companies
- Regulatory bodies & industry associations
- Systems integrators
- Consulting firms
- Academic & research institutions
Report Objectives
- To describe and forecast the FPGA market based on configuration, node size, technology, FPGA and eFPGA market size, vertical, and region, in terms of value
- To describe and forecast the FPGA market for various segments across four major regions—North America, Europe, the Asia Pacific, and the Rest of World (RoW), in terms of value
- To forecast the size and market segments of the FPGA market by volume based on configuration
- To provide detailed information regarding drivers, restraints, opportunities, and challenges influencing market growth
- To provide the ecosystem analysis, case study analysis, patent analysis, technology analysis, ASP analysis, key conferences and events, key stakeholders and buying criteria, Porter’s Five Forces analysis, and regulations pertaining to the market under study
- To provide a detailed overview of the value chain of the FPGA landscape
- To strategically analyze micromarkets1 concerning individual growth trends, prospects, and contributions to the total market
- To strategically profile the key players and comprehensively analyze their market shares and core competencies2
- To analyze the opportunities in the market for stakeholders and describe the competitive landscape
- To assess the competitive developments, such as collaborations, agreements, partnerships, and product developments, in the market
- To analyze the impact of the macroeconomic outlook for each region
Customization Options
With the given market data, MarketsandMarkets offers customizations according to the specific requirements of companies. The following customization options are available for the report:
Company Information:
- Additional country-wise breakdown for North America, Europe, the Asia Pacific, and the Rest of the World
Company Information:
- Detailed analysis and profiling of additional market players (up to five)
Key Questions Addressed by the Report
What is the projected size of the FPGA Market by 2030?
The global FPGA Market is projected to grow from USD 11.73 billion in 2025 to USD 19.34 billion by 2030.
What is the expected CAGR of the FPGA Market during 2025–2030?
The market is expected to register a CAGR of 10.5% during the forecast period from 2025 to 2030.
What are the key growth drivers of the FPGA Market?
Major growth drivers include the adoption of AI and IoT technologies in aerospace & defense, expansion of 5G infrastructure, growth of edge computing, and increasing demand for high-performance computing.
Which industries are driving demand for FPGA solutions?
Telecommunications, data centers, automotive, aerospace & defense, industrial automation, healthcare, and consumer electronics are key end-use industries.
What are the latest trends in the FPGA Market?
Key trends include AI acceleration, embedded FPGA (eFPGA) adoption, heterogeneous computing, edge AI processing, and FPGA integration in advanced driver-assistance systems (ADAS).
Which region dominates the FPGA Market?
Asia Pacific holds the largest market share, accounting for over 55% of global revenue, driven by strong semiconductor manufacturing and electronics demand.
Which FPGA segment is expected to grow the fastest?
The high-end FPGA segment is projected to witness the highest CAGR due to increasing deployment in AI, cloud computing, and data center applications.
Who are the leading companies in the FPGA Market?
Major market players include Advanced Micro Devices, Inc., Altera Corporation, Lattice Semiconductor Corporation, Microchip Technology Inc., and Achronix Semiconductor Corporation.
How is AI influencing the FPGA industry?
AI workloads require low-latency and parallel processing capabilities, making FPGAs a preferred solution for AI acceleration in data centers, edge devices, and defense systems.
What does an FPGA Market report typically analyze?
FPGA market reports typically analyze market size, growth forecasts, technology trends, competitive landscape, regional outlook, segment analysis, opportunities, challenges, and strategic developments of key players.
Need a Tailored Report?
Customize this report to your needs
Get 10% FREE Customization
Customize This ReportPersonalize This Research
- Triangulate with your Own Data
- Get Data as per your Format and Definition
- Gain a Deeper Dive on a Specific Application, Geography, Customer or Competitor
- Any level of Personalization
Let Us Help You
- What are the Known and Unknown Adjacencies Impacting the Field-Programmable Gate Array (FPGA) Market
- What will your New Revenue Sources be?
- Who will be your Top Customer; what will make them switch?
- Defend your Market Share or Win Competitors
- Get a Scorecard for Target Partners

Custom Market Research Services
We Will Customise The Research For You, In Case The Report Listed Above Does Not Meet With Your Requirements
Get 10% Free CustomisationTESTIMONIALS

Tetsuya Ohhira
Business Development Manager-Technology Business
Nikon Corporation,
Leading Japanese MNC specializing in optics and imaging productswww.nikon.com
MarketsandMarkets™ response
is quick. Their attitude is flexible and positive. Analyst Insights are globally considered and
significant. Client Services quickly respond to our inquiry and demand. Their wide range of global
surveys help us make our strategic plan.
We hope Knowledge Store will be easier to search
for a report.
VP - Marketing & Business Development
Leading Provider of Process Control Solutions
We engaged with MarketsandMarkets on a study to perform an analysis and recommend a Go-To-Market strategy for metrology and process control in the semiconductor market. The study was tailored to our targets and needs with well-defined milestones. Our overall experience with the MarketsandMarkets team was very good throughout the project in all aspects including the analysis methodologies used, the quality and depth of primary and secondary data sets, the professionalism and flexibility of the team and the ability to meet the target schedule and milestones. We want to thank MarketsandMarkets team for a job well done.
- US Field-Programmable Gate Array (FPGA) Market
- Canada Field-Programmable Gate Array (FPGA) Market
- Mexico Field-Programmable Gate Array (FPGA) Market
- Germany Field-Programmable Gate Array (FPGA) Market
- UK Field-Programmable Gate Array (FPGA) Market
- France Field-Programmable Gate Array (FPGA) Market
- Italy Field-Programmable Gate Array (FPGA) Market
- Rest Of Europe Field-Programmable Gate Array (FPGA) Market
Growth opportunities and latent adjacency in Field-Programmable Gate Array (FPGA) Market


Derek
Apr, 2026
How is the integration of FPGAs in advanced driver assistance systems (ADAS) transforming the automotive industry and enabling real-time AI-based decision-making? .
Frank
Apr, 2026
What role do FPGAs play in modern data centers, and how do they compare with GPUs and ASICs in handling AI workloads and network acceleration?.
Lance
Apr, 2026
What are the major pricing trends of low-end, mid-range, and high-end FPGAs across regions, and how do they affect purchasing decisions for enterprises?.