
Fuel Cell Generator Market

Fuel Cell Generator Market by End User (Marine, Aquaculture, Construction, Agriculture, Data Centers, Emergency Response Generators), Size [Small (=200 kW), Large (>200 kW)], Fuel Type (Hydrogen, Ammonia, Methanol), and Region - Global Forecast to 2030


OVERVIEW
Source: Secondary Research, Interviews with Experts, MarketsandMarkets Analysis
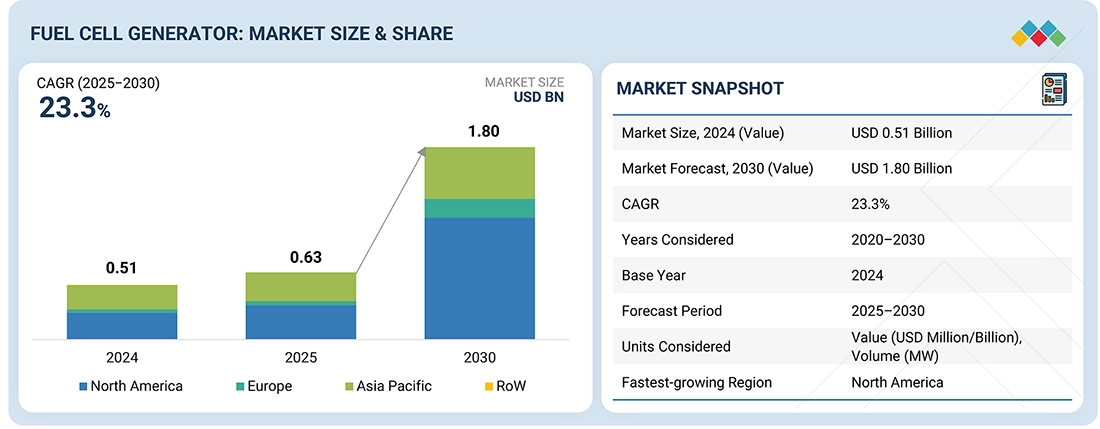
The fuel cell generator market is projected to grow from USD 0.63 billion in 2025 to USD 1.80 billion by 2030, at a CAGR of 23.3%. The fuel cell generator market is increasingly driven by the demand for decentralized energy systems that ensure energy independence and grid resilience.
Fuel Cell Generator Market Size and Forecast:
- Market Size Value in 2024: USD 0.51 Billion
- Market Size Value in 2025: USD 0.63 Billion
- Revenue Forecast in 2030: USD 1.80 Billion
- Growth Rate: CAGR of 23.3% from 2025 to 2030
- Data available from 2020 to 2030
Fuel Cell Generator Market Trends and Insights
- Market Growth: Fuel Cell Generator Market growth is driven by increasing adoption of clean energy technologies and rising investments in hydrogen-based power generation systems.
-
Growing Trends: Demand for Fuel Cell Generators is increasing across data centers, telecom, and backup power applications due to their low-emission and reliable operation.
- Growth Opportunities: Integration of renewable energy sources into power grids, supportive government policies, incentives, and rebates on installation of Fuel Cell Generators are creating new market opportunities.
- Market Share Analysis: The small-scale (up to 200 kW) segment is expected to account for the largest Fuel Cell Generator market share owing to its broad use in commercial and backup power applications.
KEY TAKEAWAYS
-
BY APPLICATIONThe data centers segment is the fastest-growing application in the fuel cell generator market due to the increasing demand for reliable, uninterrupted power and low-carbon energy solutions. Fuel cells provide high efficiency, scalability, and backup power, critical for mission-critical operations. Rising adoption of cloud computing, AI, and hyperscale data centers drives the need for clean, resilient power solutions, while stringent carbon reduction targets encourage integrating fuel cells over conventional diesel generators.
-
BY SIZEThe small-scale (up to 200 kW) segment is estimated to be the larger market over large-scale generators during the forecast period due to their suitability for a wide range of applications. These include residential buildings, commercial spaces, telecom towers, and small industrial setups. These systems are compact and easy to install, making them ideal for decentralized power generation, especially in areas where grid access is limited or unreliable.
-
BY FUEL TYPEThe ammonia-based fuel cells are projected to grow at the highest CAGR during the forecast period as ammonia has a high hydrogen content, is easier to store and transport than hydrogen, and is gaining traction as a carbon-free energy carrier. Ammonia can also be liquefied at moderate pressures as opposed to hydrogen, which requires expensive cryogenic temperatures to be stored as a liquid.
-
BY REGIONEurope is projected to be the largest region in the fuel cell generator market, driven by strong climate policies, ambitious net-zero targets, and extensive funding for hydrogen and fuel cell technologies under initiatives like the European Green Deal. Countries such as Germany, France, and the Netherlands are actively investing in clean backup power and hydrogen infrastructure.
-
COMPETITIVE LANDSCAPEThe major market players have adopted both organic and inorganic strategies, including partnerships and investments. Prominent players such as PoweCell Sweden AB and Nedstack Fuel Cell Technology have entered into a number of agreements and partnerships to cater to the growing demand for fuel cell generators.
The growing threat of cyberattacks and natural disasters has heightened interest in distributed generation solutions like fuel cell generators, which provide uninterrupted power with minimal external dependencies. Additionally, the shift toward smart energy infrastructure and the integration of AI-driven energy management systems are creating new opportunities for fuel cell deployment.
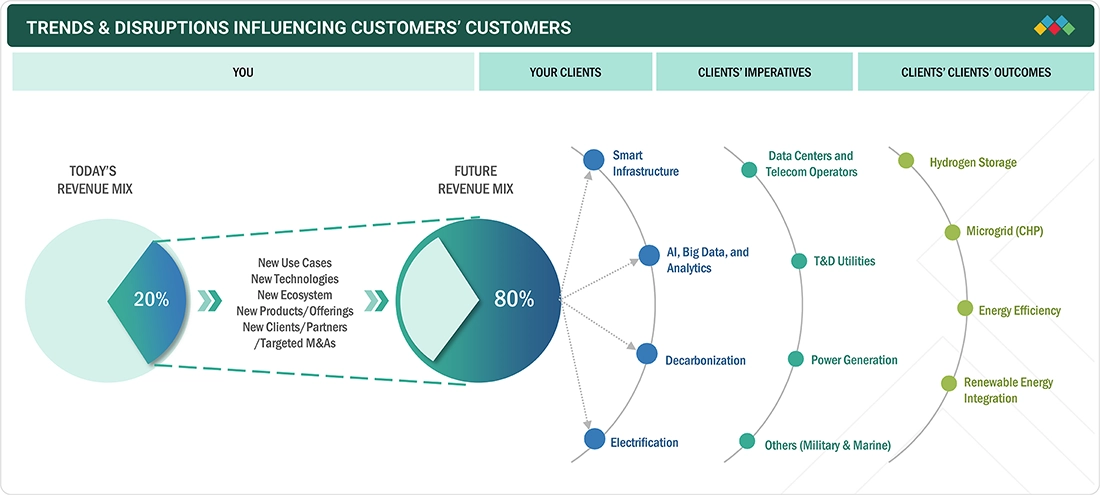
TRENDS & DISRUPTIONS IMPACTING CUSTOMERS' CUSTOMERS
The growing focus on clean energy solutions and strong government initiatives to achieve net-zero emissions is expected to drive the fuel cell generator market. Additionally, fuel cell manufacturers and their value chain partners must proactively embrace digitalization, decarbonization, and evolving regulatory frameworks to unlock new revenue streams and sustain competitiveness. The emergence of modular and distributed fuel cell systems is challenging traditional centralized power generation by offering greater flexibility, faster deployment, and lower operational costs, making fuel cells more accessible to diverse markets. The fuel cell generator market is undergoing a strategic transformation fueled by technological advancements, supportive policies, and intensified decarbonization efforts.
Source: Secondary Research, Interviews with Experts, MarketsandMarkets Analysis
MARKET DYNAMICS
Level
-
Global focus on reducing carbon emissions and environmental impact

-
Hydrogen fuel cell generators are replacing diesel backups in data centers seeking cleaner energy

Level
-
High upfront cost compared to conventional diesel or gas generators limits mass adoption

-
High capital expenditure associated with hydrogen energy storage

Level
-
Integration of renewable energy sources into power grids

-
Supportive government policies, incentives, and rebates on installation of fuel cell generators

Level
-
Water management in proton-exchange membrane fuel cells

-
High operational temperature of solid oxide fuel cells

Source: Secondary Research, Interviews with Experts, MarketsandMarkets Analysis
Driver: Global focus on reducing carbon emissions and environmental impact
There has been a growing global emphasis on reducing greenhouse gas emissions and transitioning toward cleaner energy sources in recent years. Governments, organizations, industries, and individuals worldwide actively support initiatives to curb carbon emissions and mitigate environmental impacts. The marine sector is likely to be the fastest-growing market for fuel cell generators, owing to the increasing use of fuel cell systems in ships due to their high efficiency, reliability, and durability. The International Maritime Organization (IMO), a specialized agency of the United Nations, plays a pivotal role in regulating maritime activities to promote sustainability. In July 2021, IMO implemented mandatory measures to improve energy efficiency and reduce greenhouse gas emissions in international shipping. These measures encourage alternative low-carbon and zero-carbon fuels specifically tailored for marine applications.
Restraint: High upfront cost compared to conventional diesel or gas generators limits mass adoption
The high cost of catalysts in fuel cell generators serves as a significant restraint for the widespread adoption of this technology. Catalysts play a crucial role in facilitating electrochemical reactions within fuel cells, enabling the conversion of fuel into electricity. However, the cost of catalyst materials, such as platinum, is relatively high, which significantly contributes to the overall cost of the fuel cell system. This cost factor poses a challenge in making fuel cell generators economically viable, especially compared to other energy generation technologies, such as gas turbines, Stirling engines, and internal combustion engines (IC engines). Catalysts are vital components of fuel cells as they enhance their efficiency and power density by up to 46%.
Opportunity: Integration of renewable energy sources into power grids
Increasing renewable energy integration presents a significant opportunity for the fuel cell generator market. With the increasing share of renewable energy sources, such as solar and wind power, the need for effective energy storage and balancing solutions will likely increase. Fuel cell generators can play a crucial role in this integration process. They can efficiently convert excess renewable energy into hydrogen through the process of electrolysis, storing it for later use. This capability supports grid balancing as hydrogen can be used to supply power during peak demand periods or when renewable energy generation is low. Also, when there is a dip in renewable energy production, fuel cell generators can utilize the stored hydrogen to generate electricity, ensuring a stable and reliable power supply. This ability to store and dispatch renewable energy on demand makes fuel cell generators valuable for enhancing the reliability and resilience of renewable energy systems.
Challenge: Water management in proton-exchange membrane fuel cells
Water management is a critical aspect of proton-exchange membrane (PEM) fuel cells, which are commonly used in various applications, such as transportation, portable power, and distributed energy generation. Efficient water management plays a pivotal role in the optimal functioning and longevity of PEM fuel cells. The challenge lies in maintaining an appropriate balance of water within the cell to ensure efficient proton conduction, electrode reactions, and the prevention of membrane drying or flooding. Excessive water can flood the electrodes, hindering the reactant supply and causing performance degradation, while insufficient water can result in membrane dehydration and decreased proton conductivity. Therefore, effective water management strategies, such as using humidification techniques, careful design of gas flow channels, and implementing water transport materials, are crucial to maintaining the right water content within the PEM fuel cell.
Fuel Cell Generator Market: COMMERCIAL USE CASES ACROSS INDUSTRIES
| COMPANY | USE CASE DESCRIPTION | BENEFITS |
|---|---|---|
 |
Walmart was pursuing a goal to be supplied by 100% renewable energy while maintaining ultra-low operating costs. However, it needed a clean energy solution that could deliver reliable, continuous power (even during grid outages) and help reduce energy expenses, all while meeting strict sustainability and supplier evaluation standards. Traditional grid power was not only carbon-intensive but also vulnerable to interruptions, which posed risks to operational efficiency and product safety. Additionally, Walmart sought a scalable solution that could be replicated across its widespread facilities without requiring major infrastructure overhauls. | The implementation of Bloom Energy Servers provided Walmart with multiple benefits. It enabled reliable, continuous on-site power generation, reducing dependence on the carbon-intensive and outage-prone grid. The biogas-fueled fuel cells significantly lowered Walmart’s carbon footprint while supporting its 100% renewable energy goal. Operational efficiency improved through stable, predictable electricity costs, helping optimize energy budgeting. The modular and scalable design allowed easy replication across multiple sites without major infrastructure upgrades. Additionally, by ensuring uninterrupted power during outages, Walmart enhanced product safety and supply chain resilience, aligning sustainability with cost-effectiveness and business continuity. |
 |
Verizon’s Garden City central office in New York, a major telecommunications hub, was experiencing increasingly unreliable grid electricity due to frequent outages and aging infrastructure. These power interruptions posed serious risks to the operation of critical services, including 9-1-1 emergency systems, with potential service disruptions costing millions of dollars per incident. Additionally, the facility faced high local electricity rates, ranging from USD 0.12 to USD 0.14 per kilowatt-hour, which significantly increased operational costs. Traditional backup generators also had limitations in terms of efficiency and environmental impact, prompting the need for a more reliable and sustainable energy solution | The fuel cell-based CHP system provided Verizon with major operational, economic, and environmental benefits. By generating on-site power with over 96% availability, it ensured uninterrupted electricity for critical telecom operations, including 9-1-1 services, significantly reducing outage risks. The system’s combined electrical and thermal efficiency of up to 61% enhanced overall energy utilization, cutting CO2 emissions by around 11 million pounds annually. Utilizing captured waste heat for heating and cooling met 75% of the facility’s thermal demand, further improving sustainability. Additionally, the solution lowered annual energy costs by about USD 500,000, strengthening both reliability and cost efficiency. |
Logos and trademarks shown above are the property of their respective owners. Their use here is for informational and illustrative purposes only.
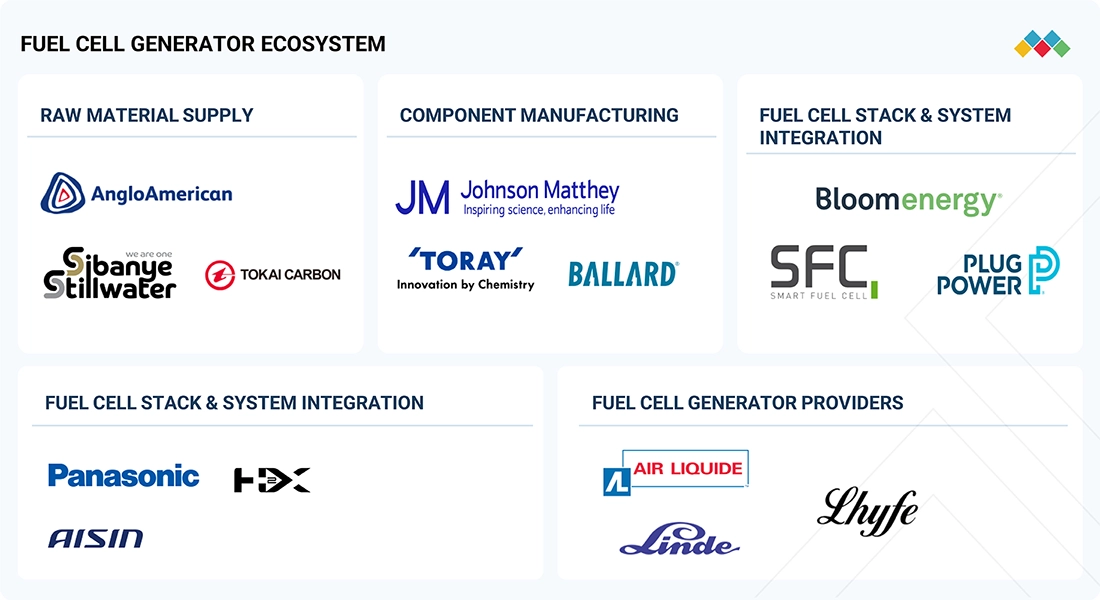
MARKET ECOSYSTEM
The fuel cell generator analysis shows the interconnections/adjacencies that affect the fuel cell market by showcasing MnM coverage of the market under study. The section highlights the key industries and applications impacting the market under study. The fuel cell generator ecosystem involves key players operating across different levels. Anglo American Platinum, Sibanye-Stillwater, and Tokai Carbon Co., Ltd. serve as leading Raw material suppliers. Major component providers, such as Johnson Matthey, Ballard Power Systems, and TORAY INDUSTRIES, INC., provide sourcing, contracting, and supply of critical Components, materials, and services required for fuel cell products. Companies such as Bloom Energy, Plug Power Inc., Doosan Fuel Cell Co., Ltd., and SFC Energy AG focus on the system integration of fuel cells. Major Players like Panasonic Holdings Corporation and H2X Global Limited provide fuel cell generators to end users. Players including Linde PLC, Air Liquide, and Lhyfe Heroes are instrumental in building the global hydrogen backbone, including refueling stations and supply logistics, which are critical for scaling fuel cell deployment. This interconnected network drives innovation and growth within the fuel cell market.
Logos and trademarks shown above are the property of their respective owners. Their use here is for informational and illustrative purposes only.
MARKET SEGMENTS
Source: Secondary Research, Interviews with Experts, MarketsandMarkets Analysis
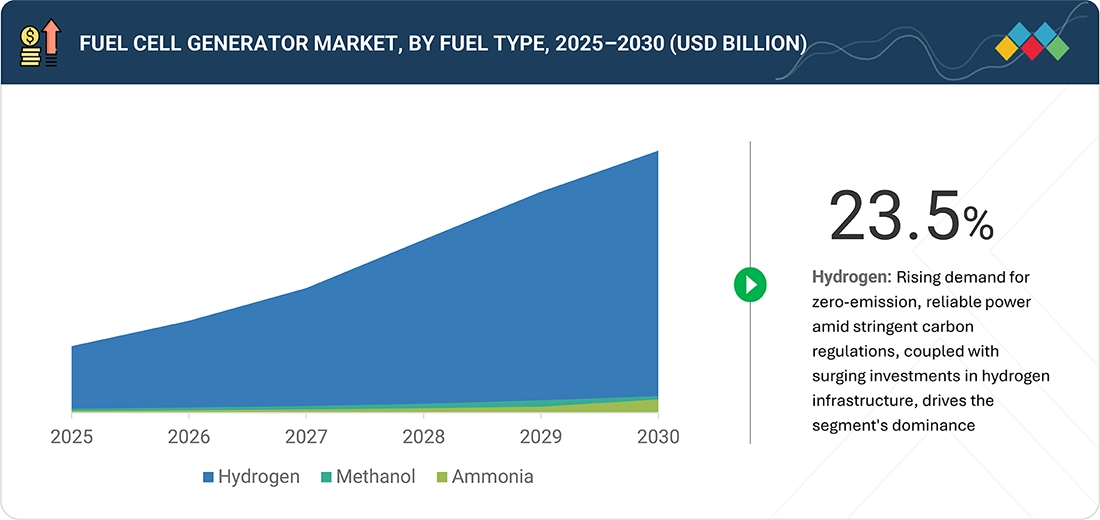
Fuel Cell Generator Market, by Fuel Type
The hydrogen segment leads the fuel cell generator market primarily because it offers a truly zero-emission alternative, producing only water as a byproduct. This perfectly aligns with escalating global demands for sustainable energy solutions. Governments and industries are increasingly prioritizing decarbonization efforts, pushing for cleaner technologies that reduce reliance on fossil fuels and mitigate climate impacts. This shift is fueled by widespread recognition of hydrogen's versatility as a clean energy carrier, enabling seamless integration with renewable sources like solar and wind to store and dispatch power efficiently.
Fuel Cell Generator Market, by Size
The small-scale (up to 200 kW) fuel cell generators dominate the market due to their compact design and portability, making them ideal for distributed power needs in space-constrained environments. Technological advancements have enhanced efficiency, durability, and reliability, positioning these units as quiet, vibration-free alternatives to diesel generators with minimal emissions. They excel in critical applications like data center backups, marine auxiliary power, emergency response, and remote operations in agriculture or construction, aligning seamlessly with global sustainability goals and supportive policies that favor clean, resilient energy solutions.
Fuel Cell Generator Market, by Application
The data centers segment commands the largest share in the fuel cell generator market due to the escalating need for reliable, emission-free backup and primary power solutions amid surging computational demands from artificial intelligence, cloud computing, and edge infrastructure. Fuel cells provide silent, vibration-free operation with high efficiency, utilizing byproduct heat for server cooling, which enhances overall system performance and reduces environmental impact. As hyperscale operators prioritize sustainability to meet global decarbonization mandates and energy independence goals, these generators seamlessly replace noisy diesel alternatives, offering modular scalability and rapid response times for uninterrupted uptime in mission-critical environments.
REGION
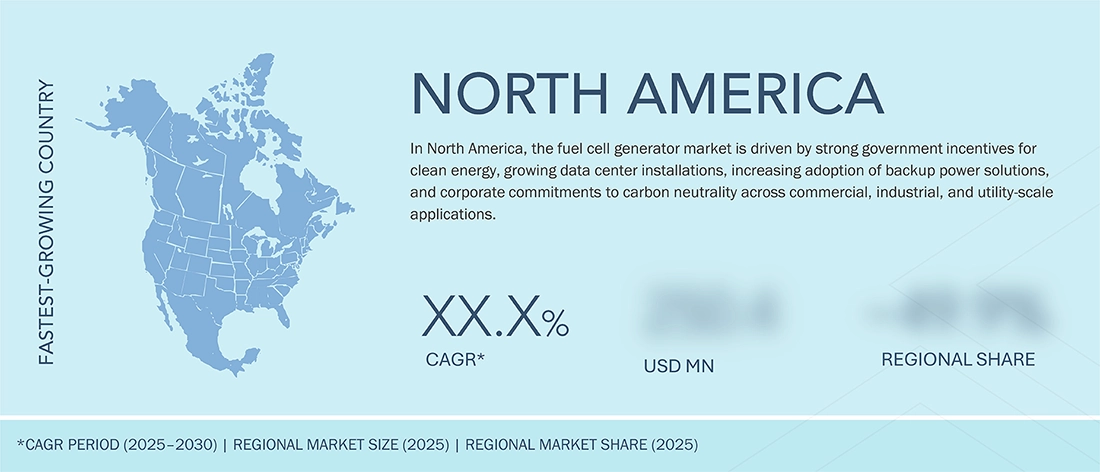
North America to be largest-growing region in global fuel cell generator market during forecast period
North America is poised to lead as the fastest-growing region in the global fuel cell generator market, propelled by robust government incentives like the US Inflation Reduction Act's tax credits and the Bipartisan Infrastructure Law's allocation for hydrogen hubs, alongside Canada's Hydrogen Strategy, which accelerates infrastructure development and cost reductions. Surging demand for resilient, zero-emission backup power in data centers, healthcare, and remote sites addresses frequent grid outages, while seamless integration with renewables enhances energy security and decarbonization goals. Technological advancements in PEMFC and SOFC efficiencies, coupled with public-private collaborations from leaders like Plug Power and Bloom Energy, further solidify the region's dominance through scalable CHP systems and off-grid innovations.
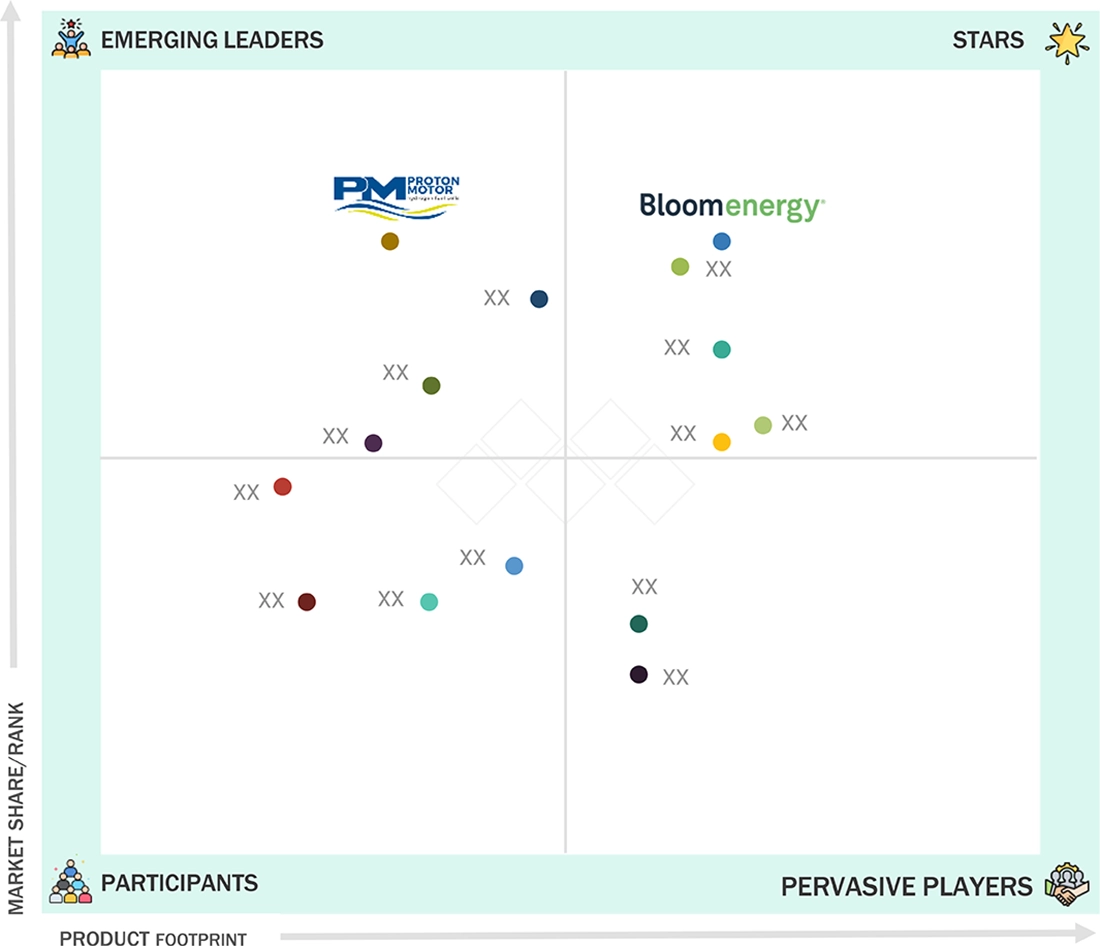
Fuel Cell Generator Market: COMPANY EVALUATION MATRIX
Bloom Energy (Star) leads with vast investments in solid oxide fuel cell production, leveraging its global manufacturing infrastructure and partnerships to scale generators for data centers and industrial use. Its diversified portfolio and focus on decarbonization position it as a dominant player driving market expansion. Proton Motor Fuel Cell GmbH (Emerging Leader) is advancing fuel cell generators through innovative pilot projects and collaborations in Europe, particularly targeting renewable integration and green hydrogen-based systems, steadily strengthening its role in the market.
Source: Secondary Research, Interviews with Experts, MarketsandMarkets Analysis
KEY MARKET PLAYERS
MARKET SCOPE
| REPORT METRIC | DETAILS |
|---|---|
| Market Size, 2024 (Value) | USD 0.51 Billion |
| Market Forecast, 2030 (Value) | USD 1.80 Billion |
| Growth Rate | CAGR of 23.3% from 2025 to 2030 |
| Years Considered | 2020–2030 |
| Base Year | 2024 |
| Forecast Period | 2025–2030 |
| Units Considered | Value (USD Billion), Volume (MW) |
| Report Coverage | Revenue forecast, company ranking, competitive landscape, growth factors, and trends |
| Segments Covered |
|
| Regions Covered | North America, Asia Pacific, Europe, RoW |
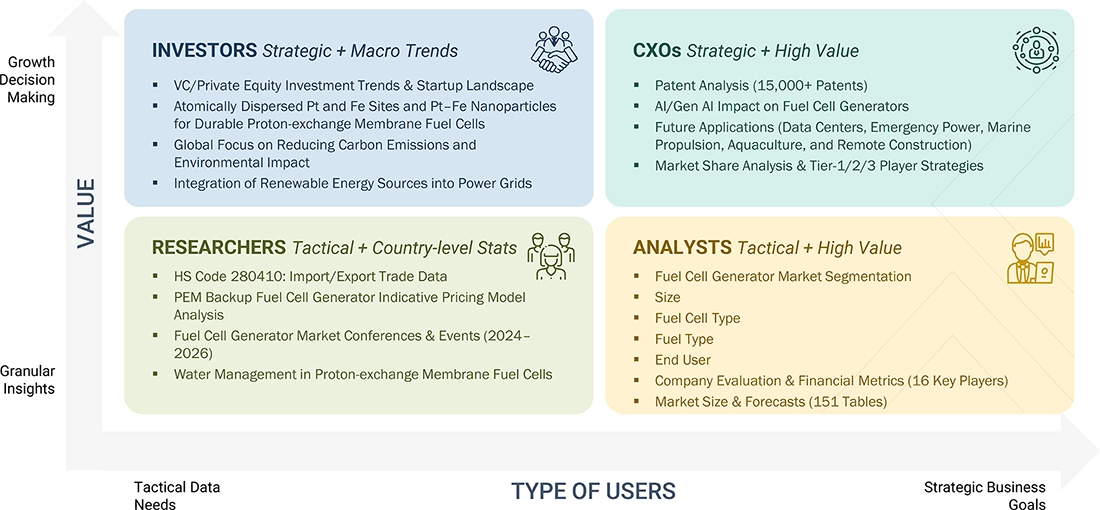
WHAT IS IN IT FOR YOU: Fuel Cell Generator Market REPORT CONTENT GUIDE
DELIVERED CUSTOMIZATIONS
We have successfully delivered the following deep-dive customizations:
| CLIENT REQUEST | CUSTOMIZATION DELIVERED | VALUE ADDS |
|---|---|---|
| European Fuel Cell Generator Market | Market sizing for European countries - UK, Germany, France, Norway, Rest of Europe |
|
RECENT DEVELOPMENTS
- February 2025 : Bloom Energy expanded its 10-year agreement with Equinix, surpassing 100 MW of installed capacity across 19 data centers in six US states. This milestone reflected the scalability of Bloom’s fuel cell technology in powering AI-driven infrastructure. The deployment of on-site, clean, and reliable energy solutions supported growing digital energy needs and demonstrates fuel cells’ critical role in decarbonizing high-demand sectors, accelerating growth in the fuel cell generator market.
- February 2023 : Doosan Fuel Cell and the government of South Australia entered into an agreement encompassing several key areas of collaboration. The agreement involved exchanging equipment and expertise to facilitate the production of environmentally friendly hydrogen and its derivatives. It also entailed the developed strategies and partnerships to enhance global competitiveness in hydrogen exports. The agreement aims to secure research partnerships and projects that accelerate future decarbonization efforts. The agreement fostered the development of domestic markets by constructing infrastructure for the supply and utilization of green hydrogen.
- January 2022 : PowerCell launched a Marine System 200 product, an industrialized high-power fuel cell module with low weight and a compact format, developed for the electrification of marine applications.
- November 2021 : Ballard Power Systems launched a three-year project through collaboration with Caterpillar Inc. and Microsoft to demonstrate a power system incorporating large-format hydrogen fuel cells to produce reliable and sustainable backup power for data centers
Table of Contents
 Exclusive indicates content/data unique to MarketsandMarkets and not available with any competitors.
Methodology
The study involved major activities in estimating the current size of the fuel cell generator market. Exhaustive secondary research was done to collect information on the peer and parent markets. The next step was to validate these findings, assumptions, and sizing with industry experts across the value chain through primary research. Both top-down and bottom-up approaches were employed to estimate the complete market size. Thereafter, market breakdown and data triangulation were used to estimate the market size of the segments and subsegments.
Secondary Research
Secondary sources referred to for this research study include annual reports, press releases, and investor presentations of companies; white papers; certified publications; articles from recognized authors; and databases of various companies and associations. Secondary research has been mainly used to obtain key information about the industry’s supply chain, monetary chain, the total pool of key players, market classification, and segmentation according to industry trends to the bottom-most level, regional markets, and key developments from both market- and technology-oriented perspectives.
Primary Research
In the primary research process, various primary sources from both the supply and demand sides have been interviewed to obtain qualitative and quantitative information for this report. Primary sources from the supply side include industry experts, such as CEOs, vice presidents, marketing directors, technology & innovation directors, and related key executives from various companies and organizations operating in the fuel cell generator market.
In the complete market engineering process, the top-down and bottom-up approaches and several data triangulation methods have been used to perform market estimation and market forecasts for the market segments and subsegments listed in this report. Extensive qualitative and quantitative analyses have been performed in the market engineering process to list key information/insights in the report.

To know about the assumptions considered for the study, download the pdf brochure
Market Size Estimation
The top-down and bottom-up approaches were used to estimate and validate the size of the global fuel cell generator market and to evaluate the sizes of various other dependent submarkets. The key players in the market were identified through secondary research, and their shares in the respective regions were determined through primary and secondary research. This entire procedure included the study of annual and financial reports of top market players and extensive interviews for key insights with industry leaders such as CEOs, VPs, directors, and marketing executives. All percentage shares, splits, and breakdowns were determined using secondary sources and verified through primary sources. All possible parameters that affect the markets covered in this research study were accounted for, viewed in extensive detail, verified through primary research, and analyzed to get the final quantitative and qualitative data.
Fuel Cell Generator Market : Top-Down and Bottom-Up Approach

Data Triangulation
After arriving at the overall market size from the estimation process explained below, the total market has been split into several segments and subsegments. The data triangulation and market breakdown procedures have been employed, wherever applicable, to complete the overall market engineering process and arrive at the exact statistics for all the segments and subsegments. The data has been triangulated by studying various factors and trends from both the demand and supply sides.
Market Definition
Fuel cell generators (FCGs) are advanced devices that convert chemical energy from a fuel source, typically hydrogen, into electricity through electrochemical processes. These generators consist of various components, including an electrolyte, an anode, a cathode, and a catalyst. Additionally, an FCG comprises fuel cell stacks and other balance of plant (BoP) system components, such as a container, a power inverter, ultracapacitors, a cooling system, a fuel storage system, a system controller, and data acquisition equipment.
Estimating the fuel cell generator market size involves aggregating the revenues generated by global companies manufacturing fuel cell generators. While estimating the market size, we have considered the costs associated with the system and the balance of plant components.
Stakeholders
- Ceramic and electrolyte manufacturers
- Consulting companies in the energy & power sector
- Environmental research institutes
- Fuel cell and stack manufacturers
- Government and research organizations
- Institutional investors/shareholders
- Power and energy associations
- Repair and maintenance service providers
- Fuel cell technology manufacturing companies
- Organizations, forums, alliances, and associations
- Research and consulting companies in the clean energy generation sector
- State and national regulatory authorities
Report Objectives
- To define, describe, segment, and forecast the fuel cell generator market by size and fuel type, in terms of value
- To define, describe, segment, and forecast the fuel cell generator market by end user and region, in terms of value and volume
- To forecast the market size across North America, Europe, Asia Pacific, and Rest of the World (RoW), in terms of value
- To provide detailed information regarding key drivers, restraints, opportunities, and challenges influencing the growth of the fuel cell generator market
- To provide the supply chain analysis, trends/disruptions impacting customer business, ecosystem analysis, regulatory landscape, patent analysis, case study analysis, technology analysis, key conferences & events, the impact of AI/Gen AI, macroeconomic outlook, pricing analysis, porter’s five forces analysis, and regulatory analysis, the impact of 2025 US tariff on the market
- To analyze opportunities for stakeholders in the fuel cell generator market and draw a competitive landscape of the market
- To strategically analyze the fuel cell generator market with respect to individual growth trends, prospects, and contributions of each segment to the market
- To benchmark market players using the company evaluation matrix, which analyzes market players on broad categories of business and product strategies adopted by them
- To compare key market players for the market share, product specifications, and applications
- To strategically profile key players and comprehensively analyze their market ranking and core competencies
- To analyze competitive developments, such as contracts, agreements, partnerships, and joint ventures, in the fuel cell generator market
Available Customizations
MarketsandMarkets offers customizations according to the specific needs of the companies with the given market data.
The following customization options are available for the report:
Product Analysis
- Product matrix, which gives a detailed comparison of the product portfolio of each company
Geographic Analysis as per Feasibility
- Further breakdown of the fuel cell generator market within Europe, Asia Pacific, North America, and Rest of the World
Company Information
- Detailed analysis and profiling of additional market players (up to five)
Key Questions Addressed by the Report
What is the current size of the fuel cell generator market?
The current market size of the fuel cell generator market is USD 0.63 billion in 2025.
What are the major drivers for the fuel cell generator market?
Major drivers for the fuel cell generator market include rising demand for clean energy, grid-independent power solutions, supportive government policies, advancements in hydrogen infrastructure, and growing industrial decarbonization efforts globally.
Which is the largest market for the fuel cell generator market during the forecast period?
North America is expected to be the largest market for fuel cell generators during the forecast period, driven by strong government support, advanced hydrogen infrastructure, and rising demand for clean, reliable backup power across key industries.
Which is expected to be the largest market by solutions of the fuel cell generator market during the forecast period?
The Small Scale (up to 200 kW) segment is expected to be the largest market by size in the fuel cell generator market during the forecast period, owing to its flexibility, easy deployment, and wide application across residential, commercial, and remote areas.
What are the major market players covered in the report?
Some of the key companies in the fuel cell generator market are Bloom Energy (US), PowerCell Sweden AB (Sweden), Nedstack Fuel Cell Technology (Netherlands), Ballard Power Systems (US), Plug Power Inc. (US), Doosan Fuel Cell Co., Ltd. (South Korea), zepp.solutions B.V. (Netherlands), and ABB (Switzerland).
Need a Tailored Report?
Customize this report to your needs
Get 10% FREE Customization
Customize This ReportPersonalize This Research
- Triangulate with your Own Data
- Get Data as per your Format and Definition
- Gain a Deeper Dive on a Specific Application, Geography, Customer or Competitor
- Any level of Personalization
Let Us Help You
- What are the Known and Unknown Adjacencies Impacting the Fuel Cell Generator Market
- What will your New Revenue Sources be?
- Who will be your Top Customer; what will make them switch?
- Defend your Market Share or Win Competitors
- Get a Scorecard for Target Partners

Custom Market Research Services
We Will Customise The Research For You, In Case The Report Listed Above Does Not Meet With Your Requirements
Get 10% Free CustomisationTESTIMONIALS

Kimberly Murphy
GLOBAL MARKETING DIRECTOR
Bently Nevada,
Leading Condition Monitoring & Asset Protectionwww.bakerhughesds.com/bently-nevada

MarketsandMarkets™ showed consistent rigor for success and relentlessly worked with Bently Nevada stakeholders to positively impact go-to-market strategy. Their proactiveness and flexibility has been instrumental in achieving the objectives to grow our sales pipeline in key industrial markets.

DARRICK HUEBER
Business Development Leader
Nexus Controls LLC,
Leading Manufacturer of Automation System & Electrical Panelswww.bakerhughesds.com/nexus-controls

We partnered with MarketsandMarkets to expand our business further by tapping into new industrial segments. It was critical for us to gather crucial business insights about specific markets to achieve this goal. MarketsandMarkets engagement model and client services helped us provide those insights, it was really impressive and valuable for my business. The team was extremely flexible and helpful.

Mike Schoff
Global Industrial Commercial Strategy Leader
Nexus Controls LLC
Leading Manufacturer of Automation System & Electrical Panelswww.bakerhughesds.com/nexus-controls
We consulted MarketsandMarkets for potential Partner Identification. Overall, it was a good experience. The insights provided through interviews conducted by the team helped us put together the questionnaire required for discussion with the selected partners. Their ability to provide insights through interviews with customers in a timely manner was quite impressive.


Growth opportunities and latent adjacency in Fuel Cell Generator Market