Pet Food Ingredients Market by Ingredient (Meat & Meat Products, Cereals, Vegetables & Fruits, Fats, and Additives), Source (Animal-based, Plant Derivatives, and Synthetic), Pet (Dogs, Cats, and Fish), Form and Region - Global Forecast to 2027
From 2022 to 2027, the global pet food ingredients market is expected to rise at a remarkable compound annual growth rate (CAGR) of 6.7%. This rising trend is expected to boost market value from $32.2 billion in 2022 to $44.5 billion by the end of 2027. The fast adoption of pets, as well as rising and emerging concern about their health and well-being, are predicted to fuel the increasing need for pet food ingredients.
To know about the assumptions considered for the study, Request for Free Sample Report
Pet food ingredients are included in pet food products to enhance their nutritional content and enable the pet animals to meet their nutritional requirements of proteins, carbohydrates, fats, vitamins, minerals and water. They cater to a range of pet animals such as dogs, cats, fish and other pets such as rabbits, birds and horses. The pet food ingredients are also gaining significant traction in the industry with the increasing consciousness regarding pet nutrition among owners and rising pet humanization trend which has contributed towards increased spending on health focused pet food ingredients.
Pet food ingredients support the growth and development of pet animals, provide a rich source of vitamins and minerals that the pet animals cannot make in their bodies and also enhance the palatability of pet animals due to which they are in significant demand among the pet owners. Furthermore, the increasing pet adoption rates around the world and technological advancements, that have significantly contributed towards the enhancement of quality and shelf life of pet food ingredients in recent years, are likely to present significant business opportunities for pet food ingredients market over the forecasted period.
Pet Food Ingredients Market Dynamics
Drivers: Switch from mass products to organic pet food ingredients
According to APPA, in the pet industry, the spending on pet food is around one-third of the total spending. In 2016, around USD 8.2 billion was spent in the US on organic food products. According to an article published in the UK on dog food, the volume of pet food sold has declined by 3%, whereas the value has increased by 2%, stressing on the fact that pet owners are moving toward organic and premium products. Also, there is a rising interest among US pet owners for natural, locally-sourced treats, and chews, which has also led to the increased sales of organic pet food ingredients. Additionally, an increase in obesity among pets has encouraged pet owners to demand organic, clean, and protein-rich food products.
Restraints: Limited availability of ingredients and price sensitivity
An increase in the cost of production and a rise in raw material prices have resulted in a rise in the prices of pet food ingredients. For instance, BASF increased the price of its feed grade vitamin E & A by 15% and 10%, respectively, in 2013 and again by 20% for vitamin A in 2016. Vitamins and several other pet food ingredients face the problem of raw material availability, resulting in a price increase. This high price stands to be one of the biggest limitations for the growth in sales of pet food ingredients. Thus, the scarcity of raw materials is one of the restraining factors in the pet food ingredients market. Pet food ingredients are also obtained from plant sources. Climate change also affects the supply of raw materials, which, in turn, increases their prices.
Opportunities: Shift in focus toward natural and grain-free products
The rising trend of pet humanization has led to an increase in spending on premium pet food products by pet owners. They are consistently demanding pet food that adds value to the diets of pets and enhances their growth and development. Therefore, the demand for natural and grain-free extruded pet food products has been growing remarkably over the last few years, as they provide various health benefits and aid in the healthier growth of animals. For instance, according to the Pet Industry Distributors Association, natural pet food sales grew from USD 3.6 billion in 2011 to USD 5.4 billion in 2015. Growth in demand for natural and grain-free pet food products has created new opportunities for pet food ingredient manufacturers. Focusing on product innovation and the introduction of natural and grain-free pet food ingredients will enable companies operating in the pet food ingredients market to improve their profits.
Challenges: Threat from counterfeit products
In recent years, there has been tremendous growth in the pet food market. However, counterfeit products have emerged as a problem for the industry in recent years. Counterfeit products are dangerous to the health of pets. This counterfeit practice is negatively affecting the market and the health of pets; further, the revenue generated from these products is unknown. The industry has to deal with these products, as they serve as a threat to the growth of the extruded pet food industry. For instance, in 2015, Champion Pet Foods, one of the prominent players in the pet food industry, announced that counterfeit versions of its pet food were being sold online. Such false practices may impact the overall health of pets as well as hamper the growth of the pet food and pet food ingredients industry.
By ingredient, the vegetables & fruits segment is projected to witness the fastest growth rate during the forecast period.
Based on ingredient, the vegetables & fruits segment account for the fastest-growing segment in the pet food ingredients market. Vegetables & fruits are rich sources of dietary fiber, which promotes the digestive health of pet animals. They also possess anti-inflammatory properties that help in the prevention and relief of common inflammations in pet animals. Along with this, the rising trend of veganism is further contributing to the growth of this segment as pet owners are demanding more of plant-derived pet food ingredients.
The dog segment is projected to account for the largest market share in the pet food ingredients market
Based on pet, the dogs segment is projected to account for the largest market share in the pet food ingredients market. Dogs are the most popular pets, with a healthy adoption rate globally. A wide variety of pet food ingredients composed of plant derivatives and animal-based ingredients are needed to meet the nutritional requirements of dogs. Pet food ingredients such as colors and flavors are also used extensively in dog food products to enhance their palatability and feed intake. The high applicability of pet food ingredients in dog food is expected to drive the growth of this segment.
By source, the plant derivatives segment accounts for the second-largest market share in the pet food ingredients market
By source, the plant derivatives segment accounts for the second-largest share in the pet food ingredients market. The rising trend of veganism and the adoption of more plant-based ingredients in the diets of pet animals have contributed to the growth of plant-derived ingredients in the pet food ingredients industry, due to which they account for the fastest-growing sources of pet food ingredients. The plant-derived pet food ingredients also offer a rich source of protein, omega-6 fatty acids, antioxidants, vitamin B, fibers, and minerals.
By form, wet segment is projected to witness a significant growth rate during the forecast period.
Based on form, wet pet food ingredients account for the second-fastest growing segment in the pet food ingredients market. The wet pet food ingredients offer enhanced palatability of pet food products and thus have a high acceptability rate among pet animals. Wet pet food ingredients are also effective in enhancing the overall shelf-life of pet food products, due to the presence of a significant number of antioxidants and preservatives, which contributes to their demand and market growth in the industry.
To know about the assumptions considered for the study, download the pdf brochure
Asia Pacific accounted for the fastest-growing region for the pet food ingredients market. The Asia Pacific pet food ingredients market is driven by the rising pet population and rising demand for pet food. Developing countries such as China and India have a significant population of pets. Factors such as emerging economies, a rising middle-class population, and a rise in awareness regarding the health and well-being of animals, have further contributed to the adoption of pet animals in the region.
Pet Food Ingredients Market Key Players:
Key players in this market include BASF SE (Germany), Darling Ingredients Inc. (US), Cargill (US), Ingredion (US), DSM (Netherlands), Omega Protein Corporation (US), ADM (US), Kemin Industries, Inc. (US), Chr. Hansen Holding A/S (Denmark) and Roquette Frères (France).
Scope of the Pet Food Ingredients Market Report
Report Metric |
Details |
Market worth in 2022 |
USD 32.2 billion |
Revenue estimate in 2027 |
USD 44.5 billion |
Growth rate |
CAGR of 6.7% from 2022-2027 |
Market size available for years |
2019-2027 |
Base year for estimation |
2021 |
Forecast period |
2022-2027 |
Quantitative units |
Value (USD Million) and Volume (Thousand Units) |
Report Coverage & Deliverables |
Revenue forecast, company ranking, driving factors, Competitive benchmarking, and analysis |
Segments covered |
Pet, Ingredient, Source |
Regional Insight |
Europe, North America, South America, Asia Pacific |
Top companies evaluated |
BASF SE (Germany), Darling Ingredients Inc. (US), Cargill (US), Ingredion (US), DSM (Netherlands), Omega Protein Corporation (US), ADM (US), Kemin Industries, Inc. (US), Chr. Hansen Holding A/S (Denmark) and Roquette Frères (France) |
Report Highlights |
The latest version of the report includes the value chain analysis, supply chain analysis, technology analysis, Average Selling Price (ASP) trends, ecosystem mapping, case studies, key stakeholders, trade analysis, patent analysis, Porter’s five forces analysis, regulatory framework, and buying criteria, which have been added to the industry trends chapter. |
Target Audience:
- Key manufacturers of animal nutrition products
- Key companies engaged in pet food processing
- Key manufacturers of pet food ingredients
- Traders, distributors, and suppliers in the pet food ingredient market
- Traders and suppliers of raw materials to the pet food ingredient industry
- Related government authorities, commercial R&D institutions, and other regulatory bodies
- The Association of American Feed Control Officials (AAFCO)
- Pet Food Manufacturers Association (PFMA)
- The Pet Food Industry Association of Australia
- American Pet Products Association, Inc. (APPA)
- Canadian Association of Raw Pet Food Manufacturers
This research report categorizes the pet food ingredients market based on form, ingredient, source, pet, nature and region
Aspect |
Details |
By Ingredient |
|
By Form |
|
By Source |
|
By Pet |
|
By Region |
|
Pet Food Ingredients Market Report Recent Developments
- In July 2022, BASF SE (Germany) announced plans to expand its vitamin A formulation plant for animal nutrition. With this strategic initiative, the company intended to consolidate its market position as a market leader in the industry.
- In June 2022, DSM (Netherlands) acquired Prodap (Brazil), one of Brazil’s leading animal nutrition technologies, to enhance its R&D and technological capabilities in the animal nutrition industry. This acquisition would also enable access to more markets on a global scale and cater to a larger customer base.
- In May 2022, Darling Ingredients Inc. (US) completed the acquisition of Valley Proteins (US), a leading producer of animal-based fats and by-product meals, based in the US. This strategic initiative was intended to strengthen the product portfolio of the company and cater efficiently to the rising demand in the industry.
- In February 2021, Cargill (US) launched a new range of by-product meals namely, The Chompery, that specifically caters to companion animals such as dogs and is a dog treat that contains bones, ribs, windpipes, and jerkies.
Frequently Asked Questions (FAQ):
How big is the pet food ingredients market?
The global pet food ingredients market is expected to be worth $32.2 billion in 2022 and $44.5 billion by the end of 2027, with a CAGR of 6.7% from 2022 to 2027.
What is the estimated growth rate (CAGR) of the global pet food ingredients market for the next five years?
The global pet food ingredients market is set to grow at a moderate rate, representing a CAGR of 6.7% during the forecast period.
What are the major revenue pockets in the pet food ingredients market currently?
Asia Pacific accounted for the fastest-growing region for the pet food ingredients market. The Asia Pacific pet food ingredients market is driven by the rising pet population and rising demand for pet food. Developing countries such as China and India have a significant population of pets. Factors such as emerging economies, a rising middle-class population, and a rise in awareness regarding the health and well-being of animals, have further contributed to the adoption of pet animals in the region.
Is pet food business profitable?
Yes, the pet food business can be profitable. The pet industry, including the pet food sector, has experienced significant growth in recent years. Many people consider their pets to be members of the family and are willing to invest in their health and well-being, including their diet. Pet ownership is increasing, and pet owners are increasingly aware of the importance of providing high-quality and specialized food for their pets. As a result, the demand for pet food continues to rise.
What are the ingredients in the pet food industry?
The pet food industry uses a range of ingredients to create their products. Common ingredients include meat and animal products, grains and cereals, vegetables and fruits, fats and oils, vitamins and minerals, flavorings and additives, and sometimes supplements. The specific ingredients used can vary among brands and products, depending on nutritional goals and target animals.
To speak to our analyst for a discussion on the above findings, click Speak to Analyst
TABLE OF CONTENTS
1 INTRODUCTION (Page No. - 40)
1.1 STUDY OBJECTIVES
1.2 MARKET DEFINITION
1.3 STUDY SCOPE
FIGURE 1 MARKET SEGMENTATION
1.3.1 INCLUSIONS AND EXCLUSIONS
1.3.2 REGIONS COVERED
1.3.3 YEARS CONSIDERED
1.4 CURRENCY CONSIDERED
TABLE 1 USD EXCHANGE RATES CONSIDERED, 2018–2021
1.5 UNIT CONSIDERED
1.6 STAKEHOLDERS
1.7 SUMMARY OF CHANGES
2 RESEARCH METHODOLOGY (Page No. - 45)
2.1 RESEARCH DATA
FIGURE 2 RESEARCH DESIGN
2.1.1 SECONDARY DATA
2.1.1.1 Key data from secondary sources
2.1.2 PRIMARY DATA
2.1.2.1 Key data from primary sources
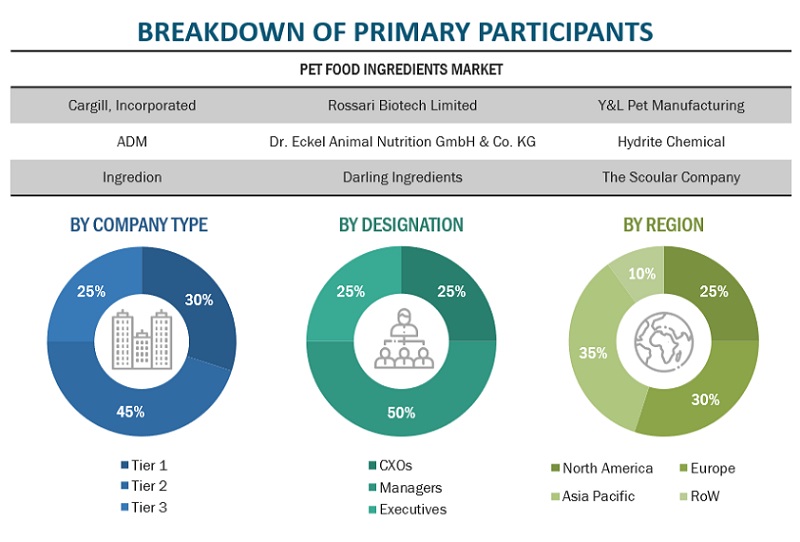
2.1.2.2 Breakdown of primaries
2.1.2.3 Key primary insights
2.2 MARKET SIZE ESTIMATION
2.2.1 APPROACH ONE – BOTTOM-UP (BASED ON INGREDIENT, BY REGION)
2.2.2 APPROACH TWO – TOP-DOWN (BASED ON GLOBAL MARKET)
2.3 DATA TRIANGULATION
FIGURE 3 DATA TRIANGULATION METHODOLOGY
2.4 ASSUMPTIONS
2.5 LIMITATIONS AND RISK ASSESSMENT
3 EXECUTIVE SUMMARY (Page No. - 53)
TABLE 2 PET FOOD INGREDIENTS MARKET SNAPSHOT, 2022 VS. 2027
FIGURE 4 MARKET FOR PET FOOD INGREDIENTS, BY INGREDIENT, 2022 VS. 2027 (USD MILLION)
FIGURE 5 MARKET FOR PET FOOD INGREDIENTS, BY PET, 2022 VS. 2027 (USD MILLION)
FIGURE 6 MARKET FOR PET FOOD INGREDIENTS, BY FORM, 2022 VS. 2027 (USD MILLION)
FIGURE 7 MARKET FOR PET FOOD INGREDIENTS, BY SOURCE, 2022 VS. 2027 (USD MILLION)
FIGURE 8 PET FOOD INGREDIENT MARKET SHARE AND GROWTH RATE (VALUE), BY REGION
4 PREMIUM INSIGHTS (Page No. - 58)
4.1 ATTRACTIVE OPPORTUNITIES FOR KEY PLAYERS
FIGURE 9 INCREASING ADOPTION OF PETS AND RISING PET HUMANIZATION TREND TO PROPEL GROWTH
4.2 NORTH AMERICA: PET FOOD INGREDIENTS MARKET, BY SOURCE AND COUNTRY
FIGURE 10 US AND ANIMAL-BASED ACCOUNTED FOR THE LARGEST SHARES IN NORTH AMERICAN MARKET IN 2021
4.3 MARKET FOR PET FOOD INGREDIENTS, BY PET
FIGURE 11 DOGS SEGMENT TO DOMINATE DURING FORECAST PERIOD
4.4 MARKET FOR PET FOOD INGREDIENTS, BY FORM
FIGURE 12 DRY SEGMENT TO DOMINATE DURING FORECAST PERIOD
4.5 MARKET FOR PET FOOD INGREDIENTS, BY SOURCE AND REGION
FIGURE 13 NORTH AMERICA TO DOMINATE DURING FORECAST PERIOD
4.6 MARKET FOR PET FOOD INGREDIENTS, BY INGREDIENT
FIGURE 14 MEAT & MEAT PRODUCTS TO DOMINATE DURING FORECAST PERIOD
5 MARKET OVERVIEW (Page No. - 62)
5.1 INTRODUCTION
5.1.1 MACROECONOMIC FACTORS
5.1.1.1 Rising pet adoption among urban population
5.1.1.2 Increasing trend of pet humanization to drive demand for premium pet products
FIGURE 15 INCREASE IN PERCENTAGE OF PET OWNERS GIVING TREATS, BY PET TYPE, 2018 VS. 2022
5.2 MARKET DYNAMICS
FIGURE 16 PET FOOD INGREDIENTS MARKET DYNAMICS
5.2.1 DRIVERS
5.2.1.1 Increase in pet expenditure with substantial rise in pet food expenditure
FIGURE 17 US PET INDUSTRY EXPENDITURE, 2012-2021 (USD BILLION)
5.2.1.2 Switch from mass products to organic pet food ingredients
5.2.1.3 Acceptance of insect-based protein and oils by pet owners
5.2.2 RESTRAINTS
5.2.2.1 Non-uniformity of regulations hindering international trade
5.2.2.2 Limited availability of ingredients and price sensitivity
5.2.3 OPPORTUNITIES
5.2.3.1 Use of cannabis in pet food
5.2.3.2 Technological advancements to enhance product development
5.2.3.3 Shift in focus toward natural and grain-free products
FIGURE 18 NATURAL PET FOOD PRODUCT SALES IN THE US
5.2.4 CHALLENGES
5.2.4.1 Capital investment for equipment
5.2.4.2 Threat from counterfeit products
6 INDUSTRY TRENDS (Page No. - 69)
6.1 INTRODUCTION
6.2 VALUE CHAIN
6.2.1 RESEARCH AND PRODUCT DEVELOPMENT
6.2.2 RAW MATERIAL SOURCING
6.2.3 PRODUCTION AND PROCESSING
6.2.4 DISTRIBUTION
6.2.5 MARKETING & SALES
FIGURE 19 VALUE CHAIN ANALYSIS OF PET FOOD INGREDIENTS MARKET
6.3 SUPPLY CHAIN ANALYSIS
FIGURE 20 MARKET FOR PET FOOD INGREDIENTS: SUPPLY CHAIN
6.4 TECHNOLOGY ANALYSIS
6.4.1 NEXT-GENERATION PROTEIN FOR PET FOOD INGREDIENTS
6.5 PRICE ANALYSIS: MARKET FOR PET FOOD INGREDIENTS
6.5.1 AVERAGE SELLING PRICE, BY TYPE
FIGURE 21 GLOBAL AVERAGE SELLING PRICE, BY INGREDIENT
TABLE 3 MEAT & MEAT PRODUCTS: AVERAGE SELLING PRICE (ASP), BY REGION, 2020–2022 (USD/TON)
TABLE 4 CEREALS: AVERAGE SELLING PRICE (ASP), BY REGION, 2020–2022 (USD/TON)
TABLE 5 VEGETABLES & FRUITS: AVERAGE SELLING PRICE (ASP), BY REGION, 2020–2022 (USD/TON)
6.6 MARKET MAPPING AND ECOSYSTEM OF PET FOOD INGREDIENT MARKET
6.6.1 DEMAND SIDE
6.6.2 SUPPLY SIDE
FIGURE 22 PET FOOD INGREDIENT MARKET MAP
FIGURE 23 PET FOOD INGREDIENTS ECOSYSTEM MAPPING
TABLE 6 PET FOOD INGREDIENT MARKET: SUPPLY CHAIN (ECOSYSTEM)
6.7 TRENDS/DISRUPTIONS IMPACTING CUSTOMER’S BUSINESS
FIGURE 24 REVENUE SHIFT FOR PET FOOD INGREDIENT MARKET
6.8 PET FOOD INGREDIENT MARKET: PATENT ANALYSIS
FIGURE 25 NUMBER OF PATENTS GRANTED BETWEEN 2012 AND 2021
FIGURE 26 TOP 10 INVENTORS WITH HIGHEST NUMBER OF PATENT DOCUMENTS
FIGURE 27 LEADING APPLICANTS WITH HIGHEST NUMBER OF PATENT DOCUMENTS
TABLE 7 PATENTS PERTAINING TO PET FOOD INGREDIENTS, 2020–2022
6.9 TRADE DATA: PET FOOD INGREDIENT MARKET
6.9.1 2021: PET FOOD INGREDIENTS
TABLE 8 TOP 10 IMPORTERS AND EXPORTERS OF DOG OR CAT FOOD, 2021 (KG)
6.10 PORTER’S FIVE FORCES ANALYSIS
TABLE 9 PET FOOD INGREDIENT MARKET: PORTER’S FIVE FORCES ANALYSIS
6.10.1 DEGREE OF COMPETITION
6.10.2 BARGAINING POWER OF SUPPLIERS
6.10.3 BARGAINING POWER OF BUYERS
6.10.4 THREAT OF SUBSTITUTES
6.10.5 THREAT OF NEW ENTRANTS
6.11 CASE STUDIES
6.11.1 ADM: PET FOOD INGREDIENTS FOR DOGS AND CATS
6.12 KEY CONFERENCES & EVENTS
TABLE 10 KEY CONFERENCES & EVENTS IN PET FOOD INGREDIENTS MARKET, 2022–2023
6.13 TARIFF & REGULATORY LANDSCAPE
TABLE 11 NORTH AMERICA: LIST OF REGULATORY BODIES, GOVERNMENT AGENCIES, AND OTHER ORGANIZATIONS
TABLE 12 EUROPE: LIST OF REGULATORY BODIES, GOVERNMENT AGENCIES, AND OTHER ORGANIZATIONS
TABLE 13 ASIA PACIFIC: LIST OF REGULATORY BODIES, GOVERNMENT AGENCIES, AND OTHER ORGANIZATIONS
6.13.1 NORTH AMERICA
6.13.1.1 US FDA
6.13.1.2 Association of American Feed Control Officials (AAFCO)
6.13.2 EUROPEAN UNION (EU)
6.13.3 ASIA PACIFIC
6.13.3.1 China
6.13.3.2 Japan
6.13.3.3 India
6.13.4 SOUTH AFRICA
6.13.5 INTERNATIONAL FEED INDUSTRY FEDERATION (IFIF)
6.14 KEY STAKEHOLDERS AND BUYING CRITERIA
FIGURE 28 INFLUENCE OF STAKEHOLDERS IN BUYING PROCESS FOR TOP THREE INGREDIENTS
6.14.1 KEY STAKEHOLDERS IN BUYING PROCESS
TABLE 14 INFLUENCE OF STAKEHOLDERS IN BUYING PROCESS FOR TOP THREE INGREDIENTS
6.14.2 BUYING CRITERIA
TABLE 15 KEY CRITERIA FOR SELECTING SUPPLIERS/VENDORS
FIGURE 29 KEY CRITERIA FOR SELECTING SUPPLIERS/VENDORS
7 PET FOOD INGREDIENTS MARKET, BY INGREDIENT (Page No. - 88)
7.1 INTRODUCTION
FIGURE 30 PET FOOD INGREDIENTS MARKET (VALUE), BY INGREDIENT, 2022 VS. 2027
TABLE 16 PET FOOD INGREDIENT MARKET, BY INGREDIENT, 2019–2021 (USD MILLION)
TABLE 17 PET FOOD INGREDIENT MARKET, BY INGREDIENT, 2022–2027 (USD MILLION)
TABLE 18 PET FOOD INGREDIENT MARKET, BY INGREDIENT, 2019–2021 (KT)
TABLE 19 PET FOOD INGREDIENT MARKET, BY INGREDIENT, 2022–2027 (KT)
7.2 MEAT & MEAT PRODUCTS
7.2.1 ADDED HEALTH BENEFITS AND MULTIFUNCTIONALITY OF MEAT & MEAT PRODUCTS
TABLE 20 MEAT & MEAT PRODUCTS: PET FOOD INGREDIENTS MARKET, BY REGION, 2019–2021 (USD MILLION)
TABLE 21 MEAT & MEAT PRODUCTS: MARKET FOR PET FOOD INGREDIENTS, BY REGION, 2022–2027 (USD MILLION)
TABLE 22 MEAT & MEAT PRODUCTS: MARKET FOR PET FOOD INGREDIENTS, BY REGION, 2019–2021 (KT)
TABLE 23 MEAT & MEAT PRODUCTS: MARKET FOR PET FOOD INGREDIENTS, BY REGION, 2022–2027 (KT)
TABLE 24 MEAT & MEAT PRODUCTS: MARKET FOR PET FOOD INGREDIENTS, BY SUBTYPE, 2019–2021 (USD MILLION)
TABLE 25 MEAT & MEAT PRODUCTS: MARKET FOR PET FOOD INGREDIENTS, BY SUBTYPE, 2022–2027 (USD MILLION)
7.2.2 DEBONED MEAT
TABLE 26 DEBONED MEAT: PET FOOD INGREDIENT MARKET, BY REGION, 2019–2021 (USD MILLION)
TABLE 27 DEBONED MEAT: MARKET FOR PET FOOD INGREDIENTS, BY REGION, 2022–2027 (USD MILLION)
7.2.3 MEAT MEAL
TABLE 28 MEAT MEAL: PET FOOD INGREDIENT MARKET, BY REGION, 2019–2021 (USD MILLION)
TABLE 29 MEAT MEAL: MARKET FOR PET FOOD INGREDIENTS, BY REGION, 2022–2027 (USD MILLION)
7.2.4 BY-PRODUCT MEAL
TABLE 30 BY-PRODUCT MEAL: PET FOOD INGREDIENT MARKET, BY REGION, 2019–2021 (USD MILLION)
TABLE 31 BY-PRODUCT MEAL: MARKET FOR PET FOOD INGREDIENTS, BY REGION, 2022–2027 (USD MILLION)
7.2.5 ANIMAL DIGEST
TABLE 32 ANIMAL DIGEST: PET FOOD INGREDIENT MARKET, BY REGION, 2019–2021 (USD MILLION)
TABLE 33 ANIMAL DIGEST: MARKET FOR PET FOOD INGREDIENTS, BY REGION, 2022–2027 (USD MILLION)
7.3 CEREALS
7.3.1 RICH CARBOHYDRATE CONTENT AND ENERGY-BOOSTING PROPERTIES
TABLE 34 CEREALS: PET FOOD INGREDIENTS MARKET, BY REGION, 2019–2021 (USD MILLION)
TABLE 35 CEREALS: MARKET FOR PET FOOD INGREDIENTS, BY REGION, 2022–2027 (USD MILLION)
TABLE 36 CEREALS: MARKET FOR PET FOOD INGREDIENTS, BY REGION, 2019–2021 (KT)
TABLE 37 CEREALS: MARKET FOR PET FOOD INGREDIENTS, BY REGION, 2022–2027 (KT)
TABLE 38 CEREALS: MARKET FOR PET FOOD INGREDIENTS, BY TYPE, 2019–2021 (USD MILLION)
TABLE 39 CEREALS: MARKET FOR PET FOOD INGREDIENTS, BY TYPE, 2022–2027 (USD MILLION)
7.3.2 CORN & CORNMEAL
TABLE 40 CORN & CORNMEAL: PET FOOD INGREDIENT MARKET, BY REGION, 2019–2021 (USD MILLION)
TABLE 41 CORN & CORNMEAL: MARKET FOR PET FOOD INGREDIENTS, BY REGION, 2022–2027 (USD MILLION)
7.3.3 WHEAT & WHEATMEAL
TABLE 42 WHEAT & WHEATMEAL: PET FOOD INGREDIENT MARKET, BY REGION, 2019–2021 (USD MILLION)
TABLE 43 WHEAT & WHEATMEAL: MARKET FOR PET FOOD INGREDIENTS, BY REGION, 2022–2027 (USD MILLION)
7.3.4 BARLEY
TABLE 44 BARLEY: PET FOOD INGREDIENTS MARKET, BY REGION, 2019–2021 (USD MILLION)
TABLE 45 BARLEY: MARKET FOR PET FOOD INGREDIENTS, BY REGION, 2022–2027 (USD MILLION)
7.3.5 RICE
TABLE 46 RICE: MARKET FOR PET FOOD INGREDIENTS, BY REGION, 2019–2021 (USD MILLION)
TABLE 47 RICE: MARKET FOR PET FOOD INGREDIENTS, BY REGION, 2022–2027 (USD MILLION)
7.4 VEGETABLES & FRUITS
7.4.1 BENEFITS TO DIGESTIVE HEALTH AND ASSURANCE OF OPTIMAL NUTRITION
TABLE 48 VEGETABLES & FRUITS: PET FOOD INGREDIENTS MARKET, BY REGION, 2019–2021 (USD MILLION)
TABLE 49 VEGETABLES & FRUITS: MARKET FOR PET FOOD INGREDIENTS, BY REGION, 2022–2027 (USD MILLION)
TABLE 50 VEGETABLES & FRUITS: MARKET FOR PET FOOD INGREDIENTS, BY REGION, 2019–2021 (KT)
TABLE 51 VEGETABLES & FRUITS: MARKET FOR PET FOOD INGREDIENTS, BY REGION, 2022–2027 (KT)
TABLE 52 VEGETABLES & FRUITS: MARKET FOR PET FOOD INGREDIENTS, BY SUBTYPE, 2019–2021 (USD MILLION)
TABLE 53 VEGETABLES & FRUITS: MARKET FOR PET FOOD INGREDIENTS, BY SUBTYPE, 2022–2027 (USD MILLION)
7.4.2 FRUITS
TABLE 54 FRUITS:MARKET FOR PET FOOD INGREDIENTS, BY REGION, 2019–2021 (USD MILLION)
TABLE 55 FRUITS: MARKET FOR PET FOOD INGREDIENTS, BY REGION, 2022–2027 (USD MILLION)
7.4.3 POTATOES
TABLE 56 POTATOES: MARKET FOR PET FOOD INGREDIENTS, BY REGION, 2019–2021 (USD MILLION)
TABLE 57 POTATOES: MARKET FOR PET FOOD INGREDIENTS, BY REGION, 2022–2027 (USD MILLION)
7.4.4 CARROTS
TABLE 58 CARROTS: PET FOOD INGREDIENTS MARKET, BY REGION, 2019–2021 (USD MILLION)
TABLE 59 CARROTS: MARKET FOR PET FOOD INGREDIENTS, BY REGION, 2022–2027 (USD MILLION)
7.4.5 SOY & SOY MEAL
TABLE 60 SOY & SOY MEAL: MARKET FOR PET FOOD INGREDIENTS, BY REGION, 2019–2021 (USD MILLION)
TABLE 61 SOY & SOY MEAL: PET FOOD INGREDIENT MARKET, BY REGION, 2022–2027 (USD MILLION)
7.4.6 PEA
TABLE 62 PEA: MARKET FOR PET FOOD INGREDIENTS, BY REGION, 2019–2021 (USD MILLION)
TABLE 63 PEA: PET FOOD INGREDIENT MARKET, BY REGION, 2022–2027 (USD MILLION)
7.5 FATS
7.5.1 RICH OMEGA-3 FATTY ACID CONTENT AND PROPERTIES OF BOOSTING IMMUNITY AND SKIN HEALTH IN PETS
TABLE 64 FATS: PET FOOD INGREDIENT MARKET, BY REGION, 2019–2021 (USD MILLION)
TABLE 65 FATS: PET FOOD INGREDIENT MARKET, BY REGION, 2022–2027 (USD MILLION)
TABLE 66 FATS: PET FOOD INGREDIENT MARKET, BY REGION, 2019–2021 (KT)
TABLE 67 FATS: PET FOOD INGREDIENT MARKET, BY REGION, 2022–2027 (KT)
TABLE 68 FATS: PET FOOD INGREDIENT MARKET, BY SUBTYPE, 2019–2021 (USD MILLION)
TABLE 69 FATS: PET FOOD INGREDIENT MARKET, BY SUBTYPE, 2022–2027 (USD MILLION)
7.5.2 FISH OIL
TABLE 70 FISH OIL: PET FOOD INGREDIENTS MARKET, BY REGION, 2019–2021 (USD MILLION)
TABLE 71 FISH OIL: PET FOOD INGREDIENT MARKET, BY REGION, 2022–2027 (USD MILLION)
7.5.3 TALLOW
TABLE 72 TALLOW: MARKET FOR PET FOOD INGREDIENTS, BY REGION, 2019–2021 (USD MILLION)
TABLE 73 TALLOW: PET FOOD INGREDIENT MARKET, BY REGION, 2022–2027 (USD MILLION)
7.5.4 LARD
TABLE 74 LARD: PET FOOD INGREDIENTS MARKET, BY REGION, 2019–2021 (USD MILLION)
TABLE 75 LARD: PET FOOD INGREDIENT MARKET, BY REGION, 2022–2027 (USD MILLION)
7.5.5 POULTRY FAT
TABLE 76 POULTRY FAT: PET FOOD INGREDIENTS MARKET, BY REGION, 2019–2021 (USD MILLION)
TABLE 77 POULTRY FAT: PET FOOD INGREDIENT MARKET, BY REGION, 2022–2027 (USD MILLION)
7.5.6 VEGETABLE OIL
TABLE 78 VEGETABLE OIL: PET FOOD INGREDIENTS MARKET, BY REGION, 2019–2021 (USD MILLION)
TABLE 79 VEGETABLE OIL: PET FOOD INGREDIENT MARKET, BY REGION, 2022–2027 (USD MILLION)
7.6 ADDITIVES
7.6.1 RISING FOCUS ON PET WELLNESS AND HEALTH BENEFITS
TABLE 80 ADDITIVES: PET FOOD INGREDIENTS MARKET, BY REGION, 2019–2021 (USD MILLION)
TABLE 81 ADDITIVES: PET FOOD INGREDIENT MARKET, BY REGION, 2022–2027 (USD MILLION)
TABLE 82 ADDITIVES: PET FOOD INGREDIENT MARKET, BY REGION, 2019–2021 (KT)
TABLE 83 ADDITIVES: PET FOOD INGREDIENT MARKET, BY REGION, 2022–2027 (KT)
TABLE 84 ADDITIVES: PET FOOD INGREDIENT MARKET, BY SUBTYPE, 2019–2021 (USD MILLION)
TABLE 85 ADDITIVES: PET FOOD INGREDIENT MARKET, BY SUBTYPE, 2022–2027 (USD MILLION)
7.6.2 VITAMINS & MINERALS
TABLE 86 VITAMINS & MINERALS: PET FOOD INGREDIENTS MARKET, BY REGION, 2019–2021 (USD MILLION)
TABLE 87 VITAMINS & MINERALS: PET FOOD INGREDIENT MARKET, BY REGION, 2022–2027 (USD MILLION)
7.6.3 ENZYMES
TABLE 88 ENZYMES: PET FOOD INGREDIENT MARKET, BY REGION, 2019–2021 (USD MILLION)
TABLE 89 ENZYMES: MARKET FOR PET FOOD INGREDIENTS, BY REGION, 2022–2027 (USD MILLION)
7.6.4 OTHER ADDITIVES
TABLE 90 OTHER ADDITIVES: PET FOOD INGREDIENTS MARKET, BY REGION, 2019–2021 (USD MILLION)
TABLE 91 OTHER ADDITIVES: MARKET FOR PET FOOD INGREDIENTS, BY REGION, 2022–2027 (USD MILLION)
8 PET FOOD INGREDIENTS MARKET, BY PET (Page No. - 122)
8.1 INTRODUCTION
FIGURE 31 PET FOOD INGREDIENTS MARKET (VALUE), BY PET, 2022 VS. 2027
TABLE 92 MARKET FOR PET FOOD INGREDIENTS, BY PET, 2019–2021 (USD MILLION)
TABLE 93 MARKET FOR PET FOOD INGREDIENTS, BY PET, 2022–2027 (USD MILLION)
8.2 DOGS
8.2.1 HIGH ADOPTION RATE PRESENTS ATTRACTIVE MARKET FOR PLAYERS
TABLE 94 DOGS: MARKET FOR PET FOOD INGREDIENTS, BY REGION, 2019–2021 (USD MILLION)
TABLE 95 DOGS: MARKET FOR PET FOOD INGREDIENTS, BY REGION, 2022–2027 (USD MILLION)
8.3 CATS
8.3.1 HIGHER NUTRITIONAL REQUIREMENTS OF CATS
TABLE 96 CATS: PET FOOD INGREDIENTS MARKET, BY REGION, 2019–2021 (USD MILLION)
TABLE 97 CATS: PET FOOD INGREDIENT MARKET, BY REGION, 2022–2027 (USD MILLION)
8.4 FISH
8.4.1 LOWER MAINTENANCE COST AND HIGH ADOPTION RATE
TABLE 98 FISH: PET FOOD INGREDIENTS MARKET, BY REGION, 2019–2021 (USD MILLION)
TABLE 99 FISH: PET FOOD INGREDIENT MARKET, BY REGION, 2022–2027 (USD MILLION)
8.5 OTHER PETS
TABLE 100 OTHER PETS: PET FOOD INGREDIENTS MARKET, BY REGION, 2019–2021 (USD MILLION)
TABLE 101 OTHER PETS: PET FOOD INGREDIENT MARKET, BY REGION, 2022–2027 (USD MILLION)
9 PET FOOD INGREDIENTS MARKET, BY SOURCE (Page No. - 129)
9.1 INTRODUCTION
FIGURE 32 PET FOOD INGREDIENTS MARKET (VALUE), BY SOURCE, 2022 VS. 2027
TABLE 102 PET FOOD INGREDIENT MARKET, BY SOURCE, 2019–2021 (USD MILLION)
TABLE 103 PET FOOD INGREDIENT MARKET, BY SOURCE, 2022–2027 (USD MILLION)
9.2 ANIMAL-BASED
9.2.1 HEALTH ADVANTAGES, HIGHER FEED INTAKE, AND GREATER ACCEPTANCE AMONG PETS
TABLE 104 ANIMAL-BASED: PET FOOD INGREDIENTS MARKET, BY REGION, 2019–2021 (USD MILLION)
TABLE 105 ANIMAL-BASED: PET FOOD INGREDIENT MARKET, BY REGION, 2022–2027 (USD MILLION)
9.3 PLANT DERIVATIVES
9.3.1 RISING TREND OF VEGANISM AND SURGING POPULARITY OF VEGAN PET FOOD PRODUCTS
TABLE 106 PLANT DERIVATIVES: PET FOOD INGREDIENTS MARKET, BY REGION, 2019–2021 (USD MILLION)
TABLE 107 PLANT DERIVATIVES: MARKET FOR PET FOOD INGREDIENTS, BY REGION, 2022–2027 (USD MILLION)
9.4 SYNTHETIC
9.4.1 MULTIFUNCTIONALITY OF SYNTHETIC PET FOOD INGREDIENTS AND RISING FOCUS ON HEALTH AND WELLNESS
TABLE 108 SYNTHETIC: PET FOOD INGREDIENTS MARKET, BY REGION, 2019–2021 (USD MILLION)
TABLE 109 SYNTHETIC: MARKET FOR PET FOOD INGREDIENTS, BY REGION, 2022–2027 (USD MILLION)
10 PET FOOD INGREDIENTS MARKET, BY FORM (Page No. - 135)
10.1 INTRODUCTION
FIGURE 33 PET FOOD INGREDIENTS MARKET (VALUE), BY FORM, 2022 VS. 2027
TABLE 110 MARKET FOR PET FOOD INGREDIENTS, BY FORM, 2019–2021 (USD MILLION)
TABLE 111 MARKET FOR PET FOOD INGREDIENTS, BY FORM, 2022–2027 (USD MILLION)
10.2 DRY
10.2.1 COST-EFFECTIVENESS AND HIGH NUTRIENT CONTENT
TABLE 112 DRY PET FOOD INGREDIENT MARKET, BY REGION, 2019–2021 (USD MILLION)
TABLE 113 DRY PET FOOD INGREDIENT MARKET, BY REGION, 2022–2027 (USD MILLION)
10.3 WET
10.3.1 HIGHER ACCEPTABILITY AMONG PET OWNERS
TABLE 114 WET PET FOOD INGREDIENT MARKET, BY REGION, 2019–2021 (USD MILLION)
TABLE 115 WET PET FOOD INGREDIENT MARKET, BY REGION, 2022–2027 (USD MILLION)
11 PET FOOD INGREDIENTS MARKET, BY NATURE (Page No. - 140)
11.1 INTRODUCTION
11.2 ORGANIC
11.2.1 BENEFITS ASSOCIATED WITH ORGANIC PET FOOD INGREDIENTS IN TERMS OF PET HEALTH AND ENVIRONMENT
11.3 INORGANIC
11.3.1 RISING DEMAND FOR INORGANIC PET FOOD PRODUCTS
12 PET FOOD INGREDIENTS MARKET, BY REGION (Page No. - 142)
12.1 INTRODUCTION
FIGURE 34 CHINA TO RECORD FASTEST GROWTH IN GLOBAL MARKET
TABLE 116 PET FOOD INGREDIENTS MARKET, BY REGION, 2019–2021 (USD MILLION)
TABLE 117 MARKET FOR PET FOOD INGREDIENTS, BY REGION, 2022–2027 (USD MILLION)
TABLE 118 MARKET FOR PET FOOD INGREDIENTS, BY REGION, 2019–2021 (KT)
TABLE 119 MARKET FOR PET FOOD INGREDIENTS, BY REGION, 2022–2027 (KT)
12.2 NORTH AMERICA
FIGURE 35 NORTH AMERICA: REGIONAL SNAPSHOT
TABLE 120 NORTH AMERICA: PET FOOD INGREDIENTS MARKET, BY COUNTRY, 2019–2021 (USD MILLION)
TABLE 121 NORTH AMERICA: MARKET FOR PET FOOD INGREDIENTS, BY COUNTRY, 2022–2027 (USD MILLION)
TABLE 122 NORTH AMERICA: MARKET FOR PET FOOD INGREDIENTS, BY FORM, 2019–2021 (USD MILLION)
TABLE 123 NORTH AMERICA: MARKET FOR PET FOOD INGREDIENTS, BY FORM, 2022–2027 (USD MILLION)
TABLE 124 NORTH AMERICA: MARKET FOR PET FOOD INGREDIENTS, BY PET, 2019–2021 (USD MILLION)
TABLE 125 NORTH AMERICA: MARKET FOR PET FOOD INGREDIENTS, BY PET, 2022–2027 (USD MILLION)
TABLE 126 NORTH AMERICA: MARKET FOR PET FOOD INGREDIENTS, BY INGREDIENT, 2019–2021 (USD MILLION)
TABLE 127 NORTH AMERICA: MARKET FOR PET FOOD INGREDIENTS, BY INGREDIENT, 2022–2027 (USD MILLION)
TABLE 128 NORTH AMERICA: MARKET FOR PET FOOD INGREDIENTS, BY INGREDIENT, 2019–2021 (KT)
TABLE 129 NORTH AMERICA: MARKET FOR PET FOOD INGREDIENTS, BY INGREDIENT, 2022–2027 (KT)
TABLE 130 NORTH AMERICA: PET FOOD INGREDIENT MARKET FOR MEAT & MEAT PRODUCTS, BY SUBTYPE, 2019–2021 (USD MILLION)
TABLE 131 NORTH AMERICA: PET FOOD INGREDIENTS MARKET FOR MEAT & MEAT PRODUCTS, BY SUBTYPE, 2022–2027 (USD MILLION)
TABLE 132 NORTH AMERICA: PET FOOD INGREDIENT MARKET FOR CEREALS, BY SUBTYPE, 2019–2021 (USD MILLION)
TABLE 133 NORTH AMERICA: PET FOOD INGREDIENT MARKET FOR CEREALS, BY SUBTYPE, 2022–2027 (USD MILLION)
TABLE 134 NORTH AMERICA: PET FOOD INGREDIENT MARKET FOR VEGETABLES & FRUITS, BY SUBTYPE, 2019–2021 (USD MILLION)
TABLE 135 NORTH AMERICA: PET FOOD INGREDIENT MARKET FOR VEGETABLES & FRUITS, BY SUBTYPE, 2022–2027 (USD MILLION)
TABLE 136 NORTH AMERICA: PET FOOD INGREDIENT MARKET FOR FATS, BY SUBTYPE, 2019–2021 (USD MILLION)
TABLE 137 NORTH AMERICA: PET FOOD INGREDIENT MARKET FOR FATS, BY SUBTYPE, 2022–2027 (USD MILLION)
TABLE 138 NORTH AMERICA: PET FOOD INGREDIENT MARKET FOR ADDITIVES, BY SUBTYPE, 2019–2021 (USD MILLION)
TABLE 139 NORTH AMERICA: PET FOOD INGREDIENT MARKET FOR ADDITIVES, BY SUBTYPE, 2022–2027 (USD MILLION)
TABLE 140 NORTH AMERICA: PET FOOD INGREDIENTS MARKET, BY SOURCE, 2019–2021 (USD MILLION)
TABLE 141 NORTH AMERICA: MARKET FOR PET FOOD INGREDIENTS, BY SOURCE, 2022–2027 (USD MILLION)
12.2.1 US
12.2.1.1 Rising pet adoption rate to present significant business opportunities for pet food ingredient manufacturers
TABLE 142 US: MARKET FOR PET FOOD INGREDIENTS, BY PET, 2019–2021 (USD MILLION)
TABLE 143 US: MARKET FOR PET FOOD INGREDIENTS, BY PET, 2022–2027 (USD MILLION)
12.2.2 CANADA
12.2.2.1 Increased spending on health-focused pet products
TABLE 144 CANADA: PET FOOD INGREDIENTS MARKET, BY PET, 2019–2021 (USD MILLION)
TABLE 145 CANADA: MARKET FOR PET FOOD INGREDIENTS, BY PET, 2022–2027 (USD MILLION)
12.2.3 MEXICO
12.2.3.1 Large stray dog population coupled with rising awareness about healthier nutrition alternatives for pets
TABLE 146 MEXICO: PET FOOD INGREDIENTS MARKET, BY PET, 2019–2021 (USD MILLION)
TABLE 147 MEXICO: MARKET FOR PET FOOD INGREDIENTS, BY PET, 2022–2027 (USD MILLION)
12.3 EUROPE
TABLE 148 EUROPE: PET FOOD INGREDIENTS MARKET, BY COUNTRY, 2019–2021 (USD MILLION)
TABLE 149 EUROPE: MARKET FOR PET FOOD INGREDIENTS, BY COUNTRY, 2022–2027 (USD MILLION)
TABLE 150 EUROPE: MARKET FOR PET FOOD INGREDIENTS, BY FORM, 2019–2021 (USD MILLION)
TABLE 151 EUROPE: MARKET FOR PET FOOD INGREDIENTS, BY FORM, 2022–2027 (USD MILLION)
TABLE 152 EUROPE: MARKET FOR PET FOOD INGREDIENTS, BY PET, 2019–2021 (USD MILLION)
TABLE 153 EUROPE: MARKET FOR PET FOOD INGREDIENTS, BY PET, 2022–2027 (USD MILLION)
TABLE 154 EUROPE: MARKET FOR PET FOOD INGREDIENTS, BY INGREDIENT, 2019–2021 (USD MILLION)
TABLE 155 EUROPE: MARKET FOR PET FOOD INGREDIENTS, BY INGREDIENT, 2022–2027 (USD MILLION)
TABLE 156 EUROPE: MARKET FOR PET FOOD INGREDIENTS, BY INGREDIENT, 2019–2021 (KT)
TABLE 157 EUROPE: MARKET FOR PET FOOD INGREDIENTS, BY INGREDIENT, 2022–2027 (KT)
TABLE 158 EUROPE: PET FOOD INGREDIENT MARKET FOR MEAT & MEAT PRODUCTS, BY SUBTYPE, 2019–2021 (USD MILLION)
TABLE 159 EUROPE: PET FOOD INGREDIENT MARKET FOR MEAT & MEAT PRODUCTS, BY SUBTYPE, 2022–2027 (USD MILLION)
TABLE 160 EUROPE: PET FOOD INGREDIENT MARKET FOR CEREALS, BY SUBTYPE, 2019–2021 (USD MILLION)
TABLE 161 EUROPE: PET FOOD INGREDIENT MARKET FOR CEREALS, BY SUBTYPE, 2022–2027 (USD MILLION)
TABLE 162 EUROPE: PET FOOD INGREDIENT MARKET FOR VEGETABLES & FRUITS, BY SUBTYPE, 2019–2021 (USD MILLION)
TABLE 163 EUROPE: PET FOOD INGREDIENT MARKET FOR VEGETABLES & FRUITS, BY SUBTYPE, 2022–2027 (USD MILLION)
TABLE 164 EUROPE: PET FOOD INGREDIENT MARKET FOR FATS, BY SUBTYPE, 2019–2021 (USD MILLION)
TABLE 165 EUROPE: PET FOOD INGREDIENT MARKET FOR FATS, BY SUBTYPE, 2022–2027 (USD MILLION)
TABLE 166 EUROPE: PET FOOD INGREDIENTS MARKET FOR ADDITIVES, BY SUBTYPE, 2019–2021 (USD MILLION)
TABLE 167 EUROPE: PET FOOD INGREDIENTS MARKET FOR ADDITIVES, BY SUBTYPE, 2022–2027 (USD MILLION)
TABLE 168 EUROPE: PET FOOD INGREDIENTS MARKET, BY SOURCE, 2019–2021 (USD MILLION)
TABLE 169 EUROPE: PET FOOD INGREDIENT MARKET, BY SOURCE, 2022–2027 (USD MILLION)
12.3.1 GERMANY
12.3.1.1 Rising ownership due to pet humanization and emotional support
TABLE 170 GERMANY: PET FOOD INGREDIENTS MARKET, BY PET, 2019–2021 (USD MILLION)
TABLE 171 GERMANY: PET FOOD INGREDIENT MARKET, BY PET, 2022–2027 (USD MILLION)
12.3.2 RUSSIA
12.3.2.1 Rising demand for industrially prepared pet food
TABLE 172 RUSSIA: PET FOOD INGREDIENTS MARKET, BY PET, 2019–2021 (USD MILLION)
TABLE 173 RUSSIA: PET FOOD INGREDIENT MARKET, BY PET, 2022–2027 (USD MILLION)
12.3.3 UK
12.3.3.1 Large pet population
TABLE 174 UK: PET FOOD INGREDIENTS MARKET, BY PET, 2019–2021 (USD MILLION)
TABLE 175 UK: MARKET FOR PET FOOD INGREDIENTS, BY PET, 2022–2027 (USD MILLION)
12.3.4 FRANCE
12.3.4.1 Increasing demand for premium and health-oriented pet products
TABLE 176 FRANCE: PET FOOD INGREDIENTS MARKET, BY PET, 2019–2021 (USD MILLION)
TABLE 177 FRANCE: MARKET FOR PET FOOD INGREDIENTS, BY PET, 2022–2027 (USD MILLION)
12.3.5 ITALY
12.3.5.1 Large number of pet food manufacturers investing and expanding in country
TABLE 178 ITALY: MARKET FOR PET FOOD INGREDIENTS, BY PET, 2019–2021 (USD MILLION)
TABLE 179 ITALY: MARKET FOR PET FOOD INGREDIENTS, BY PET, 2022–2027 (USD MILLION)
12.3.6 REST OF EUROPE
TABLE 180 REST OF EUROPE: MARKET FOR PET FOOD INGREDIENTS, BY PET, 2019–2021 (USD MILLION)
TABLE 181 REST OF EUROPE: MARKET FOR PET FOOD INGREDIENTS, BY PET, 2022–2027 (USD MILLION)
12.4 ASIA PACIFIC
FIGURE 36 ASIA PACIFIC: REGIONAL SNAPSHOT
TABLE 182 ASIA PACIFIC: PET FOOD INGREDIENTS MARKET, BY COUNTRY, 2019–2021 (USD MILLION)
TABLE 183 ASIA PACIFIC: MARKET FOR PET FOOD INGREDIENTS, BY COUNTRY, 2022–2027 (USD MILLION)
TABLE 184 ASIA PACIFIC: MARKET FOR PET FOOD INGREDIENTS, BY FORM, 2019–2021 (USD MILLION)
TABLE 185 ASIA PACIFIC: MARKET FOR PET FOOD INGREDIENTS, BY FORM, 2022–2027 (USD MILLION)
TABLE 186 ASIA PACIFIC: MARKET FOR PET FOOD INGREDIENTS, BY PET, 2019–2021 (USD MILLION)
TABLE 187 ASIA PACIFIC: MARKET FOR PET FOOD INGREDIENTS, BY PET, 2022–2027 (USD MILLION)
TABLE 188 ASIA PACIFIC: MARKET FOR PET FOOD INGREDIENTS, BY INGREDIENT, 2019–2021 (USD MILLION)
TABLE 189 ASIA PACIFIC: MARKET FOR PET FOOD INGREDIENTS, BY INGREDIENT, 2022–2027 (USD MILLION)
TABLE 190 ASIA PACIFIC: MARKET FOR PET FOOD INGREDIENTS, BY INGREDIENT, 2019–2021 (KT)
TABLE 191 ASIA PACIFIC: MARKET FOR PET FOOD INGREDIENTS, BY INGREDIENT, 2022–2027 (KT)
TABLE 192 ASIA PACIFIC: PET FOOD INGREDIENT MARKET FOR MEAT & MEAT PRODUCTS, BY SUBTYPE, 2019–2021 (USD MILLION)
TABLE 193 ASIA PACIFIC: PET FOOD INGREDIENT MARKET FOR MEAT & MEAT PRODUCTS, BY SUBTYPE, 2022–2027 (USD MILLION)
TABLE 194 ASIA PACIFIC: PET FOOD INGREDIENT MARKET FOR CEREALS, BY SUBTYPE, 2019–2021 (USD MILLION)
TABLE 195 ASIA PACIFIC: PET FOOD INGREDIENT MARKET FOR CEREALS, BY SUBTYPE, 2022–2027 (USD MILLION)
TABLE 196 ASIA PACIFIC: PET FOOD INGREDIENT MARKET FOR VEGETABLES & FRUITS, BY SUBTYPE, 2019–2021 (USD MILLION)
TABLE 197 ASIA PACIFIC: PET FOOD INGREDIENT MARKET FOR VEGETABLES & FRUITS, BY SUBTYPE, 2022–2027 (USD MILLION)
TABLE 198 ASIA PACIFIC: PET FOOD INGREDIENTS MARKET FOR FATS, BY SUBTYPE, 2019–2021 (USD MILLION)
TABLE 199 ASIA PACIFIC: PET FOOD INGREDIENT MARKET FOR FATS, BY SUBTYPE, 2022–2027 (USD MILLION)
TABLE 200 ASIA PACIFIC: PET FOOD INGREDIENTS MARKET FOR ADDITIVES, BY SUBTYPE, 2019–2021 (USD MILLION)
TABLE 201 ASIA PACIFIC: PET FOOD INGREDIENT MARKET FOR ADDITIVES, BY SUBTYPE, 2022–2027 (USD MILLION)
TABLE 202 ASIA PACIFIC: MARKET FOR PET FOOD INGREDIENTS, BY SOURCE, 2019–2021 (USD MILLION)
TABLE 203 ASIA PACIFIC: MARKET FOR PET FOOD INGREDIENTS, BY SOURCE, 2022–2027 (USD MILLION)
12.4.1 CHINA
12.4.1.1 Increased spending on pet nutrition and health
TABLE 204 CHINA: PET FOOD INGREDIENTS MARKET, BY PET, 2019–2021 (USD MILLION)
TABLE 205 CHINA: MARKET FOR PET FOOD INGREDIENTS, BY PET, 2022–2027 (USD MILLION)
12.4.2 JAPAN
12.4.2.1 Increasing focus on protein-rich ingredients and rising focus on health and nutrition of pet animals
TABLE 206 JAPAN: PET FOOD INGREDIENTS MARKET, BY PET, 2019–2021 (USD MILLION)
TABLE 207 JAPAN: MARKET FOR PET FOOD INGREDIENTS, BY PET, 2022–2027 (USD MILLION)
12.4.3 INDIA
12.4.3.1 Emerging middle-class population and improving economic conditions
TABLE 208 INDIA: MARKET FOR PET FOOD INGREDIENTS, BY PET, 2019–2021 (USD MILLION)
TABLE 209 INDIA: MARKET FOR PET FOOD INGREDIENTS, BY PET, 2022–2027 (USD MILLION)
12.4.4 AUSTRALIA & NEW ZEALAND
12.4.4.1 Rising pet adoption rate
TABLE 210 AUSTRALIA & NEW ZEALAND: MARKET FOR PET FOOD INGREDIENTS, BY PET, 2019–2021 (USD MILLION)
TABLE 211 AUSTRALIA & NEW ZEALAND: MARKET FOR PET FOOD INGREDIENTS, BY PET, 2022–2027 (USD MILLION)
12.4.5 REST OF ASIA PACIFIC
TABLE 212 REST OF ASIA PACIFIC: MARKET FOR PET FOOD INGREDIENTS, BY PET, 2019–2021 (USD MILLION)
TABLE 213 REST OF ASIA PACIFIC: MARKET FOR PET FOOD INGREDIENTS, BY PET, 2022–2027 (USD MILLION)
12.5 SOUTH AMERICA
TABLE 214 SOUTH AMERICA: PET FOOD INGREDIENTS MARKET, BY COUNTRY, 2019–2021 (USD MILLION)
TABLE 215 SOUTH AMERICA:MARKET FOR PET FOOD INGREDIENTS, BY COUNTRY, 2022–2027 (USD MILLION)
TABLE 216 SOUTH AMERICA: MARKET FOR PET FOOD INGREDIENTS, BY FORM, 2019–2021 (USD MILLION)
TABLE 217 SOUTH AMERICA: MARKET FOR PET FOOD INGREDIENTS, BY FORM, 2022–2027 (USD MILLION)
TABLE 218 SOUTH AMERICA: MARKET FOR PET FOOD INGREDIENTS, BY PET, 2019–2021 (USD MILLION)
TABLE 219 SOUTH AMERICA:MARKET FOR PET FOOD INGREDIENTS, BY PET, 2022–2027 (USD MILLION)
TABLE 220 SOUTH AMERICA: MARKET FOR PET FOOD INGREDIENTS, BY INGREDIENT, 2019–2021 (USD MILLION)
TABLE 221 SOUTH AMERICA: MARKET FOR PET FOOD INGREDIENTS, BY INGREDIENT, 2022–2027 (USD MILLION)
TABLE 222 SOUTH AMERICA:MARKET FOR PET FOOD INGREDIENTS, BY INGREDIENT, 2019–2021 (KT)
TABLE 223 SOUTH AMERICA: MARKET FOR PET FOOD INGREDIENTS, BY INGREDIENT, 2022–2027 (KT)
TABLE 224 SOUTH AMERICA: PET FOOD INGREDIENT MARKET FOR MEAT & MEAT PRODUCTS, BY SUBTYPE, 2019–2021 (USD MILLION)
TABLE 225 SOUTH AMERICA: PET FOOD INGREDIENT MARKET FOR MEAT & MEAT PRODUCTS, BY SUBTYPE, 2022–2027 (USD MILLION)
TABLE 226 SOUTH AMERICA: PET FOOD INGREDIENT MARKET FOR CEREALS, BY SUBTYPE, 2019–2021 (USD MILLION)
TABLE 227 SOUTH AMERICA: PET FOOD INGREDIENT MARKET FOR CEREALS, BY SUBTYPE, 2022–2027 (USD MILLION)
TABLE 228 SOUTH AMERICA: PET FOOD INGREDIENT MARKET FOR VEGETABLES & FRUITS, BY SUBTYPE, 2019–2021 (USD MILLION)
TABLE 229 SOUTH AMERICA: PET FOOD INGREDIENT MARKET FOR VEGETABLES & FRUITS, BY SUBTYPE, 2022–2027 (USD MILLION)
TABLE 230 SOUTH AMERICA: PET FOOD INGREDIENT MARKET FOR FATS, BY SUBTYPE, 2019–2021 (USD MILLION)
TABLE 231 SOUTH AMERICA: PET FOOD INGREDIENT MARKET FOR FATS, BY SUBTYPE, 2022–2027 (USD MILLION)
TABLE 232 SOUTH AMERICA: PET FOOD INGREDIENT MARKET FOR ADDITIVES, BY SUBTYPE, 2019–2021 (USD MILLION)
TABLE 233 SOUTH AMERICA: PET FOOD INGREDIENT MARKET FOR ADDITIVES, BY SUBTYPE, 2022–2027 (USD MILLION)
TABLE 234 SOUTH AMERICA: PET FOOD INGREDIENTS MARKET, BY SOURCE, 2019–2021 (USD MILLION)
TABLE 235 SOUTH AMERICA: MARKET FOR PET FOOD INGREDIENTS, BY SOURCE, 2022–2027 (USD MILLION)
12.5.1 BRAZIL
12.5.1.1 Rising spending on premium pet food products
TABLE 236 BRAZIL: PET FOOD INGREDIENTS MARKET, BY PET, 2019–2021 (USD MILLION)
TABLE 237 BRAZIL: MARKET FOR PET FOOD INGREDIENTS, BY PET, 2022–2027 (USD MILLION)
12.5.2 ARGENTINA
12.5.2.1 Improved economic conditions coupled with large pet dog population
TABLE 238 ARGENTINA: PET FOOD INGREDIENTS MARKET, BY PET, 2019–2021 (USD MILLION)
TABLE 239 ARGENTINA: MARKET FOR PET FOOD INGREDIENTS, BY PET, 2022–2027 (USD MILLION)
12.5.3 REST OF SOUTH AMERICA
TABLE 240 REST OF SOUTH AMERICA: PET FOOD INGREDIENTS MARKET, BY PET, 2019–2021 (USD MILLION)
TABLE 241 REST OF SOUTH AMERICA: MARKET FOR PET FOOD INGREDIENTS, BY PET, 2022–2027 (USD MILLION)
12.6 REST OF THE WORLD
TABLE 242 REST OF THE WORLD: PET FOOD INGREDIENTS MARKET, BY REGION, 2019–2021 (USD MILLION)
TABLE 243 REST OF THE WORLD: MARKET FOR PET FOOD INGREDIENTS, BY REGION, 2022–2027 (USD MILLION)
TABLE 244 REST OF THE WORLD: MARKET FOR PET FOOD INGREDIENTS, BY FORM, 2019–2021 (USD MILLION)
TABLE 245 REST OF THE WORLD: MARKET FOR PET FOOD INGREDIENTS, BY FORM, 2022–2027 (USD MILLION)
TABLE 246 REST OF THE WORLD: MARKET FOR PET FOOD INGREDIENTS, BY PET, 2019–2021 (USD MILLION)
TABLE 247 REST OF THE WORLD: MARKET FOR PET FOOD INGREDIENTS, BY PET, 2022–2027 (USD MILLION)
TABLE 248 REST OF THE WORLD: MARKET FOR PET FOOD INGREDIENTS, BY INGREDIENT, 2019–2021 (USD MILLION)
TABLE 249 REST OF THE WORLD: MARKET FOR PET FOOD INGREDIENTS, BY INGREDIENT, 2022–2027 (USD MILLION)
TABLE 250 REST OF THE WORLD: MARKET FOR PET FOOD INGREDIENTS, BY INGREDIENT, 2019–2021 (KT)
TABLE 251 REST OF THE WORLD: MARKET FOR PET FOOD INGREDIENTS, BY INGREDIENT, 2022–2027 (KT)
TABLE 252 REST OF THE WORLD: PET FOOD INGREDIENT MARKET FOR MEAT & MEAT PRODUCTS, BY SUBTYPE, 2019–2021 (USD MILLION)
TABLE 253 REST OF THE WORLD: PET FOOD INGREDIENT MARKET FOR MEAT & MEAT PRODUCTS, BY SUBTYPE, 2022–2027 (USD MILLION)
TABLE 254 REST OF THE WORLD: PET FOOD INGREDIENT MARKET FOR CEREALS, BY SUBTYPE, 2019–2021 (USD MILLION)
TABLE 255 REST OF THE WORLD: PET FOOD INGREDIENT MARKET FOR CEREALS, BY SUBTYPE, 2022–2027 (USD MILLION)
TABLE 256 REST OF THE WORLD: PET FOOD INGREDIENT MARKET FOR VEGETABLES & FRUITS, BY SUBTYPE, 2019–2021 (USD MILLION)
TABLE 257 REST OF THE WORLD: PET FOOD INGREDIENT MARKET FOR VEGETABLES & FRUITS, BY SUBTYPE, 2022–2027 (USD MILLION)
TABLE 258 REST OF THE WORLD: PET FOOD INGREDIENT MARKET FOR FATS, BY SUBTYPE, 2019–2021 (USD MILLION)
TABLE 259 REST OF THE WORLD: PET FOOD INGREDIENT MARKET FOR FATS, BY SUBTYPE, 2022–2027 (USD MILLION)
TABLE 260 REST OF THE WORLD: PET FOOD INGREDIENT MARKET FOR ADDITIVES, BY SUBTYPE, 2019–2021 (USD MILLION)
TABLE 261 REST OF THE WORLD: PET FOOD INGREDIENT MARKET FOR ADDITIVES, BY SUBTYPE, 2022–2027 (USD MILLION)
TABLE 262 REST OF THE WORLD: PET FOOD INGREDIENT MARKET, BY SOURCE, 2019–2021 (USD MILLION)
TABLE 263 REST OF THE WORLD: PET FOOD INGREDIENTS MARKET, BY SOURCE, 2022–2027 (USD MILLION)
12.6.1 MIDDLE EAST
12.6.1.1 Rising pet humanization trend among growing middle-class population
TABLE 264 MIDDLE EAST: PET FOOD INGREDIENT MARKET, BY PET, 2019–2021 (USD MILLION)
TABLE 265 MIDDLE EAST: MARKET FOR PET FOOD INGREDIENTS, BY PET, 2022–2027 (USD MILLION)
12.6.2 AFRICA
12.6.2.1 Large pet population coupled with rising demand for premium pet food products
TABLE 266 AFRICA: PET FOOD INGREDIENT MARKET, BY PET, 2019–2021 (USD MILLION)
TABLE 267 AFRICA: MARKET FOR PET FOOD INGREDIENTS, BY PET, 2022–2027 (USD MILLION)
13 COMPETITIVE LANDSCAPE (Page No. - 202)
13.1 OVERVIEW
13.2 STRATEGIES ADOPTED BY KEY PLAYERS
TABLE 268 OVERVIEW OF STRATEGIES ADOPTED BY KEY PLAYERS
13.3 MARKET SHARE ANALYSIS, 2021
TABLE 269 PET FOOD INGREDIENT MARKET SHARE ANALYSIS, 2021
13.4 HISTORICAL REVENUE ANALYSIS OF KEY PLAYERS
FIGURE 37 FIVE-YEAR REVENUE ANALYSIS OF KEY PLAYERS, 2017–2021 (USD BILLION)
13.5 COMPANY EVALUATION QUADRANT (KEY PLAYERS)
13.5.1 STARS
13.5.2 PERVASIVE PLAYERS
13.5.3 EMERGING LEADERS
13.5.4 PARTICIPANTS
FIGURE 38 PET FOOD INGREDIENT MARKET: COMPANY EVALUATION QUADRANT, 2021 (KEY PLAYERS)
13.5.5 PET FOOD INGREDIENT MARKET: PRODUCT FOOTPRINT (KEY PLAYERS)
TABLE 270 COMPANY FOOTPRINT, BY FORM (KEY PLAYERS)
TABLE 271 COMPANY FOOTPRINT, BY PET (KEY PLAYERS)
TABLE 272 COMPANY FOOTPRINT, BY INGREDIENT (KEY PLAYERS)
TABLE 273 COMPANY FOOTPRINT, BY SOURCE (KEY PLAYERS)
TABLE 274 COMPANY FOOTPRINT, BY REGION (KEY PLAYERS)
TABLE 275 OVERALL COMPANY FOOTPRINT (KEY PLAYERS)
13.6 PET FOOD INGREDIENTS MARKET: OTHER PLAYERS’ EVALUATION QUADRANT, 2021
13.6.1 PROGRESSIVE COMPANIES
13.6.2 STARTING BLOCKS
13.6.3 RESPONSIVE COMPANIES
13.6.4 DYNAMIC COMPANIES
FIGURE 39 PET FOOD INGREDIENT MARKET: COMPANY EVALUATION QUADRANT, 2021 (OTHER PLAYERS)
TABLE 276 PET FOOD INGREDIENT MARKET: COMPETITIVE BENCHMARKING OF OTHER PLAYERS
13.7 COMPETITIVE SCENARIO
13.7.1 NEW PRODUCT LAUNCHES
TABLE 277 PET FOOD INGREDIENT MARKET: NEW PRODUCT LAUNCHES, 2019-2022
13.7.2 DEALS
TABLE 278 PET FOOD INGREDIENT MARKET: DEALS, 2019-2022
13.7.3 OTHERS
TABLE 279 PET FOOD INGREDIENT MARKET: OTHERS, 2022
14 COMPANY PROFILES (Page No. - 214)
14.1 KEY PLAYERS
(Business overview, Products/Services/Solutions offered, Recent developments, MNM view, Right to win, Strategic choices made, and Weaknesses and competitive threats)*
14.1.1 BASF SE
TABLE 280 BASF SE: BUSINESS OVERVIEW
FIGURE 40 BASF SE: COMPANY SNAPSHOT
TABLE 281 BASF SE: PRODUCTS/SOLUTIONS/SERVICES OFFERED
TABLE 282 BASF SE: OTHERS
14.1.2 DARLING INGREDIENTS INC.
TABLE 283 DARLING INGREDIENTS INC.: BUSINESS OVERVIEW
FIGURE 41 DARLING INGREDIENTS INC.: COMPANY SNAPSHOT
TABLE 284 DARLING INGREDIENTS INC.: PRODUCTS/SOLUTIONS/SERVICES OFFERED
TABLE 285 DARLING INGREDIENTS INC.: DEALS
14.1.3 CARGILL
TABLE 286 CARGILL: BUSINESS OVERVIEW
TABLE 287 CARGILL: PRODUCTS/SOLUTIONS/SERVICES OFFERED
TABLE 288 CARGILL: NEW PRODUCT LAUNCHES
TABLE 289 CARGILL: OTHERS
14.1.4 INGREDION
TABLE 290 INGREDION: BUSINESS OVERVIEW
FIGURE 42 INGREDION: COMPANY SNAPSHOT
TABLE 291 INGREDION: PRODUCTS/SOLUTIONS/SERVICES OFFERED
TABLE 292 INGREDION: OTHERS
14.1.5 DSM
TABLE 293 DSM: BUSINESS OVERVIEW
FIGURE 43 DSM: COMPANY SNAPSHOT
TABLE 294 DSM: PRODUCTS/SOLUTIONS/SERVICES OFFERED
TABLE 295 DSM.: DEALS
14.1.6 OMEGA PROTEIN CORPORATION
TABLE 296 OMEGA PROTEIN CORPORATION: BUSINESS OVERVIEW
TABLE 297 OMEGA PROTEIN CORPORATION: PRODUCTS/SOLUTIONS/SERVICES OFFERED
14.1.7 ADM
TABLE 298 ADM: BUSINESS OVERVIEW
FIGURE 44 ADM: COMPANY SNAPSHOT
TABLE 299 ADM: PRODUCTS/SOLUTIONS/SERVICES OFFERED
TABLE 300 ADM: DEALS
TABLE 301 ADM: OTHERS
14.1.8 KEMIN INDUSTRIES, INC.
TABLE 302 KEMIN INDUSTRIES, INC.: BUSINESS OVERVIEW
TABLE 303 KEMIN INDUSTRIES, INC.: PRODUCTS/SOLUTIONS/SERVICES OFFERED
TABLE 304 KEMIN INDUSTRIES, INC.: DEALS
TABLE 305 KEMIN INDUSTRIES, INC.: OTHERS
14.1.9 CHR. HANSEN HOLDING A/S
TABLE 306 CHR. HANSEN HOLDING A/S: BUSINESS OVERVIEW
FIGURE 45 CHR. HANSEN HOLDING A/S: COMPANY SNAPSHOT
TABLE 307 CHR. HANSEN HOLDING A/S: PRODUCTS/SOLUTIONS/SERVICES OFFERED
TABLE 308 CHR. HANSEN HOLDING A/S: NEW PRODUCT LAUNCHES
14.1.10 ROQUETTE FRÈRES
TABLE 309 ROQUETTE FRÈRES: BUSINESS OVERVIEW
TABLE 310 ROQUETTE FRÈRES: PRODUCTS/SOLUTIONS/SERVICES OFFERED
TABLE 311 ROQUETTE FRÈRES: DEALS
14.2 OTHER PLAYERS
14.2.1 SARIA A/S GMBH & CO. KG
TABLE 312 SARIA A/S GMBH & CO. KG: BUSINESS OVERVIEW
TABLE 313 SARIA A/S GMBH & CO. KG: PRODUCTS/SOLUTIONS/SERVICES OFFERED
14.2.2 THE SCOULAR COMPANY
TABLE 314 THE SCOULAR COMPANY: BUSINESS OVERVIEW
TABLE 315 THE SCOULAR COMPANY: PRODUCTS/SOLUTIONS/SERVICES OFFERED
TABLE 316 THE SCOULAR COMPANY: OTHERS
14.2.3 LALLEMAND INC.
TABLE 317 LALLEMAND INC.: BUSINESS OVERVIEW
TABLE 318 LALLEMAND INC.: PRODUCTS/SOLUTIONS/SERVICES OFFERED
TABLE 319 LALLEMAND INC.: DEALS
14.2.4 PHILEO BY LESAFFRE
TABLE 320 PHILEO BY LESAFFRE: BUSINESS OVERVIEW
TABLE 321 PHILEO BY LESAFFRE: PRODUCTS/SOLUTIONS/SERVICES OFFERED
TABLE 322 PHILEO BY LESAFFRE: DEALS
14.2.5 LABUDDE GROUP INC.
TABLE 323 LABUDDE GROUP INC.: BUSINESS OVERVIEW
TABLE 324 LABUDDE GROUP INC: PRODUCTS/SOLUTIONS/SERVICES OFFERED
14.2.6 LINKONE INGREDIENT SOLUTIONS
14.2.7 3D CORPORATE SOLUTIONS
14.2.8 HYDRITE CHEMICAL
14.2.9 GREEN SOURCE ORGANICS
14.2.10 BIORIGIN
14.2.11 VITIVA D.O.O.
14.2.12 AFB INTERNATIONAL
14.2.13 SYMRISE
14.2.14 MOWI ASA
14.2.15 ZINPRO CORP.
*Details on Business overview, Products/Services/Solutions offered, Recent developments, MNM view, Right to win, Strategic choices made, and Weaknesses and competitive threats might not be captured in case of unlisted companies.
15 ADJACENT AND RELATED MARKETS (Page No. - 268)
15.1 INTRODUCTION
TABLE 325 ADJACENT MARKETS TO PET FOOD INGREDIENT MARKET
15.2 LIMITATIONS
15.3 PET FOOD PROCESSING MARKET
15.3.1 MARKET DEFINITION
15.3.2 MARKET OVERVIEW
TABLE 326 PET FOOD PROCESSING MARKET, BY APPLICATION, 2017–2026 (USD MILLION)
15.4 PET FOOD PACKAGING MARKET
15.4.1 MARKET DEFINITION
15.4.2 MARKET OVERVIEW
TABLE 327 PET FOOD PACKAGING MARKET, BY ANIMAL, 2018–2025 (USD MILLION)
16 APPENDIX (Page No. - 271)
16.1 DISCUSSION GUIDE
16.2 KNOWLEDGESTORE: MARKETSANDMARKETS’ SUBSCRIPTION PORTAL
16.3 CUSTOMIZATION OPTIONS
16.4 RELATED REPORTS
16.5 AUTHOR DETAILS
The study involved four major activities in estimating pet food ingredients market size. Exhaustive secondary research was conducted to collect information on the market, peer market, and parent market. The next step was to validate these findings, assumptions, and sizing with industry experts across the value chain through primary research. Both the top-down and bottom-up approaches were employed to estimate the complete market size. Thereafter, market breakdown and data triangulation were used to estimate the market size of segments and sub-segments.
Pet Food Ingredients Market Secondary Research
In the secondary research process, various sources such as annual reports, press releases & investor presentations of companies, white papers, pet food journals, certified publications, articles from recognized authors, gold & silver standard websites, directories, and databases were referred to, to identify and collect information. The Pet Food Industry Association of Australia, American Pet Products Association, Inc. (APPA), International Feed Industry Federation (IFIF), Canadian Association of Raw Pet Food Manufacturers, Alltech Feed Survey, and academic references pertaining to pet food ingredients were referred to identify and collect information for this study.
Secondary research was mainly used to obtain key information about the industry’s supply chain, the total pool of key players, and market classification and segmentation as per the industry trends to the bottom-most level, regional markets, and key developments from both market- and technology-oriented perspectives.
Pet Food Ingredients Market Primary Research
In the primary research process, various sources from the supply and demand sides were interviewed to obtain qualitative and quantitative information. The primary sources from the supply-side included industry experts such as CEOs, vice presidents, marketing directors, technology and innovation directors, and related key executives from various key companies and organizations operating in the market.
After the complete market engineering (which included calculations for market statistics, market breakdown, market size estimations, market forecasting, and data triangulation), extensive primary research was conducted to gather information and to verify and validate the critical numbers arrived at. Primary research was also conducted to identify the segmentation types, industry trends, key players, competitive landscape of pet food ingredients supplied by different market players, and key market dynamics such as drivers, restraints, opportunities, burning issues, industry trends, and key player strategies.
In the complete market engineering process, top-down and bottom-up approaches were extensively used along with several data triangulation methods to conduct market estimation and market forecasting for the overall market segments and subsegments listed in this report. Extensive qualitative and quantitative analysis was performed on the complete market engineering process to list key information/insights throughout the report.
To know about the assumptions considered for the study, download the pdf brochure
Pet Food Ingredients Market Size Estimation
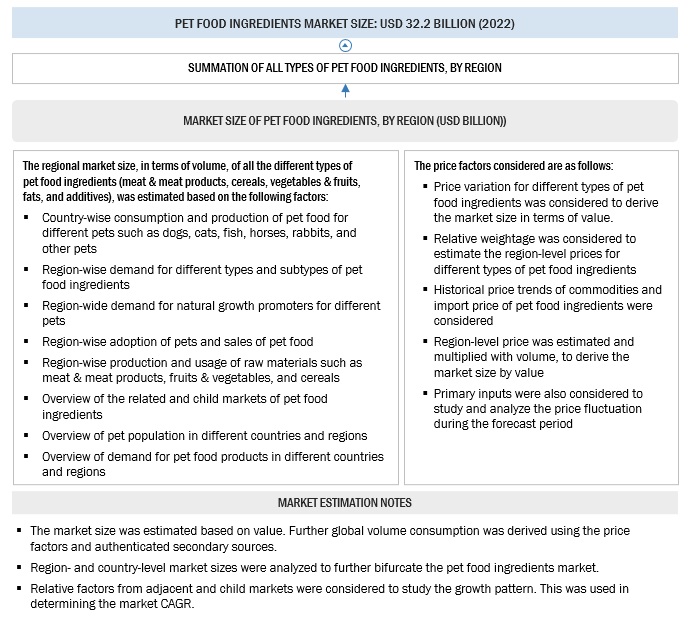
Both the top-down and bottom-up approaches were used to estimate and validate the total size of the market. These methods were also used extensively to estimate the size of various subsegments in the market. The research methodology used to estimate the market size includes the following:
- The key players were identified through extensive primary and secondary research.
- The value chain and market size of the market, in terms of value and volume, were determined through primary and secondary research.
- All percentage shares, splits, and breakdowns were determined using secondary sources and verified through primary sources.
- All possible parameters that affect the market covered in this research study were accounted for, viewed in extensive detail, verified through primary research, and analyzed to obtain the final quantitative and qualitative data.
- The research included the study of reports, reviews, and newsletters of top market players, along with extensive interviews for opinions from key leaders, such as CEOs, directors, and marketing executives.
Data Triangulation
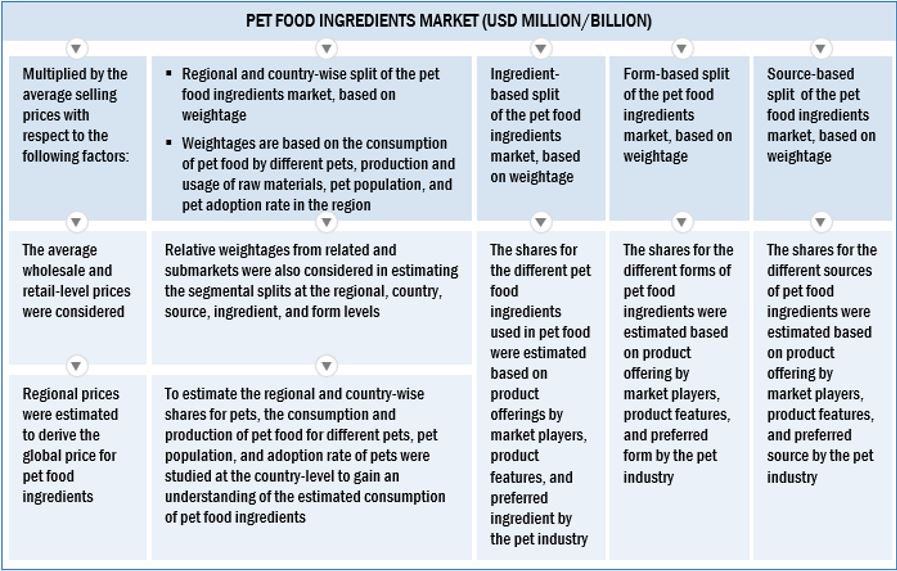
After arriving at the overall market size from the estimation process explained above, the total market was split into several segments and subsegments. The data triangulation and market breakdown procedures were employed, wherever applicable, to estimate the overall market and arrive at the exact statistics for all segments and subsegments. The data was triangulated by studying various factors and trends from the demand and supply sides. Along with this, the market size was validated using the top-down and bottom-up approaches. It was then verified through primary interviews. Hence, three approaches were adopted—the top-down approach, the bottom-up approach, and the one involving expert interviews. Only when the values arrived at from the three points match, the data is assumed to be correct.
Pet Food Ingredients Market Report Objectives
- To describe and forecast the pet food ingredients market, in terms of form, source, ingredient, pet, nature and region.
- To describe and forecast the pet food ingredient market, in terms of value, by region– North America, Europe, Asia Pacific, South America and the Rest of the World—along with their respective countries.
- To provide detailed information regarding the major factors influencing the market growth (drivers, restraints, opportunities, and challenges)
- To strategically analyze micro-markets with respect to individual growth trends, prospects, and contributions to the overall market.
- To study the complete value chain of the pet food ingredient market.
- To analyze opportunities in the market for stakeholders by identifying the high-growth segments of the pet food ingredient market.
- To strategically profile the key players and comprehensively analyze their market positions, in terms of ranking and core competencies, along with details on the competitive landscape of market leaders.
- To analyze strategic approaches, such as expansions & investments, product launches & approvals, mergers & acquisitions, and agreements in the pet food ingredient market.
Available Customizations
MarketsandMarkets offers customizations according to client-specific scientific needs with the given market data.
The following customization options are available for the report:
Product Analysis
- Product Matrix, which gives a detailed comparison of the product portfolio of each company
Geographic Analysis
- Further breakdown of the Rest of the European pet food ingredient market into the Netherlands, the UK, Poland and other EU countries.
- Further breakdown of the Rest of Asia Pacific pet food ingredient market into Indonesia, the Philippines, Vietnam, and South Korea.
- Further breakdown of the Rest of the South American pet food ingredient market into Peru, Chile, and Venezuela
Company Information
- Detailed analyses and profiling of additional market players (up to five)
Growth opportunities and latent adjacency in Pet Food Ingredients Market
Interested to understand more about the regulatory environment by country for this Pet Food Ingredients Market.
Need data on imports of ingredients for pet food into the US.
Interested in market information regarding cut meat & meat Products by animal type - poultry, beef, lamb, seafood. What is the Deboned Poultry market worth?
Looking for information about the Pet food industry and companies that are using fish oil in their food.
Interested in individual sections/tables from this report.
Looking for more detailed information on the pet food ingredients market specific to each ingredient market segment and region.
Interested in purchasing an excerpt and table of contents.
Interested in knowing market share by company.
As a pet food manufacturer, interested in detailed market information
We are interested in the price for this study, and if marine proteines are covered by the study? Kind Regards; Jon Aulie/President
Interested in company profiles of raw material suppliers and traders in India.
Interested in analyzing the market of products related to pet food industry.