The research study involved 4 major activities in estimating the size of the hearth market. Exhaustive secondary research has been done to collect important information about the market and peer markets. The validation of these findings, assumptions, and sizing with the help of primary research with industry experts across the value chain has been the next step. Both top-down and bottom-up approaches have been used to estimate the market size. Post which the market breakdown and data triangulation have been adopted to estimate the market sizes of segments and sub-segments.
Secondary Research
In the secondary research process, various secondary sources have been referred to for identifying and collecting information required for this study. The secondary sources include annual reports, press releases, and investor presentations of companies, white papers, and articles from recognized authors. Secondary research has been mainly done to obtain key information about the market’s value chain, the pool of key market players, market segmentation according to industry trends, regional outlook, and developments from both market and technology perspectives.
Primary Research
In primary research, various primary sources from both supply and demand sides have been interviewed to obtain the qualitative and quantitative insights required for this report. Primary sources from the supply side include experts such as CEOs, vice presidents, marketing directors, manufacturers, technology and innovation directors, end users, and related executives from multiple key companies and organizations operating in the hearth ecosystem.

To know about the assumptions considered for the study, download the pdf brochure
Market Size Estimation
In the market engineering process, both top-down and bottom-up approaches have been used, along with data triangulation methods, to estimate and validate the size of the hearth market and other dependent submarkets. The research methodology used to estimate the market sizes includes the following:
-
Identifying stakeholders in the hearth market that influence the entire market, along with participants across the value chain.
-
Analyzing major manufacturers of hearth products and studying their product portfolios
-
Analyzing trends related to the adoption of hearth products
-
Tracking the recent and upcoming developments in the market that include investments, R&D activities, product launches, and acquisitions as well as forecasting the market size based on these developments and other critical parameters
-
Carrying out multiple discussions with key opinion leaders to identify the adoption trends of hearth market
-
Segmenting the overall market into various other market segments
-
Validating the estimates at every level through discussions with key opinion leaders, such as chief executives (CXOs), directors, and operation managers, and finally with the domain experts at MarketsandMarkets
Market Size Estimation Methodology-Bottom-up Approach

Market Size Estimation Methodology-Top-Down Approach

Data Triangulation
After arriving at the overall market size by the market size estimation process explained in the earlier section, the overall hearth market has been divided into several segments and subsegments. The data triangulation and market breakdown procedures have been used to complete the overall market engineering process and arrive at the exact statistics for all segments, wherever applicable. The data has been triangulated by studying various factors and trends from both the demand and supply sides. Along with data triangulation and market breakdown, the market has been validated by top-down and bottom-up approaches.
Market Definition
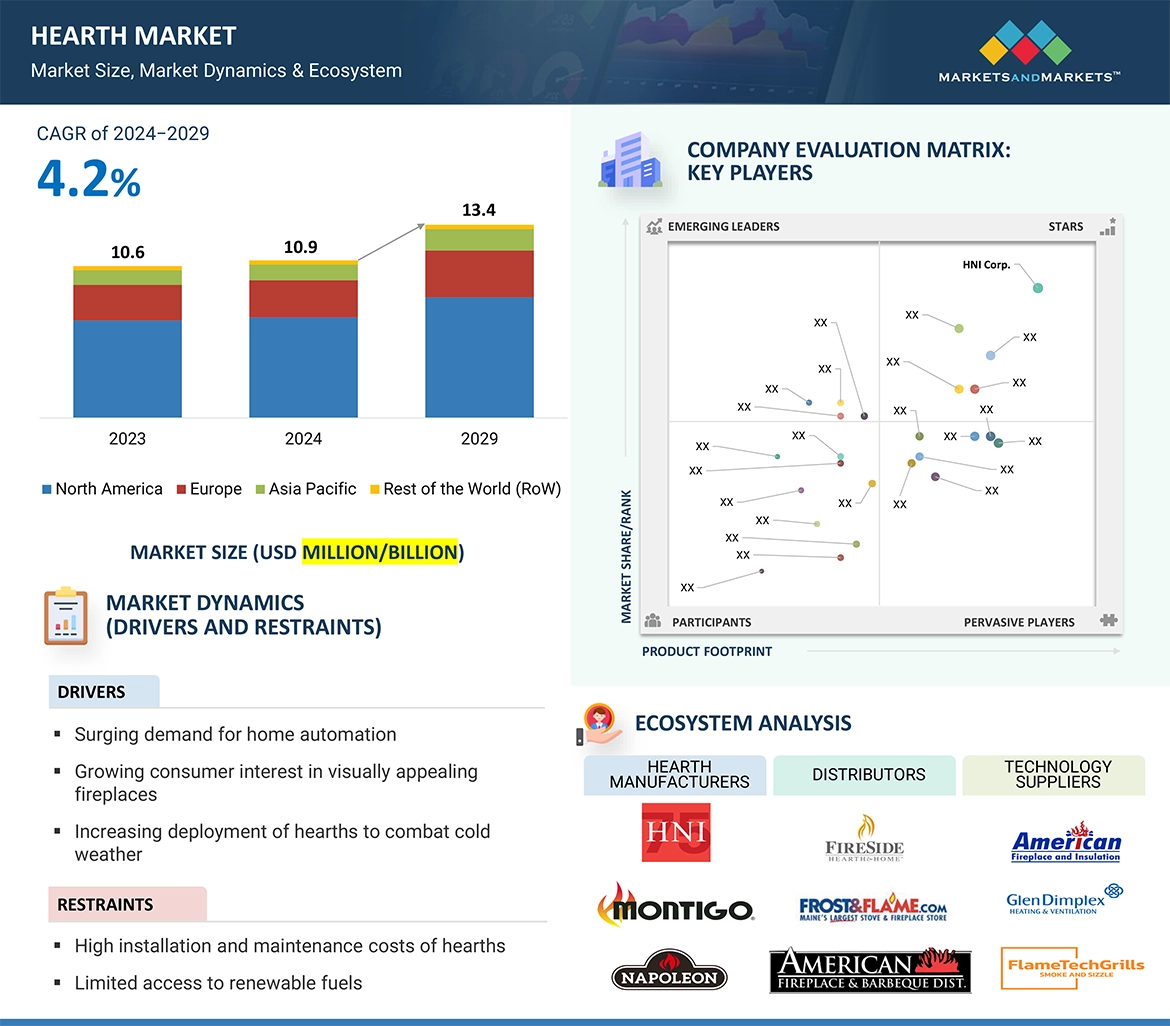
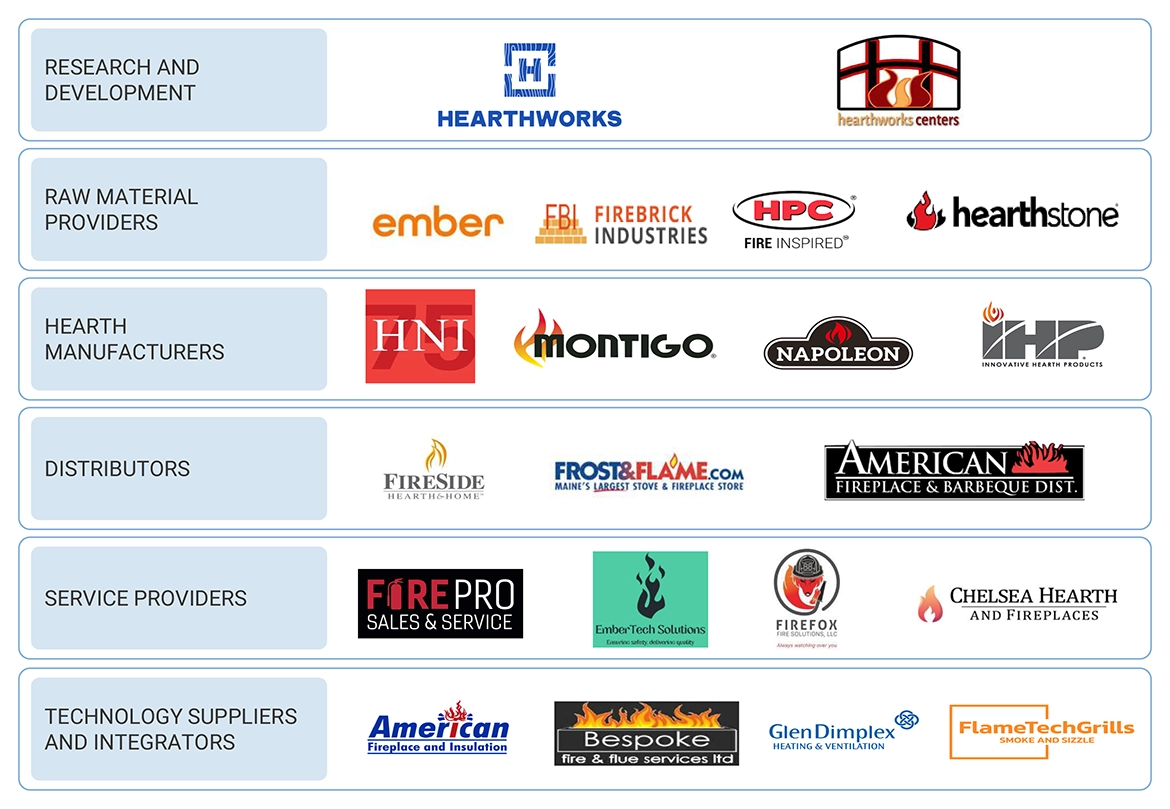
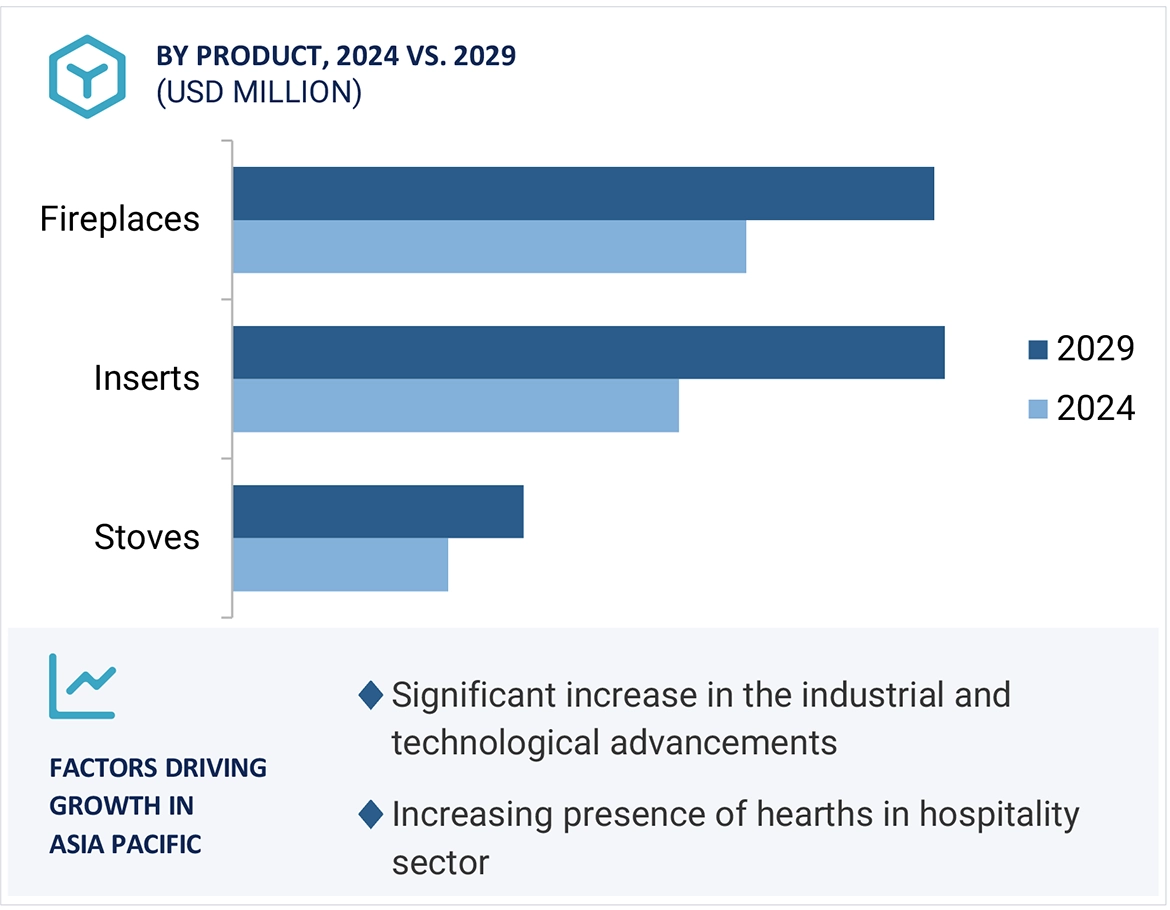
A hearth is the floor of a fireplace extending into a room, serving both functional and decorative purposes in homes. Made from durable, non-combustible materials like brick, stone, tile, or concrete, hearths withstand heat and prevent fire hazards. The hearth market encompasses products and services related to home heating appliances, such as fireplaces, stoves, inserts, and accessories. This includes traditional wood-burning, gas, electric, and ethanol fireplaces, as well as wood, pellet, gas, and electric stoves. Additionally, the market covers outdoor heating solutions like fire pits and patio heaters, and services like installation, maintenance, and chimney cleaning. Catering to residential and commercial customers, the hearth market combines efficient heating solutions with aesthetic enhancements. Influenced by energy efficiency trends, environmental regulations, and consumer preferences, the market is segmented by fuel type, product type, application, design, placement, material, and region. Demand is driven by weather conditions, energy costs, and the housing market, with the residential sector being the primary contributor.
Stakeholders
-
Homeowners
-
Builders and Contractors
-
Interior Designers
-
Retailers
-
Hearth Product Manufacturers
-
Raw Material Suppliers
-
System Integration Providers
-
Technology Solution Providers
-
Distributors and Resellers
-
Service Providers
-
Regulatory Bodies
-
Research and Development Institutes
-
End Users
The main objectives of this study are as follows:
-
Define, analyze, and forecast the hearth market, in terms of value, based on products, placement, design, ignition type, vent availability, application, fireplace type and material
-
Define, analyze, and forecast the hearth market, in terms of volume, based on fuel type
-
Forecast the market size for various segments with respect to 4 main regions: North America, Europe, Asia Pacific, and Rest of the World
-
Provide detailed information regarding the major factors (drivers, restraints, opportunities, and challenges) influencing the growth of the hearth market
-
Study the complete value chain and related industry segments for the hearth market
-
Strategically analyze the micromarkets with respect to individual growth trends, prospects, and contributions to the overall market
-
To analyze trends and disruptions; pricing trends; patents and innovations; trade data (export and import data); regulatory environment; Porter’s five forces analysis; case studies; key stakeholders & buying criteria; technology trends; the market ecosystem; and key conferences and events related to the hearth market
-
Analyze opportunities in the market for various stakeholders by identifying the high-growth segments of the market
-
Strategically profile the key players and comprehensively analyze their market position in terms of revenue, market share and core competencies, along with detailing the competitive landscape for the market leaders
-
To analyze competitive developments such as product launches/developments, expansions, acquisitions, partnerships, collaborations, agreements, and research and development (R&D) activities carried out by players in the hearth market
Available Customizations:
With the given market data, MarketsandMarkets offers customizations according to the specific requirements of companies. The following customization options are available for the report:
Country-wise Information:
-
Analysis for additional countries (up to five)
Company Information:
-
Detailed analysis and profiling of additional market players (up to five)


Roger
Apr, 2026
How will rising demand for home automation and smart living solutions influence long-term growth in the modern hearth market?.
Dylan
Apr, 2026
What is the ROI impact of upgrading outdated heating systems to modern hearth solutions, and how quickly do consumers and hospitality businesses typically adopt such upgrades?.
User
Sep, 2019
The hearth market is driven by factors such as growing need for space heating products due to extremely cold climatic conditions in certain regions and increasing interest in esthetic home decor products among customers. What are different assumptions included for market data forecast?.
User
Sep, 2019
Japan and China are two big market in Asia Pacific for this market. What kind of data have been provided for APAC countries in this study?.
User
Sep, 2019
I am interested specifically into the Japanese market for this research. .
User
Nov, 2019
Did you outline market size in USD from the end consumer perspective or from the Manufacturer selling price?� Meaning in most cases the manufacturer sells to a distributor or retailer (which you refer to your report) and then ultimately to a consumer (obviously with mark-up at each level).�Can you share details on your reserach methodology..
User
Mar, 2019
How you compiled the data, did it include the venting/chimney cost as well or just the manufactured appliance (gas stove, wood stove, etc.?)�.