
HVAC System Market Size, Share, Industry, Growth Trends, 2030

HVAC System Market Size, Share, Growth & Trends by Cooling (Unitary AC, VRF, Chiller, Cooling Tower, Cooler), Heating (Heat Pump, Boiler, Unitary Heater, Furnace), Ventilation (AHU, Air Filter, Humidifier, Purifier), Technology (Smart, Sustainable), Service - Global Forecast to 2030


HVAC SYSTEM MARKET OVERVIEW
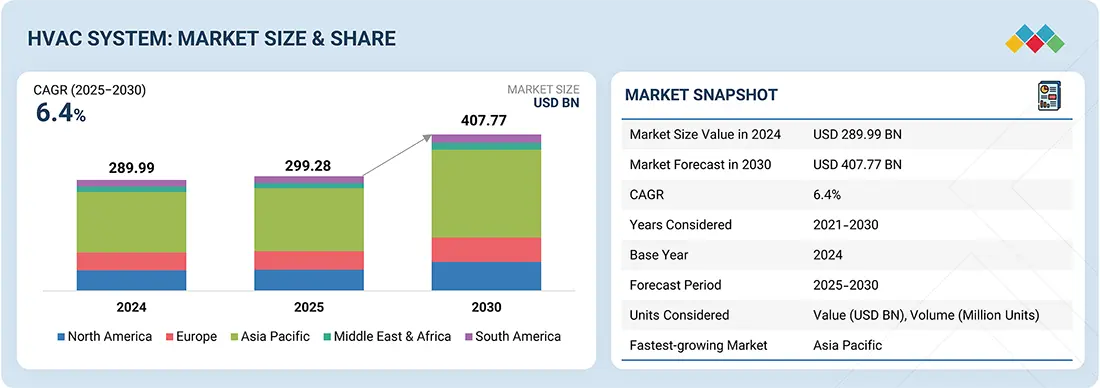
According to Marketsandmarkets, the global HVAC system market size was valued at 299.28 billion in 2025 and is projected to reach USD 407.77 Billion, growing at a CAGR of 6.4% from 2025 to 2030. HVAC system is a set of technologies designed to regulate indoor temperature, humidity, and air quality for homes, businesses, or industrial spaces. It includes equipment that controls air circulation, adjusts temperatures via heating and cooling, and ensures adequate ventilation.
REPORT SCOPE
| REPORT METRIC | DETAILS |
|---|---|
| Market Size in 2025 (Value) | USD 289.28 Billion |
| Market Forecast in 2030 (Value) | USD 407.77 Billion |
| Growth Rate | CAGR of 6.4% from 2025–2030 |
| Years Considered | 2021–2030 |
| Base Year | 2024 |
| Forecast Period | 2025–2030 |
| Units Considered | Value (USD Billion) and Volume (Million Units) |
| Report Coverage | Revenue forecast, company ranking, competitive landscape, growth factors, and HVAC industry trends |
| Segments Covered |
|
| Regional Scope | North America, Europe, Asia Pacific, the Middle East & Africa, and South America |
| Top Companies |
|
| Growth Drivers |
|
Market Size & Forecast
KEY TAKEAWAYS - HVAC Industry Overview
- Asia Pacific HVAC system market accounted for a 50.6% revenue share in 2024.
- By Heating Equipment, the heat pump segment is expected to register the highest CAGR of 8.7%.
- By Cooling Equipment, the unitary air conditioner is expected to dominate the market growing at the CAGR of 5.3%.
- By Ventilation Equipment, the air handling unit segment is expected to register the highest CAGR of 7.8%.
- By Technology, the traditional HVAC systems is expected to dominate the market.
- By Implementation Type, the new construction segment is expected to grow at the highest CAGR of 6.8%.
- By Service Type, the upgradation/replacement services segment is expected to grow at the highest CAGR of 8.1%.
- By Application, the commercial segment will grow the fastest at 6.6% during the forecast period.
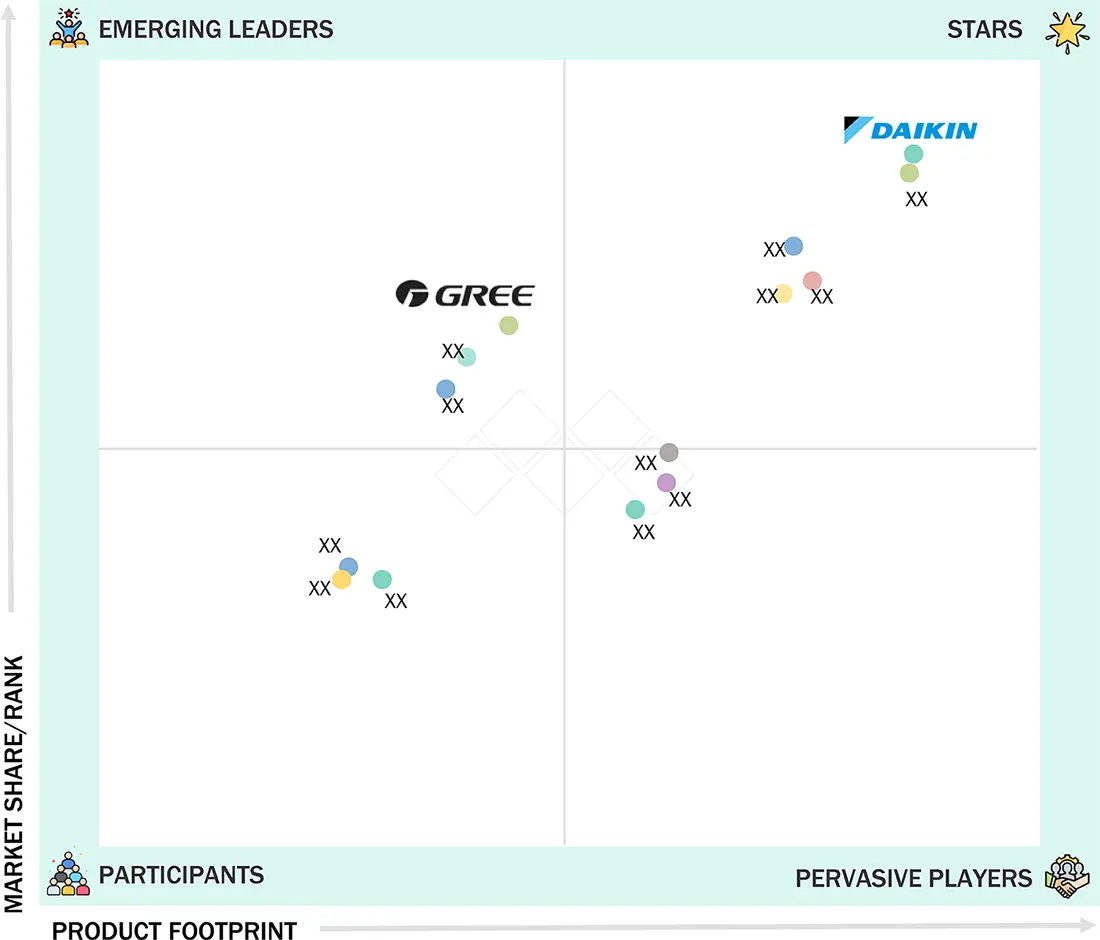
- Daikin, Carrier, and Midea were identified as some of the star players in the HVAC System Market (global), given their strong market share and product footprint.
- Sensibo, Hysopt, and Phononic among others, have distinguished themselves among startups and SMEs by securing strong footholds in specialized niche areas, underscoring their potential as emerging market leaders.
The HVAC system industry is projected to grow rapidly over the next decade, due to the increasing demand for energy-efficient and sustainable buildings. Residential, commercial, and industrial buildings use heating, cooling, or climate control technologies to ensure comfort and indoor air quality. Climate change has led to a greater need for cooling and heating systems.
Commercial HVAC System Market Size, Trends & Growth Analysis
The commercial HVAC systems Market is steadily expanding as a result of tighter environmental regulations, growing demand for energy-efficient climate control solutions, and an increase in the construction of commercial buildings. The demand for sophisticated HVAC systems that guarantee indoor air quality and occupant comfort is being driven by offices, hospitals, retail establishments, data centres, and educational institutions. The use of AI-driven energy management, the adoption of smart and connected HVAC systems, and the increasing demand for high-efficiency equipment and sustainable refrigerants are some of the major trends. Supported by urbanization, infrastructure modernization, and retrofitting of aging buildings, the commercial HVAC market is expected to continue expanding at a healthy pace over the coming years.
Source: Secondary Research, Interviews with Experts, MarketsandMarkets Analysis
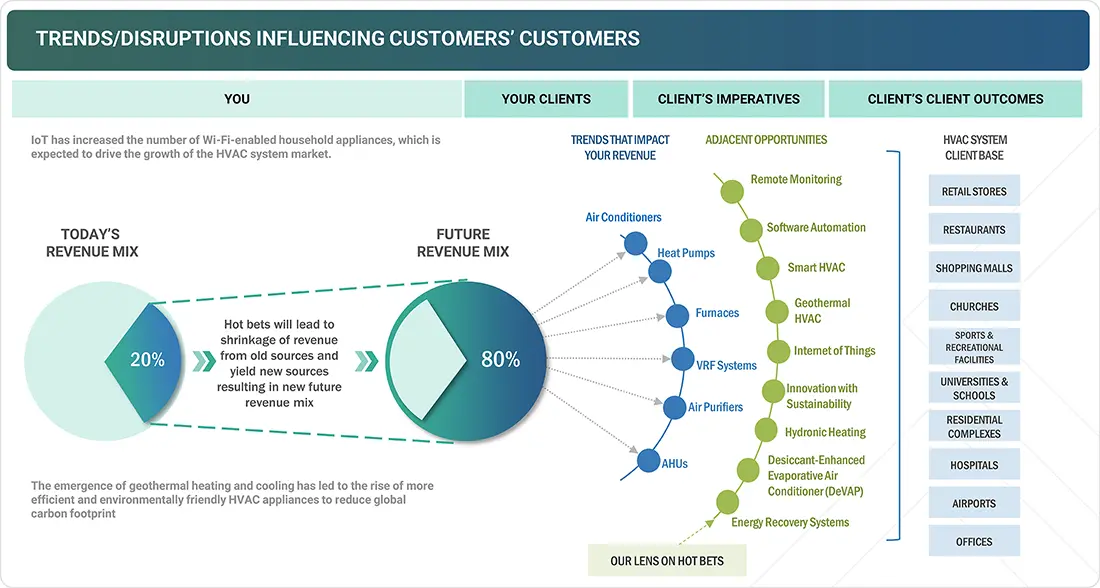
HVAC MARKET TRENDS & DISRUPTIONS IMPACTING CUSTOMERS' CUSTOMERS
Customer trends or disruptions impact consumers' businesses. The IoT has transformed many industries, including HVAC. IoT is the future of HVAC, from cloud connectivity to fast, easy commissioning and remote monitoring. Technicians and operators can make more assertive diagnoses by monitoring, operating, and collecting data in real time. Less time is needed to perform maintenance, and real-time monitoring is achieved.
Source: Secondary Research, Interviews with Experts, MarketsandMarkets Analysis
MARKET DYNAMICS
Level
-
Increasing demand for energy-efficient HVAC systems

-
Growing construction activities in residential and industrial sectors

Level
-
Rising expenses for installing, servicing, and maintaining HVAC systems

-
Limited space for large HVAC installations in commercial and residential buildings

Level
-
Swift evolution of IoT within HVAC industry

-
Significant traction of VRF systems in residential and commercial applications

Level
-
Lack of awareness about benefits of HVAC systems in developing countries

-
Increase in environmental concerns and aging infrastructure

Source: Secondary Research, Interviews with Experts, MarketsandMarkets Analysis
Driver: Increasing demand for energy-efficient HVAC systems
The HVAC system market is expected to grow due to the increasing demand for energy-efficient and sustainable buildings. Residential, commercial, and industrial buildings use heating, cooling, or climate control technologies to ensure comfort and indoor air quality. Climate change has led to a greater need for cooling and heating systems. These changes have caused higher energy consumption to meet cooling demands from buildings, which puts more strain on air conditioners.
Restraint: Rising expenses for installing, servicing, and maintaining HVAC systems
Energy-efficient HVAC systems are increasingly replacing traditional setups, integrating innovations like ice-powered AC, motion-activated cooling, and smart vents to enhance efficiency, lower energy costs, and reduce carbon emissions. While these systems provide long-term savings, installation costs vary across residential, commercial, and industrial applications, influenced by factors including property size, ductwork requirements, equipment type, and SEER rating.
Opportunity: Swift evolution of IoT within the HVAC industry
IoT technology is transforming the HVAC industry with smart systems that can be remotely controlled, monitored, and managed. These systems provide real-time data on energy consumption, temperature, and humidity, enabling more efficient operations. By optimizing performance, they reduce energy consumption and improve system reliability, leading to significant cost savings for building owners and operators.
Challenge: Lack of awareness about the benefits of HVAC systems in developing countries
One of the challenges the HVAC industry faces is the lack of awareness about the benefits of HVAC systems, particularly in developing countries. Many people in developing countries are unfamiliar with HVAC systems and their potential to provide comfortable and healthy indoor environments. This lack of awareness often leads to a preference for traditional cooling or heating methods, which may be less efficient and less effective; they are also commonly perceived to be expensive.
HVAC System Market Growth: COMMERCIAL USE CASES ACROSS INDUSTRIES
| COMPANY | USE CASE DESCRIPTION | BENEFITS |
|---|---|---|
 |
Installed a ductless mini-split system with three comfort zones to provide heating and cooling throughout the condo. | Ductless mini-splits provide humidity control and air filtration to improve the overall air quality in the home and provide energy-efficient heating and cooling. |
 |
AI-driven VRF (Variable Refrigerant Flow) solutions with advanced energy management, optimized temperature control, and real-time monitoring to enhance efficiency and reliability. | The AI-enabled VRF system significantly lowered energy consumption, improved sustainability, and delivered a smarter, more adaptive HVAC experience. |
 |
CITY MULTI VRF zoning systems, Heat2O Heat Pump Water Heater systems, and integrated controls were installed. | The hotel achieved passive house certification and became the first zero-emission hotel in the US, reducing carbon footprint and setting a benchmark for sustainable hospitality. |
 |
Replacement of condenser, air handler, and switch to R-410a refrigerant system. | Carrier comfort series AC proved cost-effective, durable, and sustainable, ensuring significant long-term savings compared to retrofitting. |
 |
Installation of 10 VRV systems, iTM, 1 D-AHU Modular R + DX Coil & ERQ250, 4 Mini SkyAir (7,315 m³/h airflow). | Daikin solution delivered reliable, energy-efficient cooling for railway control systems, reducing operational risks and costs. |
Logos and trademarks shown above are the property of their respective owners. Their use here is for informational and illustrative purposes only.
MARKET ECOSYSTEM
The HVAC system ecosystem comprises equipment manufacturers, control providers, system integrators, and distributors. HVAC end users include residential, commercial, and industrial. Across the commercial segment, HVAC systems are used in offices, government organizations, airports, healthcare facilities, educational institutions, and retail shops.
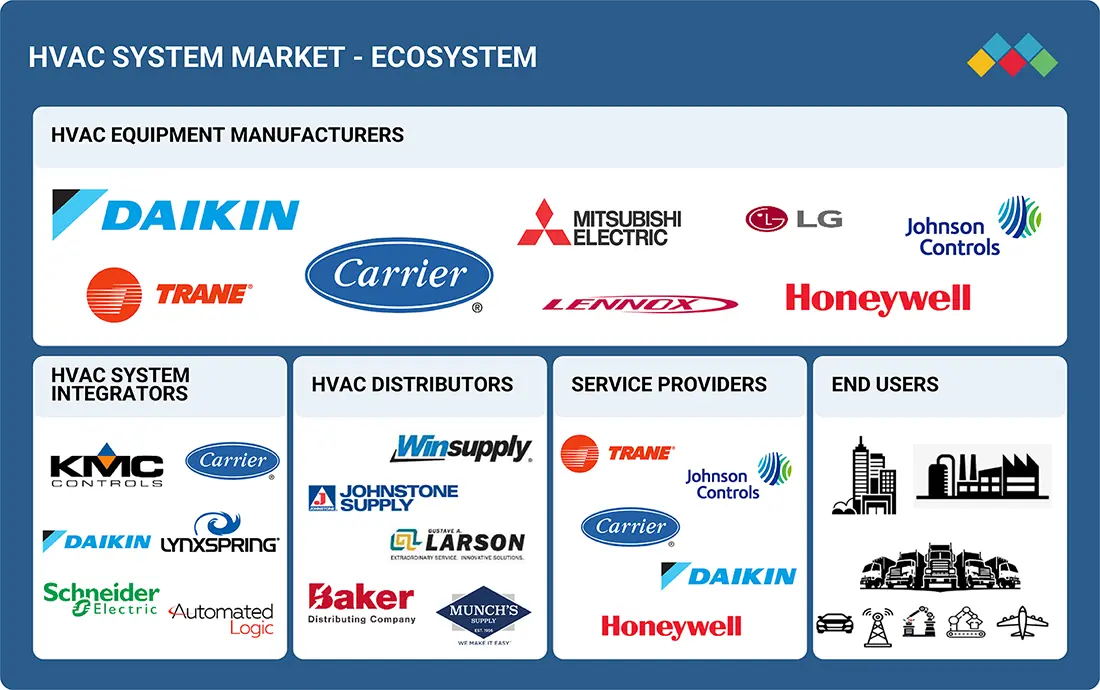
Logos and trademarks shown above are the property of their respective owners. Their use here is for informational and illustrative purposes only.
MARKET SEGMENTS
Source: Secondary Research, Interviews with Experts, MarketsandMarkets Analysis
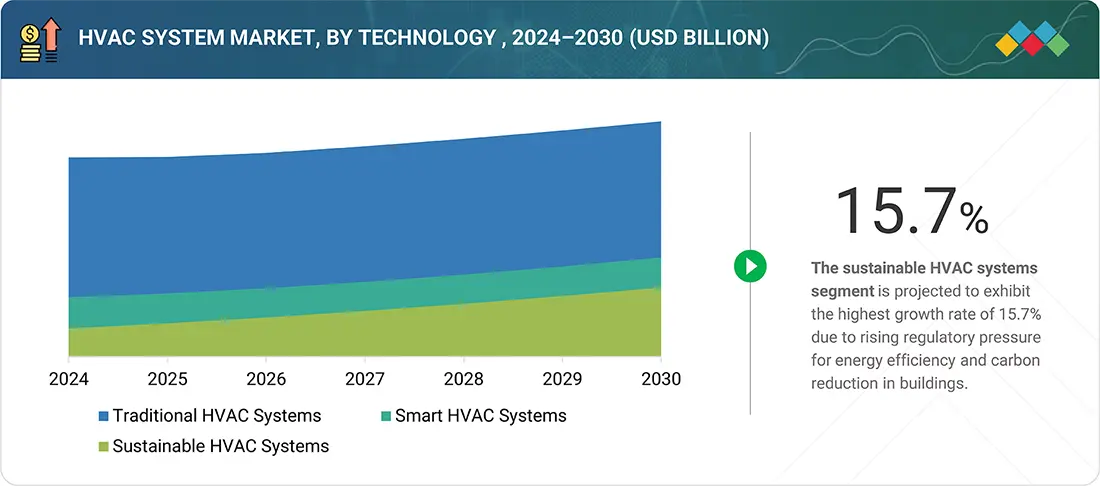
HVAC System Market Share, By Technology
Traditional HVAC systems accounted for the largest share of the overall market in 2024, and the trend is expected to continue during the forecast period. This is primarily due to their extensive installed base in residential, commercial, and industrial buildings, coupled with lower initial costs compared to advanced systems. Many regions, especially in developing economies, continue to rely on these systems because of their simpler maintenance requirements, widespread availability of spare parts, and familiarity among service technicians.
HVAC System Market, By Implementation Type
The new construction buildings segment is expected to lead the overall market during the forecast period. Governments of various countries are making significant investments in infrastructure development, such as expansion projects of hotels, retail stores, airports, and educational buildings. For example, the Energy Star program by the US government provides resources and recognition to organizations that implement energy-efficient practices, including installing energy-efficient HVAC systems.
HVAC System Market, By Service Type
The installation services segment is expected to lead the overall market during the forecast period. As more buildings require efficient heating and cooling solutions, the need for professional installation services grows. Additionally, complex regulations and the necessity for specialized expertise further solidify the demand for installation services, positioning them for substantial growth in the future.
HVAC System Market, By End User
The commercial segment is expected to account for the largest market share during the forecast period. This segment is driven by the increasing adoption of HVAC systems in commercial buildings, growing demand for energy-efficient devices, and rising awareness regarding energy conservation in developing regions such as the Asia Pacific and RoW. Increasing government investments in the construction of commercial spaces are also expected to propel the growth of the HVAC system market in commercial applications.
REGION
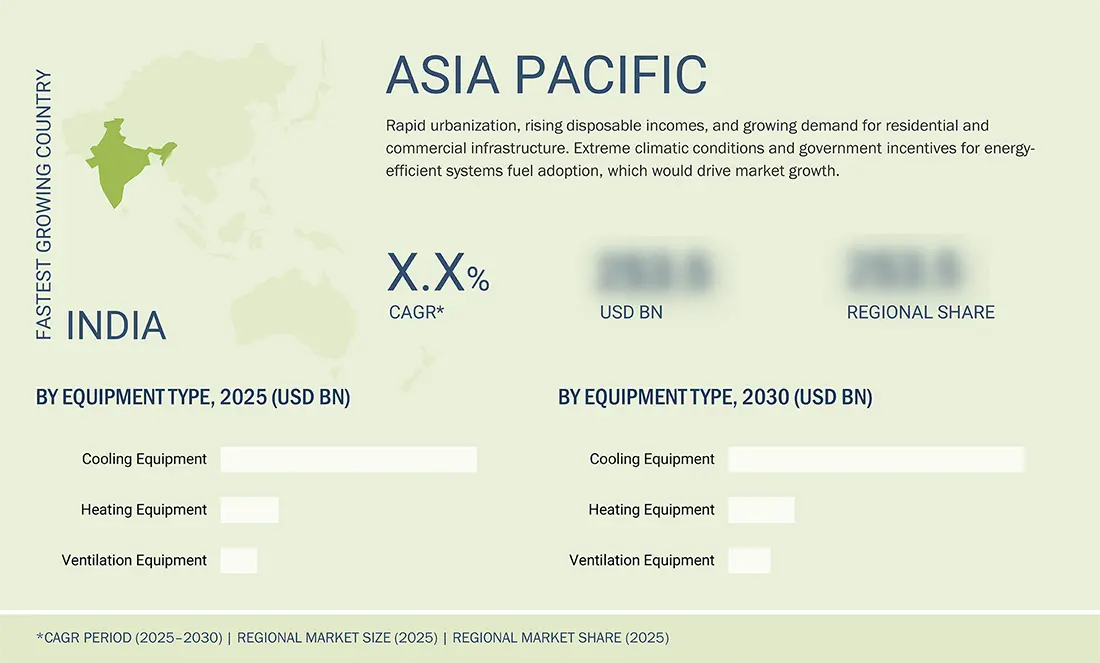
Asia Pacific to be fastest-growing region in global HVAC system market growth during forecast period
The Asia Pacific region is expected to lead the market, expanding at the highest CAGR during the forecast period. Increasing construction activities, rising population, per capita income, growing need for energy-efficient devices, and favorable energy efficiency incentives by governments are key factors driving the growth of the market in the region. The Singapore government offers a tax incentive of up to 100% of the capital expenditure incurred in purchasing and installing qualifying energy-efficient equipment, including HVAC systems. Also, the Japanese government provides subsidies of up to 35% of the cost of the installation of energy-efficient HVAC equipment in commercial buildings.
The North American HVAC system market is anticipated to attain a valuation of USD 57.6 billion by the year 2030, rising from USD 42.2 billion in 2025, with a compounded annual growth rate (CAGR) of 6.4% during the period from 2025 to 2030. An HVAC system comprises a collection of technologies specifically engineered to regulate indoor temperature, humidity, and air quality within residential, commercial, or industrial environments. This encompasses equipment that manages air circulation, modulates temperatures through heating and cooling functions, and guarantees sufficient ventilation.
The European HVAC system market is expected to reach USD 48.1 billion by 2030, up from USD 36.4 billion in 2025, with a CAGR of 5.8% from 2025 to 2030. Increasing construction investments, growing residential development, higher disposable incomes, and more government funding are driving market growth. The move toward energy-efficient HVAC systems is also supported by regulations encouraging eco-friendly refrigerants and sustainable climate control technologies.
HVAC System Market Share: COMPANY EVALUATION MATRIX
In the HVAC System market matrix, DAIKIN INDUSTRIES, Ltd. (Star) leads with a strong market presence and a wide product portfolio, driving large-scale adoption across industries like commercial and industrial. GREE ELECTRIC APPLIANCES, INC. OF ZHUHAI (Emerging Leader) is gaining traction with HVAC solutions.
Source: Secondary Research, Interviews with Experts, MarketsandMarkets Analysis
KEY MARKET PLAYERS - Top HVAC System Companies
- Carrier (US)
- DAIKIN INDUSTRIES, Ltd. (Japan)
- Trane Technologies plc (Ireland)
- LG Electronics (South Korea)
- Midea (China)
- Lennox International Inc. (US)
- Honeywell International Inc. (US)
- Mitsubishi Electric Corporation (US)
- GREE ELECTRIC APPLIANCES, INC. OF ZHUHAI (China)
- Panasonic Holdings Corporation (Japan)
- Modine (US)
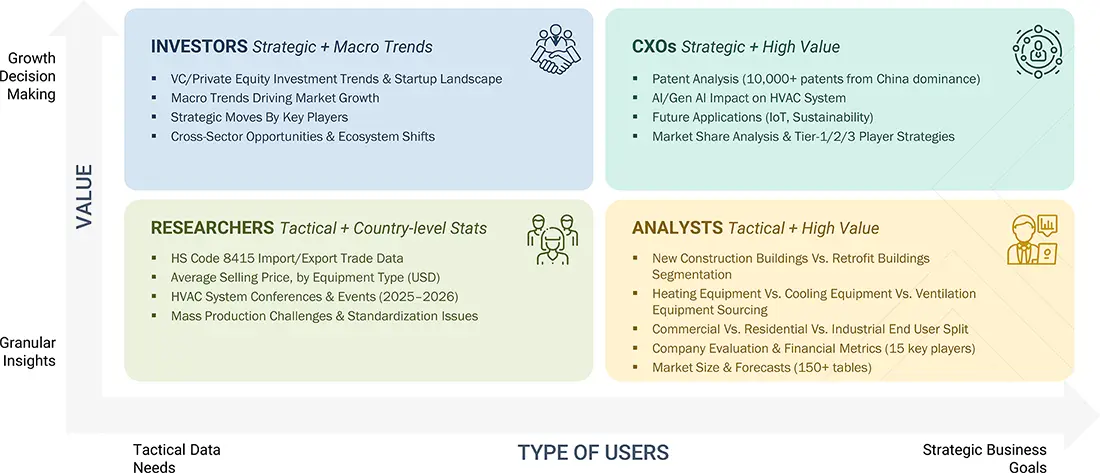
WHAT IS IN IT FOR YOU: HVAC System Market Trends REPORT CONTENT GUIDE
DELIVERED CUSTOMIZATIONS
We have successfully delivered the following deep-dive customizations:
| CLIENT REQUEST | CUSTOMIZATION DELIVERED | VALUE ADDS |
|---|---|---|
| US-based HVAC Manufacturer |
|
|
| Europe-Based Air Purifier & Ventilation Company |
|
|
| Smart Building Technology Startup |
|
|
| US-based HVAC Raw Material Supplier |
|
|
| Commercial HVAC Customer |
|
|
RECENT DEVELOPMENTS
- June 2025 : DAIKIN INDUSTRIES, Ltd. (Japan) collaborated with Asuene Inc. (Japan). Through this collaboration, DAIKIN will integrate Asuene’s cloud-based CO2 emissions tracking and ESG management platform with its energy-efficient HVAC equipment and energy management systems.
- September 2024 : Carrier (US) partnered with Rewiring?America (US) to accelerate HVAC electrification through strategic retrofits and clean-energy adoption in some of the nation's most diverse communities, including pilot projects in Oregon, Wisconsin, Oklahoma, and Georgia.
- June 2024 : Trane Technologies plc (Ireland) collaborated with the US Department of Energy to complete its Residential Cold Climate Heat Pump (CCHP) Challenge. Their prototype heat pump, tested in a Boise, Idaho home over two winter and summer seasons, operated with backup electric strip heating only 10% of the time while delivering homeowners an average 15–20% energy bill savings.
- May 2024 : Lennox International Inc. (US) formed a joint venture with SAMSUNG (South Korea). This combines SAMSUNG’s 40 years of ductless and VRF HVAC innovation with Lennox’s robust North American distribution, offering both SAMSUNG-branded ductless AC, heat pump, and VRF systems and “Lennox powered by SAMSUNG” products sold through Lennox’s network.
Table of Contents
 Exclusive indicates content/data unique to MarketsandMarkets and not available with any competitors.
Methodology
The research process for this study included systematic gathering, recording, and analysis of data about customers and companies operating in the HVAC system market. This process involved the extensive use of secondary sources, directories, and databases (Factiva and Oanda) to identify and collect valuable information for the comprehensive, technical, market-oriented, and commercial study of the HVAC system market. In-depth interviews were conducted with primary respondents, including experts from core and related industries and preferred manufacturers, to obtain and verify critical qualitative and quantitative information and assess growth prospects. Key players in the HVAC system market were identified through secondary research, and their market rankings were determined through primary and secondary research. This research included studying annual reports of top players and interviewing key industry experts such as CEOs, directors, and marketing executives.
Secondary Research
Various sources were used in the secondary research process to identify and collect information important for this study. These include company annual reports, press releases, investor presentations, white papers, technology journals, certified publications, articles by recognized authors, directories, and databases.
Secondary research was mainly used to obtain key information about the industry’s value chain, the total pool of market players, the market classification according to industry trends to the bottom-most level, regional markets, and key developments from market and technology-oriented perspectives.
Primary Research
Primary research was also conducted to identify the segmentation types, key players, competitive landscape, and key market dynamics, such as drivers, restraints, opportunities, challenges, and industry trends, along with key strategies adopted by players operating in the HVAC system market. Extensive qualitative and quantitative analyses were performed on the complete market engineering process to list key information and insights throughout the report.
Extensive primary research has been conducted after acquiring knowledge about the HVAC system market scenarios through secondary research. Several primary interviews have been conducted with experts from the demand (end user and region) and supply side (heating equipment, cooling equipment, ventilation equipment, implementation type, system type, technology) across four major geographic regions: North America, Europe, Asia Pacific, and RoW. Approximately 60% and 40% of the primary interviews were conducted from the supply and demand sides, respectively. These primary data have been collected through questionnaires, emails, and telephonic interviews.

Notes: The three tiers of the companies have been defined based on their total/segmental revenue as of 2024: Tier 1 = >USD 1 billion, Tier 2 = USD 1 billion–USD 500 million, and Tier 3 = USD 500 million.
‘Others’ include sales, marketing, and product managers.
To know about the assumptions considered for the study, download the pdf brochure
Market Size Estimation
In the complete market engineering process, top-down and bottom-up approaches and several data triangulation methods were implemented to estimate and validate the size of the HVAC system market and various other dependent submarkets. Key players in the market were identified through secondary research, and their market share in the respective regions was determined through primary and secondary research. This entire research methodology included the study of annual and financial reports of the top players, as well as interviews with experts (such as CEOs, VPs, directors, and marketing executives) for key insights (quantitative and qualitative).
All percentage shares, splits, and breakdowns were determined using secondary sources and verified through primary sources. All the possible parameters that affect the markets covered in this research study were accounted for, viewed in detail, verified through primary research, and analyzed to obtain the final quantitative and qualitative data. This data was consolidated and supplemented with detailed inputs and analysis from MarketsandMarkets and presented in this report.
HVAC System Market : Top-Down and Bottom-Up Approach

Data Triangulation
After arriving at the overall market size from the estimation process explained above, the total market has been split into several segments and subsegments. To complete the overall market engineering process and arrive at the exact statistics for all segments and subsegments, market breakdown and data triangulation procedures have been employed, wherever applicable. The data have been triangulated by studying various factors and trends from the demand and supply sides. Along with this, the market has been validated using the top-down and bottom-up approaches.
Market Definition
HVAC system (Heating, ventilation, and air conditioning) is a set of technologies designed to regulate indoor temperature, humidity, and air quality for homes, businesses, or industrial spaces. It includes equipment that controls air circulation, adjusts temperatures via heating and cooling, and ensures adequate ventilation.
It includes various components such as air conditioners, heat pumps, furnaces, ventilation systems, and associated controls and technologies. These components work together to maintain comfortable and healthy indoor environments. Factors like energy efficiency, regulatory standards, climate considerations, and the demand for improved indoor air quality drive the HVAC system market.
Key Stakeholders
- Component Manufacturers
- Government and Research Organizations
- HVAC System Providers
- HVAC Software and Service Providers
- Maintenance and Service Providers
- Original Equipment Manufacturers (OEMs)
- Professional Services/Solution Providers
- Research Institutions and Organizations
- System Integrators
Report Objectives
- To estimate and forecast the size of the HVAC system market, in terms of value, based on cooling equipment, heating equipment, ventilation equipment, technology, implementation type, service type, end user, and region
- To describe and forecast the market size, in terms of volume, based on cooling equipment, heating equipment, ventilation equipment, and region.
- To describe and forecast the market size, in terms of value, for four major regions—North America, Europe, Asia Pacific, and RoW
- To provide detailed information regarding major factors such as drivers, restraints, opportunities, and challenges influencing the market growth
- To provide a detailed overview of the value chain of the HVAC system market
- To strategically analyze micromarkets with regard to individual market trends, growth prospects, and contributions to the total market
- To strategically profile key players and comprehensively analyze their market position in terms of ranking and core competencies, along with a detailed competitive landscape for the market leaders
- To analyze major growth strategies such as product launches, expansions, joint ventures, agreements, and acquisitions adopted by the key market players to enhance their position in the market
- To analyze the AI impact on the HVAC system market
- To analyze the US tariff impact on the HVAC system market
Customization Options
With the given market data, MarketsandMarkets offers customizations according to the company’s specific needs. The following customization options are available for the report::
Key Questions Addressed by the Report
What is the current size of the global HVAC System market?
The global HVAC System market is valued at USD 299.28 billion in 2025 and is projected to reach USD 407.77 billion by 2030. (MarketsandMarkets)
What is the expected growth rate of the HVAC System market?
The market is expected to grow at a CAGR of 6.4% from 2025 to 2030, driven by rising demand for energy-efficient heating, cooling, and ventilation solutions across residential, commercial, and industrial sectors. (MarketsandMarkets)
What are the major growth drivers for the HVAC System market?
Key growth drivers include increasing demand for energy-efficient HVAC systems, growing construction activities, government incentives promoting sustainable buildings, rising focus on indoor air quality, and advancements in smart HVAC technologies. (MarketsandMarkets)
Which heating equipment segment leads the HVAC System market?
The heat pump segment held the largest share of the heating equipment market, accounting for approximately 50.6% revenue share, due to its high energy efficiency and growing adoption in sustainable building projects. (MarketsandMarkets)
Which cooling equipment segment dominates the HVAC industry?
Unitary air conditioners are expected to dominate the cooling equipment segment, supported by widespread use across residential and commercial applications and a projected CAGR of 5.3% through 2030. (MarketsandMarkets)
Which application segment holds the largest market share?
The commercial segment is expected to account for the largest market share during the forecast period, driven by increasing HVAC adoption in offices, healthcare facilities, airports, retail spaces, and educational institutions. (MarketsandMarkets)
Which region leads the global HVAC System market?
Asia Pacific is the largest and fastest-growing regional market. The region accounted for approximately 32.9% market share in 2025 and is expected to maintain strong growth due to urbanization, infrastructure expansion, and government energy-efficiency initiatives. (MarketsandMarkets)
What are the key trends shaping the HVAC System industry?
Major trends include smart HVAC adoption, IoT-enabled monitoring, AI-based energy management, sustainable refrigerants, variable refrigerant flow (VRF) systems, renewable-energy-powered HVAC solutions, and digital building automation systems. (MarketsandMarkets)
Who are the leading companies in the HVAC System market?
Key market participants include Daikin Industries, Carrier, Trane Technologies, LG Electronics, Midea, Mitsubishi Electric, and Panasonic Holdings Corporation. (MarketsandMarkets)
What is the future outlook for the HVAC System market?
The market outlook remains positive through 2030, supported by growing investments in green buildings, stricter energy-efficiency regulations, increasing cooling demand due to climate change, and the adoption of connected HVAC technologies. (MarketsandMarkets)
Need a Tailored Report?
Customize this report to your needs
Get 10% FREE Customization
Customize This ReportPersonalize This Research
- Triangulate with your Own Data
- Get Data as per your Format and Definition
- Gain a Deeper Dive on a Specific Application, Geography, Customer or Competitor
- Any level of Personalization
Let Us Help You
- What are the Known and Unknown Adjacencies Impacting the HVAC System Market
- What will your New Revenue Sources be?
- Who will be your Top Customer; what will make them switch?
- Defend your Market Share or Win Competitors
- Get a Scorecard for Target Partners

Custom Market Research Services
We Will Customise The Research For You, In Case The Report Listed Above Does Not Meet With Your Requirements
Get 10% Free CustomisationTESTIMONIALS

Tetsuya Ohhira
Business Development Manager-Technology Business
Nikon Corporation,
Leading Japanese MNC specializing in optics and imaging productswww.nikon.com
MarketsandMarkets™ response
is quick. Their attitude is flexible and positive. Analyst Insights are globally considered and
significant. Client Services quickly respond to our inquiry and demand. Their wide range of global
surveys help us make our strategic plan.
We hope Knowledge Store will be easier to search
for a report.
VP - Marketing & Business Development
Leading Provider of Process Control Solutions
We engaged with MarketsandMarkets on a study to perform an analysis and recommend a Go-To-Market strategy for metrology and process control in the semiconductor market. The study was tailored to our targets and needs with well-defined milestones. Our overall experience with the MarketsandMarkets team was very good throughout the project in all aspects including the analysis methodologies used, the quality and depth of primary and secondary data sets, the professionalism and flexibility of the team and the ability to meet the target schedule and milestones. We want to thank MarketsandMarkets team for a job well done.
Growth opportunities and latent adjacency in HVAC System Market


John
Apr, 2026
Does the report include detailed analysis of different HVAC system types (split AC, VRF, chillers, etc.)?.
Clyde
Apr, 2026
I like how the report differentiates between residential, commercial, and industrial applications..
Vasiliy
Apr, 2022
Do you have Saudi Arabia market data in addition to global market data? We are interested in the following information in relation to Saudi Arabia market: - Trends - Market size in value / volume by segments - Details about leading players - Consumers .
V
May, 2020
what is the market size for India in Domestic (Window Air conditioners, Split AC and Refrigerator)? What is the market size for central plants in INDIA?.