Heat-Shrink Tubing Market by Voltage (Low, Medium, and High), Material (Polyolefin, Polytetrafluoroethylene, Fluorinated Ethylene Propylene), End-User (Utilities, Chemical, Automotive, Food & Beverage), Region - Global Forecast to 2024


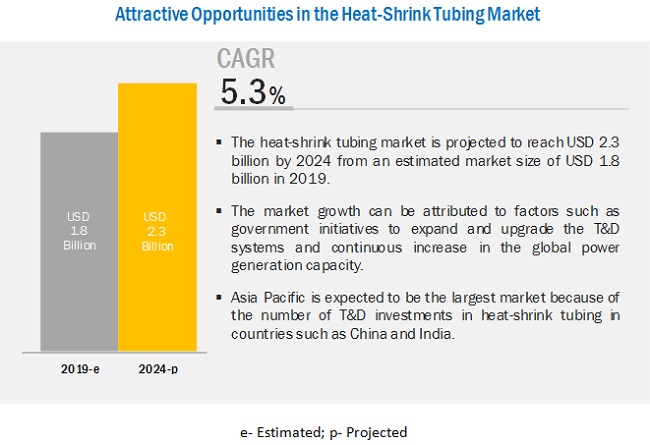
[127 Pages Report] The heat-shrink tubing market is projected to reach USD 2.3 billion by 2024 from an estimated USD 1.8 billion in 2019, at a CAGR of 5.3% during the forecast period. Government initiatives to expand and upgrade the T&D systems and continuous improvements in the global power generation capacity are the factors likely to drive this market.
The low voltage segment is expected to be the largest contributor to the heat-shrink tubing market, by voltage, during the forecast period
The heat-shrink tubing market, by voltage, is segmented into low voltage, medium voltage, and high voltage. The low voltage segment is projected to hold the largest market share by 2024. A heat-shrink tube, used in low voltage cables, is an essential component for the distribution of electricity in the 1–1.1 kV voltage range. Growing usage of heat-shrinkable tubes for insulation and sealing cables is expected to foster its demand in the market.
The polyolefin segment is expected to be the fastest growing heat-shrink tubing market during the forecast period
The heat-shrink tubing market, by material, is segmented into polyolefin, Polytetrafluoroethylene (PTFE), Fluorinated Ethylene Propylene (FEP), Perfluoroalkoxy Alkane (PFA), Ethylene Tetrafluoroethylene (ETFE), and others. The polyolefin segment brings in more revenue than the other segments and therefore constitutes a higher share of the market. Polyolefin material is highly resistant to flame and abrasions, extremely flexible, and has excellent chemical, physical, and electrical properties. The aerospace and military industries use cross-linked polyolefin because of its flame-retardant or nonflammable properties, which is likely to boost its demand in the market.
The utilities segment is expected to be the largest heat-shrink tubing market, by end-user, during the forecast period
The heat-shrink tubing market has been categorized, on the basis of end-users, into utilities, automotive, food & beverage, chemical, and others (healthcare and military & aerospace). Protection for wires and cables against harmful environmental elements and investments in the T&D infrastructure are expected to drive the market.
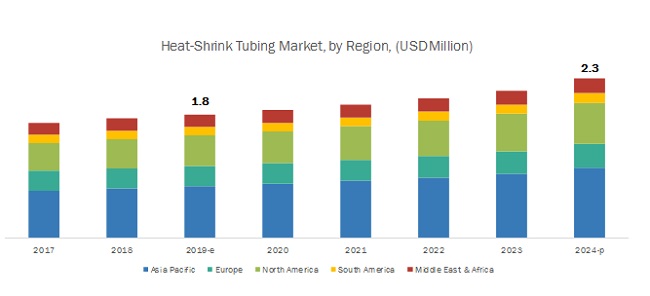
Asia Pacific is expected to be the largest heat-shrink tubing market during the forecast period
In this report, the heat-shrink tubing market has been analyzed with respect to 5 regions, namely, North America, Europe, South America, Asia Pacific, and the Middle East & Africa. Asia Pacific is estimated to be the largest market from 2019 to 2024. Government initiatives to expand and upgrade T&D systems and continuous increase in the global power generation capacity would also boost the demand for the market globally. Asia Pacific was also the fastest growing market in 2018. China and India are expected to grow at a fast pace during the forecast period.
Key Market Players
The major players in the heat-shrink tubing market are TE Connectivity (Switzerland), 3M (US), Sumitomo Electric (Japan), ABB (Switzerland), HellermannTyton (West Sussex), Alpha Wire (US), Woer (China), Qualtek (US), Panduit (US), Zeus (US), Guanghai Materials (China), Thermosleeve (US), Insultab (US), Dasheng Heat Shrinkable Material (China), and Changchun Heat Shrinkable Materials (China).
TE Connectivity (Switzerland) is a key player in this segment. It operates through 3 business segments, namely, transportation solutions, industrial solutions, and communications solutions. The company offers heat-shrink tubing through all the 3 business segments. The transportation solutions business segment caters to the end markets such as automotive, commercial transportation, and sensors. The industrial solutions business segment caters to aerospace, defense, oil & gas, and energy industries. The communications solutions business segment caters to the end markets such as data & devices and appliances. The company actively focuses on both organic and inorganic strategies to increase its global market share. For instance, in March 2019, TE Connectivity introduced its BATTU heat-shrink tubing for its applications in industrial and commercial vehicles, construction equipment, and generator sets. TE Connectivity caters to various end-users such as utilities, automotive, medical, and defense with different materials of heat-shrinkable tubes such as PTFE, FPE, PFA, ETFE, and PET, which is a differentiating factor to increase the company’s footprint in the heat-shrink tubing market.
Scope of the Report
|
Report Metric |
Details |
|
Market size available for years |
2017–2024 |
|
Base year considered |
2018 |
|
Forecast period |
2019–2024 |
|
Forecast units |
Value (USD) |
|
Segments covered |
Voltage, Material, End-User, and Region |
|
Geographies covered |
Asia Pacific, North America, Europe, the Middle East & Africa, and South America |
|
Companies covered |
TE Connectivity (Switzerland), 3M (US), Sumitomo Electric (Japan), ABB (Switzerland), HellermannTyton (West Sussex), Alpha Wire (US), Woer (China), Qualtek (US), Panduit (US), Zeus (US), Guanghai Materials (China), Thermosleeve (US), Insultab (US), Dasheng Heat Shrinkable Material (China), and Changchun Heat Shrinkable Materials (China) |
This research report categorizes the heat-shrink tubing market by voltage, material, end-user, and region.
by voltage:
- Low Voltage
- Medium Voltage
- High Voltage
by material:
- Polyolefin
- Polytetrafluoroethylene
- Fluorinated Ethylene Propylene
- Perfluoroalkoxy Alkane
- Ethylene Tetrafluoroethylene
- Others
Note: Others includes Polyether Ether Ketone (PEEK) and Polyethylene Terephthalate (PET).
by end-user:
- Utilities
- Chemical
- Automotive
- Food & Beverage
- Others*
Note: Others includes healthcare and aerospace & military industries.
by Region:
- Asia Pacific
- North America
- Europe
- Middle East & Africa
- South America
Recent Developments
- In March 2019, TE Connectivity introduced its BATTU heat-shrink tubing, a dual-wall, fire-retardant product intended for battery/power cable to terminal applications in industrial and commercial vehicles, construction equipment, and generator sets. The BATTU tubing products provide excellent performance in harsh environments, with a 2:1 shrink ratio.
Key Questions Addressed by the Report
- Which revolutionary technology trends are expected over the next 5 years?
- Which heat-shrink tubing market elements are likely to lead by 2024?
- Which voltage segment is expected to get the maximum growth opportunity during the forecast period?
- Which region is expected to lead in terms of the highest market share by 2024?
- How are companies using heat-shrinkable tubes in different applications?
To speak to our analyst for a discussion on the above findings, click Speak to Analyst
 Exclusive indicates content/data unique to MarketsandMarkets and not available with any competitors.
Table of Contents
1 Introduction (Page No. - 15)
1.1 Objectives of the Study
1.2 Definition
1.3 Market Scope
1.3.1 Market Segmentation
1.3.2 Regional Scope
1.4 Years Considered for the Study
1.5 Currency
1.6 Limitations
1.7 Stakeholders
2 Research Methodology (Page No. - 18)
2.1 Scope
2.2 Market Size Estimation
2.2.1 Demand-Side Analysis
2.2.1.1 Assumptions
2.2.2 Supply-Side Analysis
2.2.2.1 Calculation
2.2.3 Forecast
2.3 Some of the Insights of Industry Experts
3 Executive Summary (Page No. - 22)
4 Premium Insights (Page No. - 26)
4.1 Attractive Opportunities in the Heat-Shrink Tubing Market
4.2 Market, By Voltage
4.3 Market, By Material
4.4 Market, By End-User
4.5 Market, By Region
5 Market Overview (Page No. - 29)
5.1 Introduction
5.2 Market Dynamics
5.2.1 Drivers
5.2.1.1 Government Initiatives to Expand and Upgrade T&D Systems
5.2.1.2 Continuous Increase in the Global Power Generation Capacity
5.2.2 Restraints
5.2.2.1 Government Regulations on the Emission of Toxic Gases
5.2.3 Opportunities
5.2.3.1 Growing Usage of Heat-Shrink Tubes in the Automotive Industry
5.2.4 Challenges
5.2.4.1 Availability of Low-Quality and Inexpensive Products in the Gray Market
5.2.4.2 Improper Installation of Heat-Shrink Tubes
6 Heat-Shrink Tubing Market, By Voltage (Page No. - 34)
6.1 Introduction
6.2 Low Voltage
6.2.1 Growing Usage of Heat-Shrinkable Tubes for Insulation and Sealing Cables is Expected to Foster Their Demand
6.3 Medium Voltage
6.3.1 Use of Heat-Shrink Tubes for Insulation Purposes in Terminations and Joints is Likely to Fuel the Market
6.4 High Voltage
6.4.1 High Demand for Heat-Shrinkable Tubes for Improving Long-Distance T&D Infrastructure is Likely to Boost the Market
7 Heat-Shrink Tubing Market, By Material (Page No. - 39)
7.1 Introduction
7.2 Polyolefin
7.2.1 Flame-Retardant Property of Polyolefin Heat-Shrink Tubing are Expected to Foster Its Demand
7.3 Polytetrafluoroethylene (PTFE)
7.3.1 Growing Usage of PTFE Heat-Shrinkable Tube in Medical Equipment is Likely to Foster the Market
7.4 Fluorinated Ethylene Propylene (FEP)
7.4.1 High Demand for FEP Heat-Shrinkable Tube in Food & Beverage Industry is Likely to Foster the Market
7.5 Perfluoroalkoxy Alkane (PFA)
7.5.1 High-Temperature Resistant Property of PFA is Likely to Foster Its Demand in the Market
7.6 Ethylene Tetrafluoroethylene (ETFE)
7.6.1 Abrasion and Crush-Resistance Property of ETFE and Its Low Cost are Likely to Boost Its Demand
7.7 Others
8 Heat-Shrink Tubing Market, By End-User (Page No. - 46)
8.1 Introduction
8.2 Utilities
8.2.1 Protection for Wires & Cables Against Harmful Environmental Elements and Investments in the T&D Infrastructure are Expected to Drive the Market
8.3 Automotive
8.3.1 Government Regulations Mandating the Use of Biodegradable Automotive Components and Increasing Investments in the Automotive Sector are Likely to Drive the Market
8.4 Food & Beverage
8.4.1 Usage of Heat-Shrinkable Tubes for Fungus, Moisture, and Uv Resistance to Maintain High-Quality Materials is Likely to Foster the Market
8.5 Chemical
8.5.1 Increasing Demand for Thin, Highly Abrasive, and Chemically Resilient Tubings in the Chemical Industry is Likely to Boost the Market
8.6 Others
9 Heat-Shrink Tubing Market, By Region (Page No. - 52)
9.1 Introduction
9.2 Asia Pacific
9.2.1 By Voltage
9.2.2 By Material
9.2.3 By End-User
9.2.4 By Country
9.2.4.1 China
9.2.4.1.1 Investments in the Modernization of the Aging Electrical Grid and Government Initiatives to Reduce T&D Losses are Expected to Drive the Market
9.2.4.2 India
9.2.4.2.1 Rising Investments in the T&D Infrastructure Development are Expected to Dominate the Indian Market
9.2.4.3 Japan
9.2.4.3.1 Rising Investments in Electric Vehicles are Expected to Drive the Market
9.2.4.4 South Korea
9.2.4.4.1 Increasing Focus on Renewable Energy Generation and Carbon Footprint Reduction is A Major Driver for the Market
9.2.4.5 Australia
9.2.4.5.1 Increasing Investments in Renewables, Distribution Infrastructure, and Connectivity are Expected to Drive the Market
9.2.4.6 Rest of Asia Pacific
9.3 North America
9.3.1 By Voltage
9.3.2 By Material
9.3.3 By End-User
9.3.4 By Country
9.3.4.1 US
9.3.4.1.1 Investments in Grid Modernization of Aging Infrastructure are Expected to Increase the Demand for the US Market
9.3.4.2 Canada
9.3.4.2.1 Energy-Efficiency and Optimization Services are Expected to Dominate the Market
9.3.4.3 Mexico
9.3.4.3.1 Increasing Investments to Support Energy Infrastructure Growth and Rising Demand for Renewables are Likely to Drive the Market
9.4 Europe
9.4.1 By Voltage
9.4.2 By Material
9.4.3 By End-User
9.4.4 By Country
9.4.4.1 Germany
9.4.4.1.1 Need to Integrate Renewable Energy Sources and Government Initiatives to Support Feed-In Tariff Incentives are Driving the Market
9.4.4.2 Russia
9.4.4.2.1 Strong Investments in the T&D Infrastructure are Expected to Drive the Market
9.4.4.3 UK
9.4.4.3.1 Increasing Investments in the Power Infrastructure Sector and Renewable Energy Projects are Likely to Drive the Market
9.4.4.4 France
9.4.4.4.1 Utilities Segment is Expected to Dominate the French Market
9.4.4.5 Italy
9.4.4.5.1 Development of the Sustainable Energy Sector and Need to Reduce Energy Costs are Driving the Market
9.4.4.6 Rest of Europe
9.5 South America
9.5.1 By Voltage
9.5.2 By Material
9.5.3 By End-User
9.5.4 By Country
9.5.4.1 Brazil
9.5.4.1.1 Government Initiatives to Invest in Utility Projects are Driving the Market
9.5.4.2 Argentina
9.5.4.2.1 Utilities Segment is Expected to Dominate the Market
9.5.4.3 Venezuela
9.5.4.3.1 Rising Investments in Power Generation are Expected to Boost the Demand for the Market
9.5.4.4 Rest of South America
9.6 Middle East & Africa
9.6.1 By Voltage
9.6.2 By Material
9.6.3 By End-User
9.6.4 By Country
9.6.4.1 South Africa
9.6.4.1.1 Rapidly Growing Manufacturing and Transportation Industries are Expected to Drive the Market
9.6.4.2 Saudi Arabia
9.6.4.2.1 Increasing Investments in the T&D Infrastructure are Expected to Drive the Market in the Country
9.6.4.3 UAE
9.6.4.3.1 Growing Investments in Renewables are Likely to Increase the Demand for the UAE Market
9.6.4.4 Rest of Middle East & Africa
10 Competitive Landscape (Page No. - 88)
10.1 Introduction
10.2 Market Share Analysis
10.3 Competitive Scenario
10.3.1 New Product Launches
10.3.2 Contracts & Agreements
10.3.3 Investments & Expansions
10.4 Competitive Leadership Mapping
10.4.1 Visionary Leaders
10.4.2 Innovators
10.4.3 Dynamic Differentiators
10.4.4 Emerging Companies
11 Company Profile (Page No. - 94)
11.1 ABB
(Business Overview, Products Offered, Recent Developments, MnM View)*
11.2 3M
11.3 TE Connectivity
11.4 Sumitomo Electric
11.5 Hellermanntyton
11.6 Alpha Wire
11.7 Qualtek
11.8 Insultab
11.9 Woer
11.10 Guanghai Materials
11.11 Changchun Heat Shrinkable Materials
11.12 Dasheng Heat Shrinkable Material
*Details on Business Overview, Products Offered, Recent Developments, MnM View Might Not Be Captured in Case of Unlisted Companies.
12 Appendix (Page No. - 120)
12.1 Insights of Industry Experts
12.2 Discussion Guide
12.3 Knowledge Store: Marketsandmarkets’ Subscription Portal
12.4 Available Customizations
12.5 Related Reports
12.6 Author Details
List of Tables (65 Tables)
Table 1 Annual Additions in Transmission Lines & Distribution Lines and Investments in Major End-User Industries are the Determining Factors for the Global Heat-Shrink Tubing Market
Table 2 Market Snapshot
Table 3 Global T&D Infrastructure Expansion Plans
Table 4 Market Size, By Voltage, 2017–2024 (USD Million)
Table 5 Low Voltage: Market Size, By Region, 2017–2024 (USD Million)
Table 6 Medium Voltage: Market Size, By Region, 2017–2024 (USD Million)
Table 7 High Voltage: Market Size, By Region, 2017–2024 (USD Million)
Table 8 Market Size, By Material, 2017–2024 (USD Million)
Table 9 Polyolefin: Market Size, By Region, 2017–2024 (USD Million)
Table 10 Polytetrafluoroethylene (PTFE): Market Size, By Region, 2017–2024 (USD Million)
Table 11 Fluorinated Ethylene Propylene (FEP): Market Size, By Region, 2017–2024 (USD Million)
Table 12 Perfluoroalkoxy Alkane (PFA): Market Size, By Region, 2017–2024 (USD Million)
Table 13 Ethylene Tetrafluoroethylene (ETFE): Market Size, By Region, 2017–2024 (USD Million)
Table 14 Others: Market Size, By Region, 2017–2024 (USD Million)
Table 15 Market Size, By End-User, 2017–2024 (USD Million)
Table 16 Utilities: Market Size, By Region, 2017–2024 (USD Million)
Table 17 Automotive: Market Size, By Region, 2017–2024 (USD Million)
Table 18 Food & Beverage: Market Size, By Region, 2017–2024 (USD Million)
Table 19 Chemical: Market Size, By Region, 2017–2024 (USD Million)
Table 20 Others: Market Size, By Region, 2017–2024 (USD Million)
Table 21 Market Size, By Region, 2017–2024 (USD Million)
Table 22 Asia Pacific: Market Size, By Voltage, 2017–2024 (USD Million)
Table 23 Asia Pacific: Market Size, By Material, 2017–2024 (USD Million)
Table 24 Asia Pacific: Market Size, By End-User, 2017–2024 (USD Million)
Table 25 Asia Pacific: Market Size, By Country, 2017–2024 (USD Million)
Table 26 China: Market Size, By End-User, 2017–2024 (USD Million)
Table 27 India: Market Size, By End-User, 2017–2024 (USD Million)
Table 28 Japan: Market Size, By End-User, 2017–2024 (USD Million)
Table 29 South Korea: Market Size, By End-User, 2017–2024 (USD Thousand)
Table 30 Australia: Market Size, By End-User, 2017–2024 (USD Thousand)
Table 31 Rest of Asia Pacific: Market Size, By End-User, 2017–2024 (USD Thousand)
Table 32 North America: Market Size, By Voltage, 2017–2024 (USD Million)
Table 33 North America: Market Size, By Material, 2017–2024 (USD Million)
Table 34 North America: Market Size, By End-User, 2017–2024 (USD Million)
Table 35 North America: Market Size, By Country, 2017–2024 (USD Million)
Table 36 US: Market Size, By End-User, 2017–2024 (USD Million)
Table 37 Canada: Market Size, By End-User, 2017–2024 (USD Thousand)
Table 38 Mexico: Market Size, By End-User, 2017–2024 (USD Thousand)
Table 39 Europe: Market Size, By Voltage, 2017–2024 (USD Million)
Table 40 Europe: Market Size, By Material, 2017–2024 (USD Thousand)
Table 41 Europe: Market Size, By End-User, 2017–2024 (USD Million)
Table 42 Europe: Market Size, By Country, 2017–2024 (USD Million)
Table 43 Germany: Market Size, By End-User, 2017–2024 (USD Thousand)
Table 44 Russia: Market Size, By End-User, 2017–2024 (USD Thousand)
Table 45 UK: Market Size, By End-User, 2017–2024 (USD Thousand)
Table 46 France: Market Size, By End-User, 2017–2024 (USD Thousand)
Table 47 Italy: Market Size, By End-User, 2017–2024 (USD Thousand)
Table 48 Rest of Europe: Market Size, By End-User, 2017–2024 (USD Thousand)
Table 49 South America: Market Size, By Voltage, 2017–2024 (USD Thousand)
Table 50 South America: Market Size, By Material, 2017–2024 (USD Thousand)
Table 51 South America: Market Size, By End-User, 2017–2024 (USD Thousand)
Table 52 South America: Market Size, By Country, 2017–2024 (USD Million)
Table 53 Brazil: Market Size, By End-User, 2017–2024 (USD Thousand)
Table 54 Argentina: Market Size, By End-User, 2017–2024 (USD Thousand)
Table 55 Venezuela: Market Size, By End-User, 2017–2024 (USD Thousand)
Table 56 Rest of South America: Market Size, By End-User, 2017–2024 (USD Thousand)
Table 57 Middle East & Africa: Market Size, By Voltage, 2017–2024 (USD Million)
Table 58 Middle East & Africa: Market Size, By Material, 2017–2024 (USD Million)
Table 59 Middle East & Africa: Market Size, By End-User, 2017–2024 (USD Thousand)
Table 60 Middle East & Africa: Market Size, By Country, 2017–2024 (USD Million)
Table 61 South Africa: Market Size, By End-User, 2017–2024 (USD Thousand)
Table 62 Saudi Arabia: Market Size, By End-User, 2017–2024 (USD Thousand)
Table 63 UAE: Market Size, By End-User, 2017–2024 (USD Thousand)
Table 64 Rest of Middle East & Africa: Market Size, By End-User, 2017–2024 (USD Thousand)
Table 65 Developments of Key Players in the Market, January 2016–April 2019
List of Figures (25 Figures)
Figure 1 Low Voltage Segment is Expected to Lead the Market, By Voltage, During the Forecast Period
Figure 2 Polyolefin Segment is Expected to Lead the Market, By Material, During the Forecast Period
Figure 3 Utilities Segment is Expected to Lead the Market, End-User, During the Forecast Period
Figure 4 Asia Pacific Dominated the Market (In Terms of Market Share) in 2018
Figure 5 Government Initiatives to Expand and Upgrade T&D Systems and Continuous Increase in the Global Power Generation Capacity are Driving the Market, 2019–2024
Figure 6 Low Voltage Segment Dominated the Market in 2018
Figure 7 Polyolefin Segment Dominated the Market in 2018
Figure 8 Utilities Segment Dominated the Market in 2018
Figure 9 Asia Pacific Market is Expected to Grow at the Highest CAGR During the Forecast Period
Figure 10 Market: Drivers, Restraints, Opportunities, and Challenges
Figure 11 Net Electricity Generation, Organisation for Economic Co-Operation and Development (OECD) vs Non Organisation for Economic Co-Operation and Development (Non-OECD) Economies
Figure 12 Low Voltage Segment Accounted for the Largest Market Share in 2018
Figure 13 Polyolefin Segment Accounted for the Largest Market Share in 2018
Figure 14 Utilities Segment Accounted for the Largest Market Share in 2018
Figure 15 Regional Snapshot: Asia Pacific Market is Expected to Grow at the Highest CAGR During the Forecast Period
Figure 16 Market Share, By Region, 2018
Figure 17 Asia Pacific: Regional Snapshot
Figure 18 North America: Regional Snapshot
Figure 19 Key Developments in the Market During January 2016–July 2019
Figure 20 Market Share Analysis, 2018
Figure 21 Market Competitive Leadership Mapping
Figure 22 ABB: Company Snapshot
Figure 23 3M: Company Snapshot
Figure 24 TE Connectivity: Company Snapshot
Figure 25 Sumitomo Electric: Company Snapshot
This study involved 4 major activities in estimating the current size of the heat-shrink tubing market. Exhaustive secondary research was done to collect information on the market, peer market, and parent market. The next step was to validate these findings, assumptions, and market sizing with industry experts across the value chain through rigorous primary research. Both top-down and bottom-up approaches were used to estimate the total market size. The market breakdown and data triangulation techniques were employed to estimate the market size of the segments and the corresponding subsegments.
Secondary Research
This research study involved the use of extensive secondary sources, directories, and databases such as UNCTAD data, industry publications, several newspaper articles, Statista Industry Journal, Factiva, and heat-shrink tubing journal to identify and collect information useful for a technical, market-oriented, and commercial study of the market. The other secondary sources included annual reports, press releases & investor presentations of companies, white papers, certified publications, articles by recognized authors, manufacturer associations, trade directories, and databases.
Primary Research
The market comprises several stakeholders such as companies related to the industry, consulting companies in the energy & power sector, power generation companies, government & research organizations, organizations, forums, alliances & associations, heat-shrink tubing providers, state & national utility authorities, heat-shrink tubing manufacturers, dealers & suppliers, and vendors. The demand-side of the market is characterized by the transmission lines and distribution lines’ additions across regions; investments by key end-users such as utilities, renewables, transportation, and data centers; and increasing demand for reliable and resilient power supply worldwide. Moreover, the demand is also driven by increasing investments in electrification projects and power generation projects generated from renewable sources across the globe. The supply-side is characterized by rising demand for contracts & agreements and mergers & acquisitions among big players. Various primary sources from both the supply and demand sides of the market were interviewed to obtain qualitative and quantitative information. The breakdown of primary respondents is given below:
To know about the assumptions considered for the study, download the pdf brochure
Market Size Estimation
Both top-down and bottom-up approaches have been used to estimate and validate the size of the global heat-shrink tubing market and its dependent submarkets. These methods were also extensively used to estimate the size of various subsegments in the market. The research methodology used to estimate the market size includes the following:
- The key players in the industry and market have been identified through extensive secondary research, and their market share in the respective regions have been determined through both primary and secondary research.
- The industry’s supply chain and market size, in terms of value, have been determined through primary and secondary research processes.
- All percentage shares, splits, and breakdowns have been determined using secondary sources and verified through primary sources.
Data Triangulation
After arriving at the overall market size—using the market size estimation processes as explained above—the market was split into several segments and subsegments. To complete the entire market engineering process and arrive at the exact statistics of each market segment and subsegment, the data triangulation and market breakdown procedures were employed, wherever applicable. The data was triangulated by studying various factors and trends from both the demand and supply sides in the heat-shrink tubing sector.
Report Objectives
- To define, describe, segment, and forecast the market by material, voltage, end-user, and region
- To provide detailed information on the major factors influencing the growth of the market (drivers, restraints, opportunities, and industry-specific challenges)
- To strategically analyze the market with respect to individual growth trends, future expansions, and contribution of each segment to the market
- To analyze the market opportunities for stakeholders and details of the competitive landscape for market leaders
- To forecast the growth of the market with respect to 5 main regions, namely, North America, Asia Pacific, Europe, South America, and the Middle East & Africa
- To profile and rank key players and comprehensively analyze their respective market share
- To analyze competitive developments such as contracts & agreements, investments & expansions, new product launches, and mergers & acquisitions in the market
Available Customizations:
With the given market data, MarketsandMarkets offers customizations as per the client’s specific needs. The following customization options are available for this report:
Regional Analysis
Further breakdown of region or country-specific analysis
Company Information
Detailed analysis and profiling of additional market players (up to 5)


Growth opportunities and latent adjacency in Heat-Shrink Tubing Market