PTFE Market

PTFE Market by Form, Application, End-use Industry (Chemical & Industrial Processing, Automotive & Aerospace, Electrical & Electronics, Building & Construction, Consumer Goods), and Region - Global Forecast to 2031




OVERVIEW
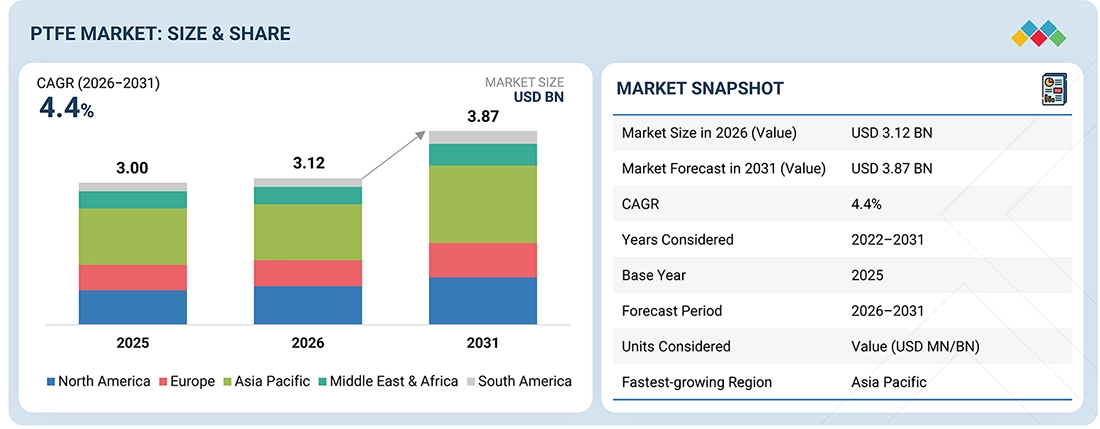
Source: Secondary Research, Interviews with Experts, MarketsandMarkets Analysis
The PTFE market size is projected to grow from USD 3.12 billion in 2026 to USD 3.87 billion by 2031, registering a CAGR of 4.4% during the forecast period. The PTFE market is anticipated to show consistent growth during the forecast period owing to increased demand for high-performing materials in several industry segments, such as automotive, electrical & electronics, chemical processing, healthcare, and aerospace. The use of PTFE is popular owing to its high degree of chemical resistance, thermal stability, low coefficient of friction, and electrical insulation properties, which make it suitable for challenging environments. The rise in use of electric vehicles, semiconductor production, and industrial processing is likely to fuel the demand for PTFE parts and products such as PTFE parts, coatings, seals, gaskets, and wire & cable insulation. Besides, investments in renewable energy, chemical processing plants, and the need for durable materials have been contributing to the growth of the PTFE market.
KEY TAKEAWAYS
-
By RegionAsia Pacific dominated the PTFE market, with a share of 50.5%, in terms of value, in 2025.
-
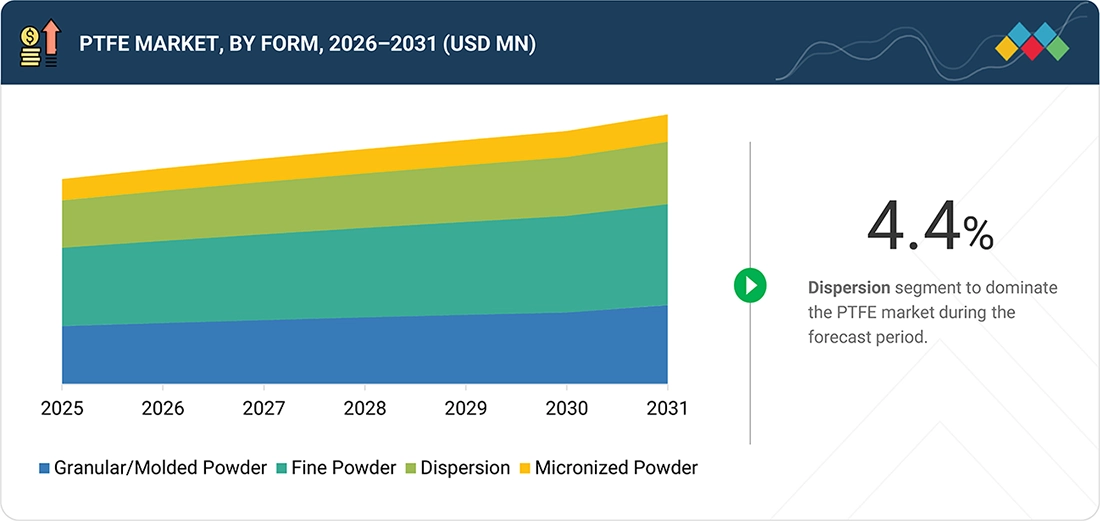
By FormThe fine powder segment dominated the PTFE market with a share of 38.1%, in terms of value, in 2025.
-
By ApplicationBased on technology, the films segment is projected to register the highest CAGR of 4.9% in the PTFE market during the forecast period.
-
By End-Use IndustryThe chemical & industrial processing segment held the largest market share of 60.5%, in terms of value, in 2025.
-
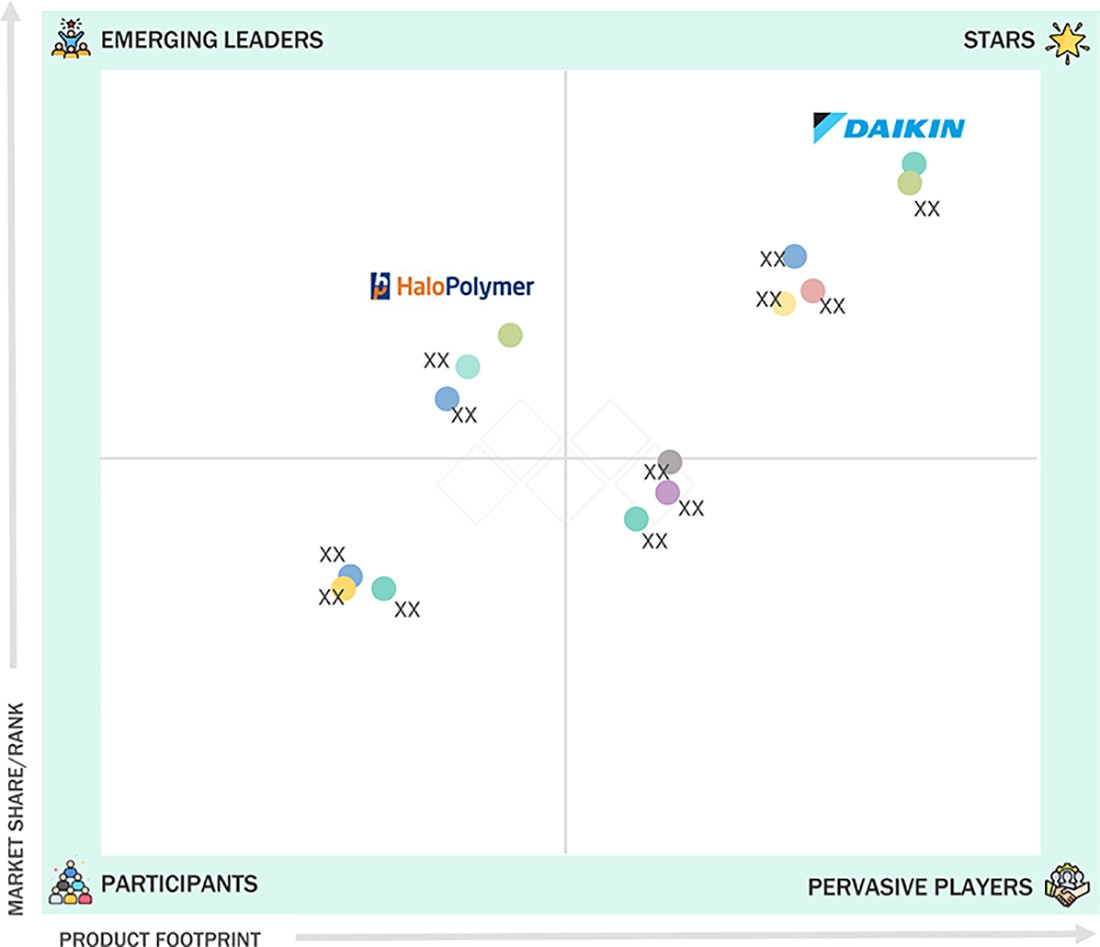
COMPETITIVE LANDSCAPE- KEY PLAYERSCompanies such as Daikin Industries, Ltd., Dongyue Group, and Gujarat Fluorochemicals Limited were identified as star players in the PTFE market, given their strong market share and product footprint.
-
COMPETITIVE LANDSCAPE- STARTUPSFreudenberg FST GmbH, Everflon Fluoropolymers, and Fluorocarbon Group, among others, have distinguished themselves among startups and SMEs by securing strong footholds in specialized niche areas, underscoring their potential as emerging market leaders.
Several factors contribute to the steady growth of the PTFE market. Key among these is the increasing demand for high-performance products that can withstand high temperatures, chemicals, and corrosion. Industrialization, along with the use of PTFE in industries such as chemical processing, electrical and electronics, automotive, healthcare, and aerospace, has significantly boosted its consumption. There is an increased manufacture of electric automobiles, semiconductor elements, and industrial machinery. This has increased the need for PTFE because of its properties such as good electrical insulation, low coefficient of friction, and good chemical resistance. In addition, increasing investment in renewable energy infrastructure and chemical processing plants has created opportunities in the PTFE market for seals, gaskets, coatings, and wire and cable insulation.
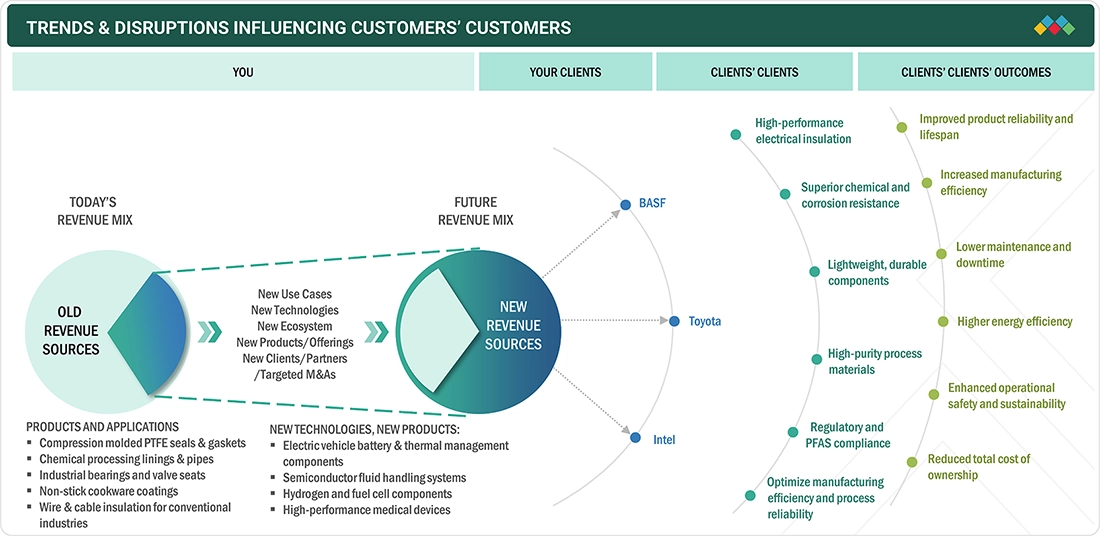
TRENDS & DISRUPTIONS IMPACTING CUSTOMERS' CUSTOMERS
The PTFE industry is experiencing healthy growth due to rising demand for high-end materials with high chemical resistance, high thermal stability, and excellent electrical insulating properties. PTFE applications are growing in electric vehicles, the semiconductor industry, renewable energy products, chemical processing plants, medical devices, and the aerospace sector, where reliable performance in extreme conditions is important. Recent advancements in modified PTFE, filled PTFE compounds, and innovative processing techniques are enhancing the wear resistance, strength, and flexibility of PTFE. These improvements are making production processes more efficient. Additionally, environmental regulations regarding fluorine-containing compounds, sustainability concerns, and the volatility of fluorspar prices are becoming significant factors influencing market development. Companies are making efforts toward cleaner technologies, recycling programs, and innovative fluoropolymer products to comply with regulatory demands and changing customer expectations. Ongoing developments in high-end applications are providing opportunities for growth in the PTFE market.
Source: Secondary Research, Interviews with Experts, MarketsandMarkets Analysis
MARKET DYNAMICS

Level
-
Accelerating Electric Vehicle Adoption and Energy Transition Driving Multi-Point PTFE Demand

-
Semiconductor Industry Boom and Escalating Demand for Ultra-High-Purity PTFE


Level
-
Regulatory Overhang: PFAS Classification and Evolving Restriction Frameworks

-
Geographic Supply Concentration and Fluorspar Feedstock Vulnerability


Level
-
Growing Demand from Electric Vehicles and Semiconductor Manufacturing

-
Rising Adoption in Renewable Energy and Hydrogen Infrastructure


Level
-
Escalating PFAS Regulatory Scrutiny and Compliance Complexity

-
Fluorspar Supply Concentration and Raw Material Price Volatility

Source: Secondary Research, Interviews with Experts, MarketsandMarkets Analysis
Driver: Accelerating Electric Vehicle Adoption and Energy Transition Driving Multi-Point PTFE Demand
The rise in the use of electric vehicles and the overall trend toward green energy are key factors driving PTFE market growth. PTFE is one of the most valuable materials due to its unique properties such as electrical insulation, great dielectric strength, chemical inertness, and heat resistance at temperatures over 260°C. In electric vehicles, PTFE is widely used in the insulation of high-voltage wires and cables, battery seals and gaskets, fuel cell technology, thermal management systems, and connectors. At the same time, rising investments in the installation of solar photovoltaic systems, hydrogen generation, energy storage solutions, and wind farms contribute to the growing demand for PTFE components able to operate in adverse conditions. Other important stimuli that contribute to the increase in PTFE consumption include government support of vehicle electrification, strict emission requirements, and investments in infrastructure for charging electric cars. Furthermore, the low friction coefficient and chemical weather resistance of PTFE make it appropriate for the application in various environments.
Restraint: Regulatory Overhang: PFAS Classification and Evolving Restriction Frameworks
One of the main factors that limit the potential of the PTFE market is the ever-changing regulatory environment for per- and polyfluoroalkyl substances (PFAS). Although PTFE is considered a relatively stable, high-molecular fluoropolymer with low bioavailability, its assessment is based on broader PFAS regulation initiatives developed in different regions, including Europe and North America. Possible limitations and bans under the ECHA PFAS proposal are creating confusion about further production, distribution, and application of various fluoropolymers. Manufacturers of PTFE materials have to spend significant sums on regulatory compliance, environmental monitoring and control, emissions management, product stewardship, and documentation. Thus, the emerging PFAS regulations increase costs and might lead to delays in investments in plant expansion and innovation projects. Consumers' concerns about fluorinated products drive them to seek alternatives, particularly in non-critical applications. Finally, the ever-changing regulatory environment influences decision-making when purchasing materials for different industries, such as automotive, electronics, and industrial manufacturing.
Opportunity: Growing Demand from Electric Vehicles and Semiconductor Manufacturing
PTFE has great potential to grow in parallel with the rapidly increasing production of electric vehicles and semiconductor fabrication due to the unique properties of the material. Electrical insulation, high chemical resistance, heat resistance, and low friction make PTFE the best option for high-performance use in these industries. In particular, PTFE has found use in electric vehicles in batteries, high-voltage insulation, connectors, seals, gaskets, and thermal management systems. On the other hand, semiconductor production involves massive investments in building new fabrication plants in order to cope with the growing demand for chips for artificial intelligence, cloud computing, consumer electronics, and automotive electronics. Due to high requirements in terms of an ultraclean environment and strong corrosion resistance for fluid handling, PTFE is widely applied in fabrication plants as part of valves, tubing, pumps, fittings, and chemical process equipment. In addition, government grants promoting local production of semiconductors and continuous electrification in transport should contribute to PTFE usage. Thus, due to its ability to provide high reliability at extreme working conditions, PTFE is likely to benefit from these investments into rapidly developing industries.
Challenge: Escalating PFAS Regulatory Scrutiny and Compliance Complexity
Increasing regulatory pressure regarding PFAS has become one of the biggest obstacles in the development of the worldwide PTFE market. Environmental regulations introduced by governments and regulatory authorities in Europe, North America, and elsewhere have become stricter, focused on the reduction of PFAS emissions, improvement of waste handling, and minimizing possible environmental effects from fluorine compounds. While PTFE is quite different from a number of low molecular weight PFAS in terms of stability and low mobility, manufacturers should comply with increasingly strict regulations concerning the production process, emissions, recycling, transportation, and documentation of their products. The cost of compliance may include large expenditures on the installation of emission control equipment, environmental monitoring, labor protection programs, and sustainable manufacturing technologies that raise the cost of production. Moreover, there are regulatory differences between the countries, which makes it hard for multinational companies to produce globally distributed products. Besides, customer concerns about PFAS sustainability issues make suppliers more transparent in their operations and conduct life-cycle assessments of their products. It becomes harder to strike a balance between complying with environmental regulations, remaining competitive, preserving intact supply chains, and making R&D investments.
PTFE MARKET: COMMERCIAL USE CASES ACROSS INDUSTRIES
| COMPANY | USE CASE DESCRIPTION | BENEFITS |
|---|---|---|
 |
Manufactures a broad portfolio of PTFE products under the POLYFLON brand, including molding powders, fine powders, dispersions, and PTFE compounds. The products are used in automotive, semiconductor, chemical processing, electrical & electronics, industrial equipment, wire & cable insulation, seals, gaskets, bearings, and non-stick coating applications requiring superior thermal and chemical resistance. | Outstanding chemical resistance | Excellent electrical insulation | High thermal stability | Low coefficient of friction | Extended component life | Reliable performance in harsh industrial environments |
 |
Produces PTFE resins, fine powders, dispersions, and modified fluoropolymer materials for applications in chemical processing, construction, electronics, automotive, industrial machinery, and wire & cable industries. The company's PTFE products are widely utilized in corrosion-resistant linings, pipes, valves, membranes, and sealing components operating under aggressive conditions. | High corrosion resistance | Excellent processability | Superior weatherability | Long service life | Reduced maintenance costs | Dependable performance in chemically aggressive environments |
 |
Develops high-performance PTFE products through its Fluoropolymers business segment, including molding powders, fine powders, dispersions, and PTFE compounds for electrical & electronics, semiconductor, automotive, chemical processing, pharmaceutical, and industrial engineering applications. The products are extensively used in seals, gaskets, bearings, coatings, valve components, and cable insulation. | Excellent dielectric properties | Superior wear resistance | Outstanding thermal and chemical stability | Enhanced equipment reliability | Reduced friction | Long operational life in demanding applications |
 |
Manufactures PTFE resins under the Teflon™ brand for use in semiconductor manufacturing, aerospace, automotive, industrial processing, medical devices, cookware coatings, fluid handling systems, and high-performance electrical insulation. The company provides customized PTFE solutions for applications requiring exceptional purity and durability under extreme operating conditions. | Exceptional non-stick performance | High purity | Superior chemical inertness | Excellent temperature resistance | Low friction | Improved equipment efficiency | Long-lasting performance in critical industrial applications |
 |
Offers advanced PTFE and fluoropolymer solutions for aerospace, electronics, healthcare, energy, semiconductor, and industrial processing industries. Its PTFE materials are designed for high-performance sealing systems, fluid handling equipment, wire & cable insulation, chemical processing components, and specialty engineering applications where durability and reliability are essential. | Superior mechanical durability | Exceptional chemical and thermal resistance | Lightweight high-performance materials | Enhanced operational reliability | Improved energy efficiency | Extended service life in mission-critical applications |
Logos and trademarks shown above are the property of their respective owners. Their use here is for informational and illustrative purposes only.
MARKET ECOSYSTEM
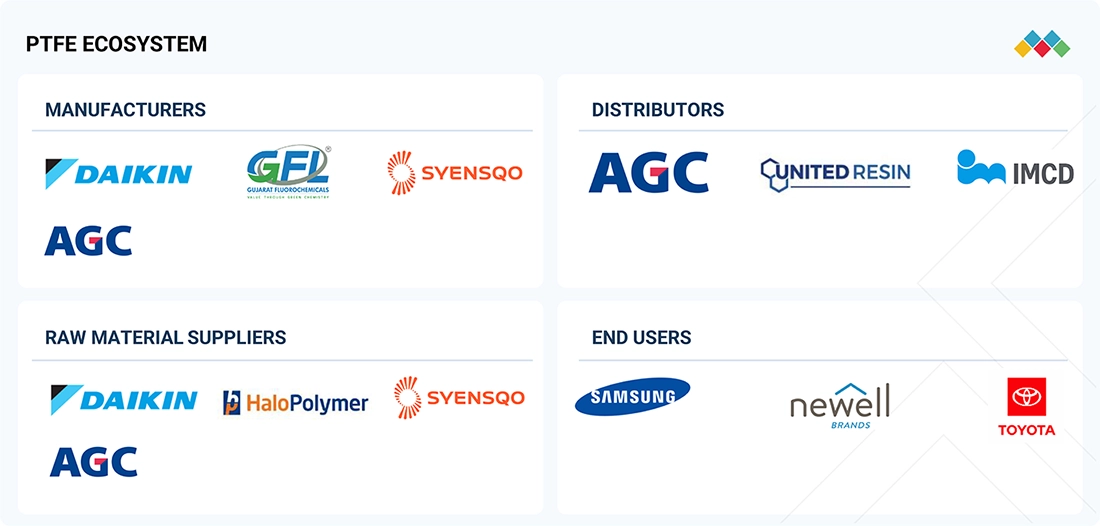
The PTFE market operates through an efficient value chain, consisting of fluorspar suppliers, HF producers, fluorochemical producers, PTFE resin producers, compounders, fabricators, distributors, and OEMs serving end-use markets such as automotive, electrical & electronics, chemical processing, semiconductor, aerospace, healthcare, industrial manufacturing, and energy sectors. PTFE products include molding powders, fine powders, dispersions, compounds, sheets, rods, tubes, films, coatings, seals, gaskets, bearings, and wire & cable insulation in order to satisfy the performance demands of various industries. Value-added services within the PTFE market include formulation of material, precise machining, custom component manufacturing, technical expertise, and product testing in order to fulfill the performance criteria of end-use markets. Manufacturing and production centers are mainly found in Asia Pacific, North America, and Europe due to the presence of efficient fluorochemical manufacturing, growing industrial infrastructure, and increasing investments in electric vehicles, semiconductors, renewable energy, and chemical processing.
Logos and trademarks shown above are the property of their respective owners. Their use here is for informational and illustrative purposes only.
MARKET SEGMENTS
Source: Secondary Research, Interviews with Experts, MarketsandMarkets Analysis
PTFE Market, by Form
PTFE comes in the forms of molding powder, fine powder, dispersion, and micronized powder, and all these forms cater to different types of manufacturing processes. Out of all these forms, fine powder leads in market share due to its wide application in paste extrusion of wire and cable insulation, tubing, hose, and other high-end industrial parts. Its flexibility and good electrical and chemical properties make it most sought after by industries such as electrical & electronics, automotive, semiconductors, and chemical processing. The granular powder is extensively used for molded products, whereas dispersions are employed for coating and fabric treatment applications.
PTFE Market, by Application
PTFE applications include sheets, coatings, pipes, films, and other forms that serve various industrial needs. Of these, coatings account for the maximum share in the global market, owing to their wide applications in cookware, machinery, chemical processing systems, automobile parts, and electrical applications. The PTFE coating has the best non-stick quality and is highly resistant to chemicals and heat, and is known for its low-friction property. PTFE sheets are widely used for applications like gaskets and seals, whereas PTFE pipes are mostly used to transfer corrosive chemicals in industrial premises. PTFE films find wide applications in electrical insulation, semiconductor production, and high-end laminates.
PTFE Market, by End-use Industry
End-use industries for PTFE include chemical and industrial processing, automotive and aerospace, electrical and electronics, building and construction, consumer goods, among others. In all of these industries, PTFE is used owing to its remarkable features such as chemical resistance, thermal stability, and low-friction characteristics. Among these industries, the chemical and industrial processing industry accounts for the largest share in the market because of the wide application of PTFE in piping, valves, seals, gaskets, linings, and fluid handling systems that come into contact with highly corrosive chemicals. On the other hand, the automotive and aerospace industries use PTFE in seals, bearings, and fuel systems, whereas the electrical and electronics industries use PTFE as an insulator and in semiconductors.
REGION
Asia Pacific to be the fastest-growing PTFE market during the forecast period
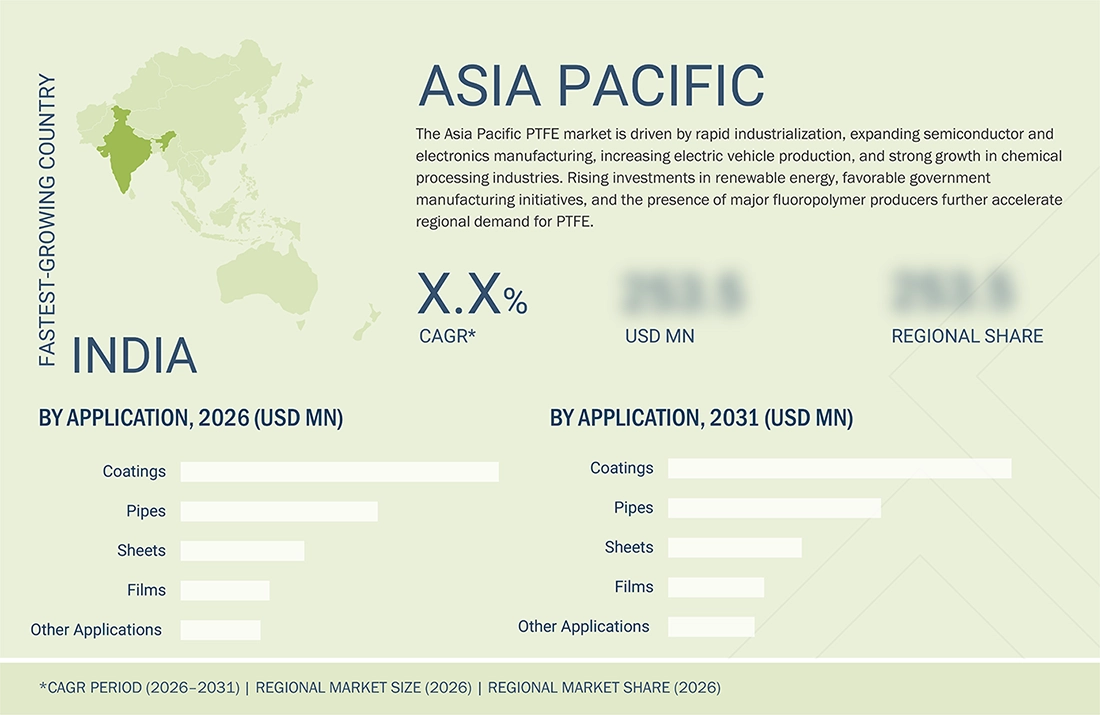
Asia Pacific will witness rapid growth in the global market for polytetrafluoroethylene due to increased industrialization and investment in high-growth sectors such as electrical & electronics, automotive, semiconductors, and chemical process industries. Nations such as China, Japan, South Korea, and India are major producers of fluoropolymers and are experiencing growing demand for PTFE in applications such as wire and cable insulation, industrial machinery, seals, gaskets, coatings, and semiconductors. In addition, the region is gaining from rapid adoption of electric vehicles, renewable energy projects, and semiconductor fabrication units. Favorable government policies promoting the domestic manufacturing industry, abundant raw materials, lower production costs, and the presence of key PTFE producers in the region further augment regional market growth.
PTFE MARKET: COMPANY EVALUATION MATRIX
Daikin Industries, Ltd. (Star Player) has established itself as one of the most dominant players in the PTFE industry due to its POLYFLON range of products, fluoropolymer technology, R&D capability, and broad distribution network worldwide. Daikin Industries caters to different end-use industry sectors such as electrical & electronics, automotive, chemical processing, semiconductors, aerospace, and the manufacturing industry. With a focus on developing high-performing fluoropolymers and innovative products, along with expanding production capacity, the company has succeeded in increasing its competitiveness amid rising demand for corrosion-resistant materials. Halopolymer (Emerging Player) has been growing its footprint in the PTFE market owing to its extensive range of PTFE resins, fine powders, dispersions, and fluoropolymers, which have been designed for specific industrial applications including industrial, chemical processing, electronics, and aerospace. Halopolymer has been enhancing its market position in this regard with continued product innovation and the development of high-quality fluoropolymer solutions for industrial applications. Both companies are benefiting from increased demand driven by developments in electric vehicles, the semiconductor industry, and the renewable energy sector, among others.
Source: Secondary Research, Interviews with Experts, MarketsandMarkets Analysis
KEY MARKET PLAYERS
- 1. Daikin Industries, Ltd (Japan)
- 2. Dongyue Group (China)
- 3. Gujarat Fluorochemicals Limited (India)
- 4. The Chemours Company (US)
- 5. Syensqo (Belgium)
- 6. AGC Inc (Japan)
- 7. 3M (US)
- 8. Halopolymer (Russia)
- 9. Shanghai Huayi 3F New Materials Co., Ltd (China)
- 10. Micropowders Inc (US)
MARKET SCOPE
| REPORT METRIC | DETAILS |
|---|---|
| Market Size in 2025 (Value) | USD 3.00 Billion |
| Market Size in 2026 (Value) | USD 3.12 Billion |
| Market Forecast in 2031 (Value) | USD 3.87 Billion |
| Growth Rate | CAGR of 4.40% from 2026–2031 |
| Years Considered | 2022–2031 |
| Base Year | 2025 |
| Forecast Period | 2026–2031 |
| Units Considered | Value (USD Million/Billion), Volume (Kiloton) |
| Report Coverage | Revenue Forecast, Company Ranking, Competitive Landscape, Growth Factors, and Trends |
| Segments Covered |
|
| Regions Covered | North America, Asia Pacific, Europe, South America, Middle East & Africa |
WHAT IS IN IT FOR YOU: PTFE MARKET REPORT CONTENT GUIDE
DELIVERED CUSTOMIZATIONS
We have successfully delivered the following deep-dive customizations:
| CLIENT REQUEST | CUSTOMIZATION DELIVERED | VALUE ADDS |
|---|---|---|
| Demand for country-specific market insights | Provided in-depth analysis of PTFE demand, fluoropolymer production, end-use industry trends, import-export dynamics, and regulatory landscape across key countries in North America, Europe, Asia Pacific, the Middle East, and Latin America. | Helps clients identify high-growth regional markets, assess demand drivers, evaluate investment opportunities, and develop country-specific expansion strategies |
| Request for competitor benchmarking | Delivered comprehensive benchmarking of leading PTFE manufacturers, covering product portfolios, manufacturing capacities, geographic footprint, distribution networks, pricing strategies, R&D capabilities, sustainability initiatives, and recent developments. | Enables competitive positioning, identifies market gaps, supports partnership evaluation, and assists in strategic business planning and product differentiation |
| Application- and industry-specific insights | Provided detailed analysis of PTFE applications across coatings, sheets, pipes, films, seals, gaskets, wire & cable insulation, and end-use industries including chemical processing, automotive, aerospace, electrical & electronics, semiconductors, healthcare, and construction. | Supports product portfolio optimization, identifies high-growth application areas, and aligns business strategies with evolving customer requirements |
| Technology and innovation support | Evaluated advancements in modified PTFE, filled PTFE compounds, micronized PTFE, high-purity fluoropolymers, sustainable processing technologies, and innovations supporting electric vehicles, semiconductor manufacturing, and renewable energy applications. | Accelerates innovation roadmaps, supports new product development, improves market competitiveness, and enables early identification of emerging technology opportunities |
| Regulatory and sustainability assessment | Provided detailed analysis of PFAS regulations, fluoropolymer compliance requirements, environmental policies, product stewardship initiatives, recycling developments, and sustainability trends across major global markets. | Supports regulatory compliance, mitigates business risks, enables sustainable product development, and helps companies prepare for evolving environmental and market requirements |
RECENT DEVELOPMENTS
- August 2026 : Marginal Bearing published a guide highlighting the key factors buyers should assess when selecting PTFE composite bearings for high-load, dry-running, and self-lubricating applications. The guide emphasizes load, speed, temperature, shaft condition, and clearance as critical factors in achieving reliable bearing performance. It also highlights how PTFE formulations, three-layer construction, and supplier quality control can influence wear resistance and service life. The guidance is particularly relevant to hydraulic equipment, automation, and industrial machinery where reduced lubrication and maintenance are priorities.
- July 2026 : Korea Institute of Materials Science (KIMS) developed an Ag–PTFE composite coating that makes silver-plated electrical contacts harder, smoother, and more wear-resistant. The coating delivers about 23% higher hardness than conventional silver plating while achieving a friction coefficient below 0.2. Its cyanide-free acidic plating process also addresses workplace safety and wastewater-treatment concerns associated with conventional silver electroplating. The technology targets EV connectors, relays, switches, lead frames, and electronic terminals exposed to repeated contact and friction. The development could extend component life and improve reliability as demand for high-voltage, high-current electrical contacts grows.
- July 2026 : Researchers at Korea Institute of Materials Science (KIMS) and Korea Electrotechnology Research Institute (KERI) developed a PTFE-free dry battery anode using spray-dried graphite granules and a CMC-SBR binder system. The PTFE-free dry anode delivered 109.5 mAh/g at 2C, versus 81.1 mAh/g for a conventional slurry-cast anode, while retaining 81.8% capacity after 200 cycles in full-cell testing. The rounded graphite structure improves lithium-ion transport through thick, high-energy electrodes, addressing a key barrier to fast charging. The approach also reduces reliance on fluorinated materials and can lower solvent use and energy-intensive drying during battery production. The development could support faster-charging, longer-range EV batteries while enabling cleaner and potentially more scalable dry-electrode manufacturing.
- July 2026 : ABCON Marine offers HYDRAULICS Stop Leak, a Teflon-based additive designed to reduce or stop hydraulic oil leaks in marine systems. Its fine Teflon particles impregnate metal surfaces, reducing friction and wear around leaking seals. For more severe leaks, HYDRAULICS SLL uses larger particles to create a stronger barrier at moving-cylinder seals. The solutions can be added directly to existing hydraulic oil and applied onboard, helping vessels avoid unnecessary downtime and repairs. The technology supports marine operators seeking to extend equipment life, control leakage, and defer costly dry-docking.
- June 2026 : Nitto Denko’s NITOFLON PTFE Adhesive Tape is gaining attention as a low-friction, heat-resistant solution for industrial equipment where repeated sliding can cause noise and wear. The PTFE-coated tape helps reduce friction while resisting chemicals, release agents, and high temperatures in applications such as packaging machinery, conveyors, and sliding guides. Its easy installation and replacement can help maintenance teams reduce downtime and protect costly machine components. The tape is particularly relevant for production environments where conventional lubrication is unsuitable or insufficient. The development reinforces Nitto Denko’s position in industrial materials that improve equipment reliability and operating efficiency.
Table of Contents
 Exclusive indicates content/data unique to MarketsandMarkets and not available with any competitors.
Methodology
The study involves two major activities in estimating the current market size for the PTFE market. Exhaustive secondary research was done to collect information on the market, peer market, and parent market. The next step was to validate these findings, assumptions, and sizing with industry experts across the value chain through primary research. Both top-down and bottom-up approaches were employed to estimate the complete market size. After that, market breakdown and data triangulation were used to estimate the market size of segments and subsegments.
Secondary Research
Secondary sources referred to for this research study include financial statements of companies offering PTFE and information from various trade, business, and professional associations. Secondary research has been used to obtain critical information about the industry’s value chain, the total pool of key players, market classification, and segmentation according to industry trends to the bottom-most level and regional markets. The secondary data was collected and analyzed to arrive at the overall size of the PTFE market, which was validated by primary respondents.
Primary Research
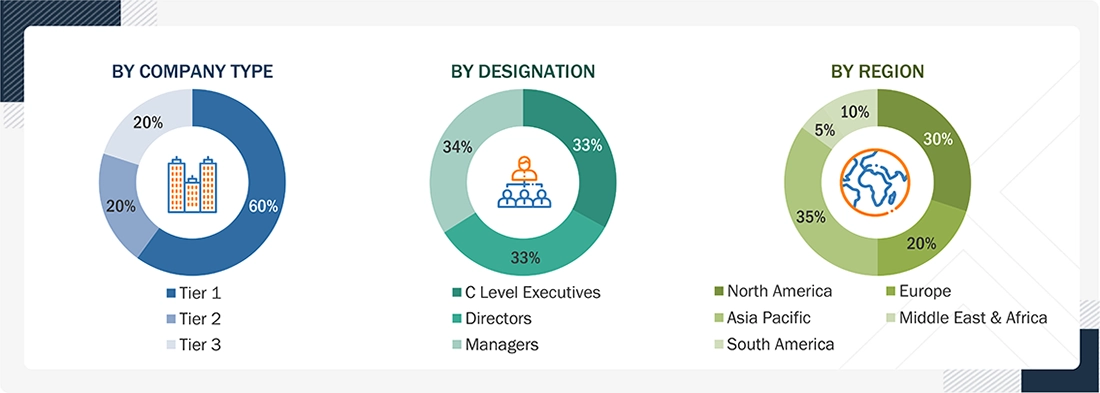
Extensive primary research was conducted after obtaining information regarding the PTFE market scenario through secondary research. Several primary interviews were conducted with market experts from both the demand and supply sides across major countries of North America, Europe, Asia Pacific, Middle East & Africa, and South America. Primary data was collected through questionnaires, emails, and telephonic interviews. The primary sources from the supply side included various industry experts, such as chief executive officers (CXOs), vice presidents (VPs), directors from business development, marketing, product development/innovation teams, and related key executives from PTFE industry vendors; material providers; distributors; and key opinion leaders.
Primary interviews were conducted to gather insights into market statistics, revenue from products and services, market breakdowns, market size estimates, market forecasting, and data triangulation. Primary research also helped in understanding the various trends related to form, application, system, end-use industry, and region. Stakeholders from the demand side, such as CIOs, CTOs, CSOs, and installation teams of the customer/end users who are seeking PTFE, were interviewed to understand the buyer’s perspective on the suppliers, products, and their current usage of PTFE and future outlook of their business, which will affect the overall market.
The Breakdown of Primary Research:
To know about the assumptions considered for the study, download the pdf brochure
Market Size Estimation
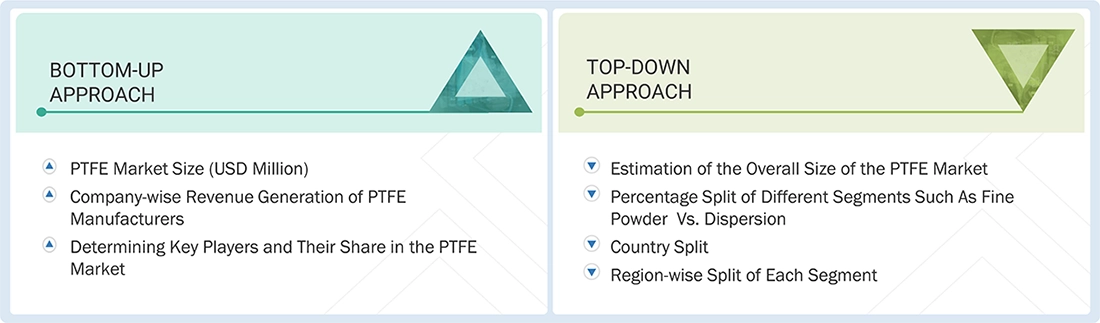
The research methodology used to estimate the size of the PTFE market includes the following details. The market sizing was undertaken from the demand side. The market was upsized based on the demand for PTFE in different end-use industries at a regional level. Such procurements provide information on the demand aspects of the PTFE industry for each end-use industry. For each end-use, all possible segments of the PTFE market were integrated and mapped.
PTFE Market : Top-Down and Bottom-Up Approach
Data Triangulation
After arriving at the overall size from the market size estimation process explained above, the total market was split into several segments and subsegments. The data triangulation and market breakdown procedures explained below were implemented, wherever applicable, to complete the overall market engineering process and arrive at the exact statistics for various market segments and subsegments. The data was triangulated by studying various factors and trends from the demand and supply sides. Along with this, the market size was validated using both the top-down and bottom-up approaches.
Market Definition
Polytetrafluoroethylene (PTFE) is a high-performing fluoropolymer material that exhibits unique features like excellent resistance to chemicals, high thermal stability, low coefficient of friction, and good electrical insulation. PTFE is widely used in manufacturing seals, gaskets, coatings, pipes, films, wire & cable insulation, and many other applications across industries including chemical processing, automotive, electronics, aerospace, healthcare, and semiconductors.
Key Stakeholders
- PTFE Manufacturers
- PTFE Distributors and Suppliers
- End-use Industries
- Universities, Governments, and Research Organizations
- Associations and Industrial Bodies
- R&D Institutes
- Environmental Support Agencies
- Investment Banks and Private Equity Firms
- Research and Consulting Firms
Report Objectives
- To define, describe, and forecast the PTFE market size in terms of volume and value
- To provide detailed information regarding the key factors, such as drivers, restraints, opportunities, and challenges influencing market growth
- To analyze and forecast the market by form, application, end-use industry, and region
- To forecast the market size concerning five main regions (along with country-level data), namely, North America, Europe, Asia Pacific, Middle East & Africa, and South America, and analyze the significant region-specific trends
- To strategically analyze micromarkets with respect to individual growth trends, prospects, and contributions of the submarkets to the overall market
- To analyze the market opportunities and the competitive landscape for stakeholders and market leaders
- To assess recent market developments and competitive strategies, such as agreements, contracts, acquisitions, partnerships & collaborations, and product developments/product launches, to draw the competitive landscape
- To strategically profile the key market players and comprehensively analyze their core competencies
Available customizations:
MarketsandMarkets offers the following customizations for this market report:
- Additional country-level analysis of the PTFE market
Product Analysis
- Product matrix, which provides a detailed comparison of the product portfolio of each company’s market


Personalize This Research
- Triangulate with your Own Data
- Get Data as per your Format and Definition
- Gain a Deeper Dive on a Specific Application, Geography, Customer or Competitor
- Any level of Personalization
Let Us Help You
- What are the Known and Unknown Adjacencies Impacting the PTFE Market
- What will your New Revenue Sources be?
- Who will be your Top Customer; what will make them switch?
- Defend your Market Share or Win Competitors
- Get a Scorecard for Target Partners

Custom Market Research Services
We Will Customise The Research For You, In Case The Report Listed Above Does Not Meet With Your Requirements
Get 10% Free CustomisationTESTIMONIALS

We at Nissan Chemicals Corporation have been clients of MarketsandMarkets for more than a year now. We recently consulted MarketsandMarkets for a study, the team at MarketsandMarkets was extremely professional and organized. The business insights were very detailed and aligned well with our expectations that really helped us formulate the Business Plans and device new strategies for development themes. MarketsandMarkets offers a unique combination of expertise and dedicated engagement model. Their research findings have helped us in designing our Pricing Strategy which will make it easier for us to predict the future sales and profits for the next ten years. We look forward to working with MarketsandMarkets in the future.
VP of Strategy & New Business Development
Leading Specialty Chemical Company
The MarketsandMarkets Engagement Model, composed of both the Knowledge Store and advisory custom research, has greatly helped us in understanding our markets and making strategic decisions. The Knowledge Store is a fast way to allow everyone in our organization to understand more about most any market they are interested in. The ability to then get custom research done and get answers to specific strategic questions and market insight has been spectacular. The Markets and Markets team feel more like colleagues than vendors and their services have helped us change our culture where statements of things like growth opportunities and competitive position are always backed by industry research.

Rich Gibson,
Director, Corporate Strategy
Milliken & Company,
Leading Industrial Manufacturer of specialty chemical, floor covering, performance and protective textile materials, and healthcaremilliken.com
MarketsandMarkets is a trusted resource that helps us to better understand markets that are near-adjacencies-whether its technology, value chain or geography. Their Knowledge Store platform provides a dashboard of markets and their characteristics which is easy to use and saves us time.
Adam Shaw,
Market Development and Strategy Manager
AdvanSix Inc. USA,
An American Leader in Chemicalswww.advansix.com
The Knowledge Store from MarketsandMarkets is a valuable tool which has helped my team acquire greater insight in to the end markets that our business serves. This has enabled us to help our company build stronger strategies throughout our planning process.
TOSHIO KINOSHITA
Senior Chif Consultion Research & Consulting Division
Mitsubishi Chemical Research Corporation,
Leading Manufacturer of Chemical Productswww.mitsubishichem-res.co.jp/en/

We recently engaged with MarketsandMarkets for a study, the team not only clearly understood our business objectives but was also extremely professional in the way they handled the entire project. The study was efficiently conducted in a phase-wise manner, and the engagement model furnished us with high-quality business insights that far exceeded our expectations at each phase. We were especially happy that MarketsandMarkets could provide us with both, an English as well as a Japanese version of the study. A special thanks to the Analyst Team and Client Services Team, whose fluency in Japanese enhanced our comfort level, as we could converse with them in our preferred language.
Independent entrepreneurs
Arrow Precision
We approached MarketsandMarkets for study on Proppants Market, and their work exceeded our expectations. The study conducted was comprehensive and enabled us to view the market through the various dimensions. In addition, the team was extraordinarily responsive throughout the process and resolved our queries on time. I strongly recommend MarketsandMarkets and will certainly consider them for additional market assessments we will need in the future.
Global engineering company, Japan
Deputy Manager,
Strategic Planning OfficeThe high-quality insights shared by the MarketsandMarkets team helped us understand the pharmaceutical plant designers in a specific geography. It also captured the risks that we may likely face in communicating with our potential partners. The study would enable us identify partners, which would impact our future growth.
- China PTFE Market
- Japan PTFE Market
- South Korea PTFE Market
- India PTFE Market
- Australia PTFE Market
- US PTFE Market
- Canada PTFE Market
- Mexico PTFE Market
- Germany PTFE Market
- France PTFE Market
- UK PTFE Market
- Italy PTFE Market
- Spain PTFE Market
- Saudi Arabia PTFE Market
- South Africa PTFE Market
- Brazil PTFE Market
- Argentina PTFE Market
- Rest Of Europe PTFE Market
- Rest Of Asia Pacific PTFE Market
- GCC PTFE Market
- Rest Of GCC PTFE Market
- Rest Of South America PTFE Market
Growth opportunities and latent adjacency in PTFE Market




Shur-Fen
Apr, 2015
Report title not mentioned.
Anis
Dec, 2014
PTFE Market report .
Dagmar
Dec, 2016
Interested in Chemical tubes market from the aspect of market size, industry profile, end-use industry, etc..
Dagmar
Dec, 2016
PTFE market.
Dagmar
Sep, 2016
General information on overall PTFE consumption and specific focus on PTFE tubes.
Johan
Mar, 2016
General information on overall PTFE consumption and specific focus on automotive industry.