High Performance Fiber Market by Type (Carbon Fiber, Aramid, PBI, PPS, Glass Fiber, Ceramics), Application (Electronics & Communication, Textile, Aerospace & Defense, Automotive), Region - Global Forecast to 2021


The High Performance Fiber Market is projected to grow USD 16.46 Billion by 2021, at a CAGR of 8.9%.
The objectives of this study are:
- To analyze and forecast the size of the high performance fiber market, in terms of value
- To define, describe, and forecast the high performance fiber market by type, application, and region
- To forecast the market size of different segments based on varied regions, such as North America, Europe, Asia-Pacific, the Middle East & Africa, and South America
- To provide detailed information regarding major factors, such as drivers, restraints, opportunities, and challenges influencing the growth of the high performance fiber market during the forecast period
- To strategically analyze the segments of the high performance fiber market, based on individual growth trends, future prospects, and contribution to the total market
- To analyze opportunities for stakeholders in the high performance fiber market and provide detailed competitive landscape for market leaders
- To strategically profile key players operating in the high performance fiber market and comprehensively analyze their core competencies
- To analyze competitive developments, such as alliances, joint ventures, mergers & acquisitions, and new product launches in the high performance fiber market
Years considered for the study are:
- Base Year – 2015
- Estimated Year – 2016
- Projected Year – 2021
- Forecast Period – 2016 to 2021
For company profiles, 2015 has been considered as the base year. In cases, wherein information was unavailable for the base year, the years prior to it have been considered.
Research Methodology
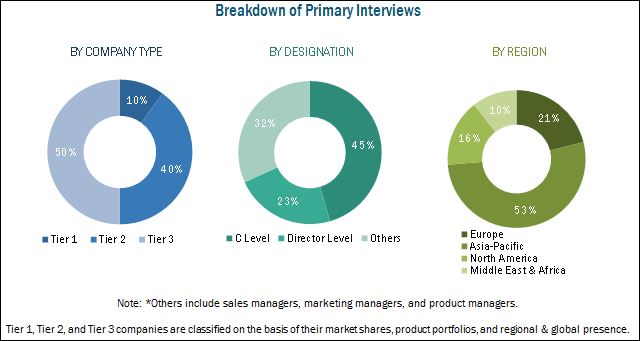
This study estimated the size of the high performance fiber market for 2016 and projected demand of high performance fibers till 2021. It also provides a detailed qualitative and quantitative analysis of the high performance fiber market. Various secondary sources, including directories, industry journals, various associations, and databases, such as Hoovers, Bloomberg, Chemical Weekly, Factiva, government and private websites, and associations have been used to identify and collect information, useful for this extensive commercial study of the high performance fiber market. Primary sources, such as experts from related industries and suppliers have been interviewed to obtain and verify critical information as well as assess future prospects of the high performance fiber market. The breakdown of profiles of primaries is shown in the figure below:
To know about the assumptions considered for the study, download the pdf brochure
Key Target Audience
- Manufacturers of High Performance Fibers
- Traders, Distributors, and Suppliers of High Performance Fibers
- End-Use Industries Operating in the Supply Chain of High Performance Fibers
- Government and Research Organizations
- Associations and Industrial Bodies
- Research and Consulting Firms
- R&D Institutions
- Environment Support Agencies
- Investment Banks and Private Equity Firms
Scope of the High Performance Fiber Market Report :
This research report categorizes the high performance fiber market on the basis of type, application, and region. The report forecasts revenues as well as analyzes the trends in each of these submarkets.
High Performance Fiber Market, by Type:
- Carbon Fiber
- Polybenzimidazole (PBI)
- High-Strength PE Fiber
- Aramid
- Polyphenylene Sulfide (PPS)
- Glass Fiber
- Ceramics
- Others
High Performance Fiber Market, by Application:
- Electronics & Telecommunication
- Textile
- Aerospace & Defense
- Construction & Building
- Automotive
- Sporting Goods
- Others
High Performance Fiber Market, by Region:
- North America
- Europe
- Asia-Pacific
- Middle East & Africa
- South America
Available Customizations
Along with the given market data, MarketsandMarkets offers customizations according to specific needs of the companies. The following customization options are available for the report:
- New Product Analysis
Product matrix, which gives a detailed comparison of new products and market trends in each industry
- Regional Analysis
Further breakdown of a region with respect to a particular country and application
- Company Information
Detailed analysis and profiling of additional market players (up to five)
The high performance fiber market is projected to grow from USD 10.73 Billion in 2016 to USD 16.46 Billion by 2021, at a CAGR of 8.9% between 2016 and 2021. Factors such as increasing demand for high performance fibers in the defense sector and growing need for fuel-efficient and lightweight materials with superior strength for use in various applications, such as textile and automotive, among others are expected to fuel the growth of the high performance fiber market during the forecast period, 2016 to 2021.
On the basis of application, the high performance fiber market has been segmented into electronics & telecommunication, textile, aerospace & defense, construction & building, automotive, sporting goods, and others. The aerospace & defense application segment is projected to lead the high performance fiber market during the forecast period. Increased use of high performance fibers to manufacture aircraft structural components, Fiberglass Reinforced Plastics (FRP) boards, automotive structural parts, golf shafts, and wind blade components, among others is expected to boost the growth of the high performance fiber market during the forecast period.
Based on type, the high performance fiber market has been segmented into carbon fiber, polybenzimidazole, high-strength PE fiber, aramid, polyphenylene sulfide, glass fiber, ceramics, and others. The carbon fiber segment of the high performance fiber market is projected to grow at the highest CAGR during the forecast period, 2016 to 2021.
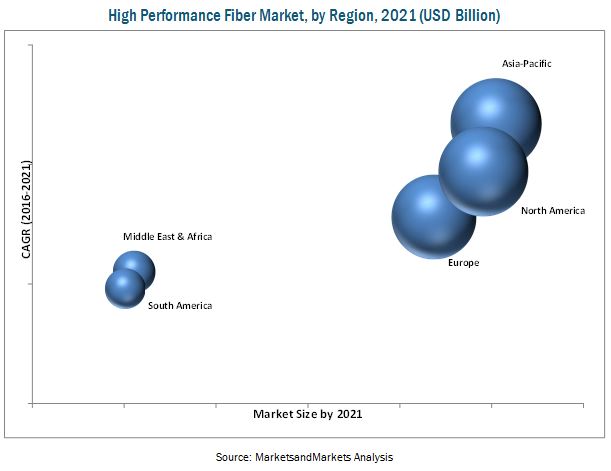
The Asia-Pacific high performance fiber market is projected to grow at the highest CAGR between 2016 and 2021. The Asia-Pacific region is one of the largest markets for high performance fibers. This region is a major consumer of high performance fibers, which are used in varied applications, such as electronics & telecommunication, textiles, aerospace & defense, construction & building, automotive, and sporting goods, among others. The demand for high performance fibers is increasing in different countries, such as Japan, Hong Kong, China, India, and Indonesia, among others. To meet this growing demand for high performance fibers from different countries of the Asia-Pacific region, top manufacturers from the U.S. and Europe are now focusing on the Asia-Pacific region to expand their high performance fibers business.
Factors such as lack of investments for carrying out R&D activities in the field of high performance fibers and high cost of production of carbon fibers are expected to hinder the growth of the high performance fiber market during the forecast period.
Key companies operating in the high performance market include Teijin Ltd. (Japan), E. I. du Pont Nemours and Company (U.S.), Yantai Tayho Advanced Materials Co., Ltd. (China), Cytec Industries Inc. (U.S.), Mitsubishi Rayon Co., Ltd. (Japan), Owens Corning (U.S.), PBI Performance Products, Inc. (U.S.), Koninklijke Ten Cate NV (Netherlands), Kureha Corporation (Japan), and Toray Industries, Inc. (Japan), among others. These players, with wide market reach and established distribution networks, are investing increasingly in research & development activities. They also have strong technical and market development capabilities, which enable them to upgrade their existing products for new applications.
Frequently Asked Questions (FAQ):
How big is the High Performance Fiber Market?
The High Performance Fiber Market is projected to grow USD 16.46 Billion by 2021, at a CAGR of 8.9%.
Who leading market players in High Performance Fiber Market ?
Key companies operating in the high performance market include Teijin Ltd. (Japan), E. I. du Pont Nemours and Company (U.S.), Yantai Tayho Advanced Materials Co., Ltd. (China), Cytec Industries Inc. (U.S.), Mitsubishi Rayon Co., Ltd. (Japan), Owens Corning (U.S.), PBI Performance Products, Inc. (U.S.), Koninklijke Ten Cate NV (Netherlands), Kureha Corporation (Japan), and Toray Industries, Inc. (Japan), among others.
To speak to our analyst for a discussion on the above findings, click Speak to Analyst
 Exclusive indicates content/data unique to MarketsandMarkets and not available with any competitors.
Table of Contents
1 Introduction (Page No. - 14)
1.1 Objectives of the Study
1.2 Market Definition
1.3 Market Scope
1.3.1 Years Considered for the Study
1.4 Currency
1.5 Limitations
1.6 Stakeholders
2 Research Methodology (Page No. - 17)
2.1 Research Data
2.1.1 Secondary Data
2.1.2 Key Data From Secondary Sources
2.1.3 Primary Research
2.1.4 Key Data From Primary Sources
2.2 Market Size Estimation
2.3 Data Triangulation
2.3.1 Key Industry Insights
2.3.2 Assumptions
3 Executive Summary (Page No. - 25)
4 Premium Insights (Page No. - 29)
4.1 Attractive Opportunities in the High Performance Fiber Market
4.2 Market, By Region
4.3 Market, By Type
4.4 Asia-Pacific Market, By Application and Major Countries
4.5 Market: Emerging vs Developed Countries
5 Market Overview (Page No. - 32)
5.1 Introduction
5.2 Market Segmentation
5.2.1 Market, By Application
5.2.2 Market, By Type
5.2.3 Market, By Region
5.3 Market Dynamics
5.3.1 Drivers
5.3.2 Restraints
5.3.3 Opportunities
5.4 Challenges
5.4.1 High Cost of Production of Carbon Fibers Limits Their Use to Premium Products
5.5 Impact Anlysis of Drivers and Restraints
6 Industry Trends (Page No. - 39)
6.1 Introduction
6.2 Revenue Pocket Matrix
6.2.1 Revenue Pocket Matrix for Market, By Application, 2016
6.2.2 Revenue Pocket Matrix for Market, By Type, 2016
6.3 Economic Indicators
6.3.1 Trends and Forecasts of GDP
6.4 Trends of the Automotive Industry
6.5 Trends in the Aerospace Industry
6.6 Trends in the Textile Industry
6.7 Cost Structure Analysis
7 High Performance Fiber Market, By Type (Page No. - 46)
7.1 Introduction
7.2 Market Size and Projection
7.3 Carbon Fibers
7.4 Polybenzimidazole (PBI)
7.5 High-Strength Pe Fibers
7.6 Aramid
7.7 Polyphenylene Sulfide (PPS)
7.8 Glass Fibers
7.9 Ceramics
7.10 Others
8 High Performance Fiber Market, By Application (Page No. - 53)
8.1 Introduction
8.2 Electronics & Telecommunication
8.3 Textile
8.4 Aerospace & Defense
8.5 Construction & Building
8.6 Automotive
8.7 Sporting Goods
8.8 Others
9 Regional Analysis (Page No. - 62)
9.1 Introduction
9.2 Asia-Pacific
9.2.1 China
9.2.2 Japan
9.2.3 New Zealand
9.2.4 Malaysia
9.2.5 India
9.2.6 Australia
9.2.7 Hong Kong
9.2.8 Rest of Asia-Pacific
9.3 Europe
9.3.1 Germany
9.3.2 France
9.3.3 U.K.
9.3.4 Spain
9.3.5 Italy
9.3.6 Belgium
9.3.7 Russia
9.3.8 Rest of Europe
9.4 North America
9.4.1 U.S.
9.4.2 Canada
9.4.3 Mexico
9.5 Middle East & Africa
9.5.1 Iran
9.5.2 Saudi Arabia
9.5.3 UAE
9.5.4 South Africa
9.5.5 Iraq
9.5.6 Rest of Middle East & Africa
9.6 South America
9.6.1 Brazil
9.6.2 Argentina
9.6.3 Colombia
9.6.4 Peru
9.6.5 Rest of South America
10 Competitive Landscape (Page No. - 99)
10.1 Overview
10.1.1 New Product Launches: the Most Popular Growth Strategy
10.2 Growth Strategies Adopted By Companies in the High Performance Fiber Market Between 2013 and 2017(January)
10.3 High Performance Fiber Market Share, By Company, 2016
10.4 Maximum Number of Developments in the High Performance Fiber Market Took Place in 2016
10.5 New Product Launches
10.6 Expansions
10.7 Mergers & Acquisitions
10.8 Agreements
10.9 Collaborations, Contracts, and Partnerships
10.10 New Technologies and Joint Ventures
11 Company Profiles (Page No. - 111)
11.1 Toray Industries Inc.
(Business Overview, Products & Services, Key Insights, Recent Developments, SWOT Analysis, MnM View)*
11.2 Teijin Ltd.
11.3 E. I. Du Pont De Nemours and Co.
11.4 Mitsubishi Rayon Co., Ltd.
11.5 Owens Corning
11.6 Cytec Industries Inc.
11.7 Kureha Corporation
11.8 Yantai Tayho Advanced Materials Co., Ltd.
11.9 PBI Performance Products, Inc.
11.10 Koninklijke Ten Cate NV
11.11 Zoltek Companies Inc.
11.12 Honeywell International
11.13 PHP Fibers
11.14 AGY Holding Corp.
11.15 Bally Ribbon Mills
11.16 Binani Group
11.17 Intertech Group
11.18 Sarla Performance Fibers Limited
11.19 W. L. Gore & Associates Inc.
11.20 Taekwang Industries Co. Ltd.
11.21 Bluestar Fibers Company Ltd.
*Details on Business Overview, Products & Services, Key Insights, Recent Developments, SWOT Analysis, MnM View Might Not Be Captured in Case of Unlisted Companies.
12 Appendix (Page No. - 139)
12.1 Discussion Guide
12.2 Knowledge Store: Marketsandmarkets Subscription Portal
12.3 Introducing RT: Real-Time Market Intelligence
12.4 Available Customizations
12.5 Related Reports
12.6 Author Details
List of Tables (73 Tables)
Table 1 Market Snapshot
Table 2 Market, By Application
Table 3 Market, By Type
Table 4 Market, By Region
Table 5 Trends and Forecasts of GDP, USD Billion (2016–2021)
Table 6 Automotive Production, Million Units (2011–2015)
Table 7 Number of New Airplane Deliveries, By Region
Table 8 Textile Exports of Asian Countries, 2009-2011 ( USD Million)
Table 9 High Performance Fiber – Cost Structure
Table 10 Market, By Type, 2014-2021 (USD Billion)
Table 11 Carbon Fiber Type, By Region, 2014-2021 (USD Million)
Table 12 Polybenzimidazole Type, By Region, 2014-2021 (USD Million)
Table 13 High-Strength Pe Fiber Type, By Region, 2014-2021 (USD Million)
Table 14 Aramid Type, By Region, 2014-2021 (USD Million)
Table 15 Polyphenylene Sulfide Type, By Region, 2014-2021 (USD Million)
Table 16 Glass Fiber Type , By Region, 2014-2021 (USD Million)
Table 17 Ceramics Type , By Region, 2014-2021 (USD Million)
Table 18 Others Type, By Region, 2014-2021 (USD Million)
Table 19 Market, By Application, 2014–2021 (USD Billion)
Table 20 HFP in Electronics & Telecommunication Application, By Region, 2014–2021 (USD Million)
Table 21 HFP in Textile Application, By Region, 2014–2021 (USD Million)
Table 22 HFP in Aerospace & Defense Application, By Region, 2014–2021 (USD Million )
Table 23 HFP in Construction & Building Application, By Region, 2014–2021 (USD Million)
Table 24 HFP in Automotive Application, By Region, 2014–2021 (USD Million)
Table 25 HFP in Sporting Goods Application, By Region, 2014–2021 (USD Million)
Table 26 HFP in Others Application, By Region, 2014–2021 (USD Million)
Table 27 Market, By Region, 2014–2021 (USD Billion)
Table 28 Asia-Pacific Market, By Country, 2014-2021(USD Million)
Table 29 Asia-Pacific Market, By Application, 2014-2021 (USD Million)
Table 30 China Market, By Application, 2014-2021(USD Million)
Table 31 Japan Market, By Application, 2014-2021 (USD Million)
Table 32 New Zealand Market, By Application, 2014-2021 (USD Million)
Table 33 Malaysia Market, By Application, 2014-2021 (USD Million)
Table 34 India Market, By Application, 2014-2021 (USD Million)
Table 35 Australia Market, By Application, 2014-2021 (USD Million)
Table 36 Hong Kong Market, By Application, 2014-2021 (USD Million)
Table 37 Rest of Asia-Pacific Market, By Application, 2014-2021 (USD Million)
Table 38 Europe Market, By Country, 2014-2021 (USD Million)
Table 39 Europe Market, By Application, 2014-2021 (USD Million)
Table 40 Germany Market, By Application, 2014–2021 (USD Million)
Table 41 France Market, By Application, 2014–2021 (USD Million)
Table 42 U.K. Market, By Application, 2014–2021 (USD Million )
Table 43 Spain Market, By Application, 2014–2021 (USD Million )
Table 44 Italy Market, By Application, 2014–2021 (USD Million)
Table 45 Belgium Market, By Application, 2014–2021 (USD Million)
Table 46 Russia Market, By Application, 2014–2021 (USD Million)
Table 47 Rest of Europe Market, By Application, 2014–2021(USD Million)
Table 48 North America Market, By Country, 2014-2021 (USD Million)
Table 49 North America Market, By Application, 2014-2021 (USD Million)
Table 50 U.S. Market, By Application, 2014–2021 (USD Million )
Table 51 Canada Market, By Application, 2014–2021 (USD Million )
Table 52 Mexico Market, By Application, 2014–2021 (USD Million )
Table 53 Middle East & Africa Market, By Country, 2014-2021 (USD Million)
Table 54 Middle East & Africa Market, By Application, 2014-2021 (USD Million)
Table 55 Iran Market, By Application, 2014–2021 (USD Million)
Table 56 Saudi Arabia Market, By Application, 2014–2021 (USD Million)
Table 57 UAE Market, By Application, 2014–2021 (USD Million)
Table 58 South Africa Market, By Application, 2014–2021 (USD Million)
Table 59 Iraq Market, By Application, 2014–2021 (USD Million)
Table 60 Rest of Middle East & Africa Market, By Application, 2014–2021 (USD Million)
Table 61 South America Market, By Country, 2014-2021 (USD Million)
Table 62 South America Market, By Application, 2014-2021 (USD Million)
Table 63 Brazil Market, By Application, 2014–2021 (USD Million)
Table 64 Argentina Market, By Application, 2014–2021 (USD Million)
Table 65 Colombia Market, By Application, 2014–2021 (USD Million)
Table 66 Peru Market, By Application, 2014–2021 (USD Million)
Table 67 Rest of South America Market, By Application, 2014–2021 (USD Million)
Table 68 New Product Launches, 2013–2017(January)
Table 69 Expansions, 2013–2017(January)
Table 70 Mergers & Acquisitions, 2013–2017 (January)
Table 71 Agreements, 2013–2017(January)
Table 72 Collaborations, Contracts, and Partnerships, 2013–2017(January)
Table 73 New Technologies and Joint Ventures, 2013–2017(January)
List of Figures (38 Figures)
Figure 1 Market Segmentation
Figure 2 Market: Research Design
Figure 3 Bottom-Up Approach
Figure 4 Top-Down Approach
Figure 5 Market: Data Triangulation
Figure 6 Breakdown of Primary Interviews: By Company Type, Designation, and Region
Figure 7 The Glass Fiber Type Segment Led the Market in 2016
Figure 8 The Aerospace & Defense Application Segment Led the Market in 2016
Figure 9 The Asia-Pacific Region Led the Market in 2016
Figure 10 Increasing Demand for High Performance Fibers for Various Applications to Fuel the Growth of the Market During the Forecast Period
Figure 11 The Asia-Pacific Market is Projected to Witness the Highest Growth Between 2016 and 2021
Figure 12 The Glass Fiber Segment Led the Market in 2016
Figure 13 The Aerospace & Defense Segment Contributed A Major Share to the Asia-Pacific Market in 2016
Figure 14 Drivers, Restraints, Opportunities, and Challenges in the Market
Figure 15 High Performance Fiber – Cost Structure Analysis
Figure 16 The Carbon Fiber Type Segment of the Market is Projected to Grow at the Highest CAGR From 2016 to 2021
Figure 17 The Automotive Application Segment of the Market is Projected to Grow at the Highest CAGR From 2016 to 2021
Figure 18 Market, Regional Growth Snapshot – Asia-Pacific Accounted for the Largest Share in 2016
Figure 19 Asia-Pacific Market Snapshot
Figure 20 Europe Market Snapshot
Figure 21 North America Market Snapshot
Figure 22 The Strategy of New Product Launches is Widely Adopted By the Key Players to Strengthen Their Position in the High Performance Fiber Market
Figure 23 Key Growth Strategies in the High Performance Fiber Market Between 2013 and 2017 (January)
Figure 24 Teijin Ltd. Accounted for the Largest Share of the Total Developments That Took Place in the High Performance Fiber Market Between 2013 and 2017( January)
Figure 25 Toray Industries Inc. Accounted for the Largest Share of the Total Developments That Took Place of the High Performance Fiber Market in 2016
Figure 26 Number of Developments in the High Performance Fiber Market Between 2013 and 2016
Figure 27 Toray Industries Inc.: Company Snapshot
Figure 28 Toray Industries Inc.:SWOT Analysis
Figure 29 Teijin Ltd. : Company Snapshot
Figure 30 Teijin Ltd. : SWOT Analysis
Figure 31 E. I. Dupont De Nemours and Co.: Company Snapshot
Figure 32 E. I. Dupont De Nemours and Co.: SWOT Analysis
Figure 33 Mitsubishi Rayon Co., Ltd. : Company Snapshot
Figure 34 Owens Corning : Company Snapshot
Figure 35 Owens Corning : SWOT Analysis
Figure 36 Kureha Corporation: Business Overview
Figure 37 Yantai Tayho Advanced Materials Co., Ltd: SWOT Analysis
Figure 38 Koninklijke Ten Cate NV: Business Overview


Growth opportunities and latent adjacency in High Performance Fiber Market