Optical Interconnect Market by Product Category (Cable Assemblies, Connectors, Optical Transceivers), Interconnect Level, Fiber Mode, Data Rate, Distance, Application (Data Communication, Telecommunication), Region - Global Forecast to 2035


Optical Interconnect Market Summary
Optical Interconnect Key Market Trends & Insights
Optical Interconnect Market Size & Forecast
- Base Year Market Size (2025): USD 12.5 Billion
- Forecast Market Size (2035): USD 48.2 Billion
- CAGR (2025–2035): 14.3%
Optical Interconnect Market Top 10 key takeaway
- The market is expected to grow nearly 4x between 2025 and 2035.
- Hyperscale data centers are the largest demand driver globally.
- Silicon photonics is becoming the core enabling technology.
- Co-packaged optics is emerging as a major innovation trend.
- AI model training significantly increases interconnect bandwidth demand.
- North America remains the dominant regional market.
- Asia Pacific is the fastest-growing regional market.
- Telecom 5G/6G infrastructure is boosting optical interconnect adoption.
- Energy efficiency regulations are accelerating copper-to-optical transition.
- Edge computing expansion is reshaping network architecture requirements.
Optical Interconnect Market Product Insights
Optical Interconnect Market Technology / Component Insights
Technology / Component Insights:
- Rising adoption of silicon photonics technology
- AI-based network traffic optimization systems
- Growth of co-packaged optics architectures
- Expansion of photonic integrated circuits (PICs)
- Increasing demand for energy-efficient optical networking
Optical Interconnect Market Application Insights
- Data centers dominate global demand
- Telecom sector driven by 5G/6G expansion
- AI and HPC clusters require ultra-low latency
- Cloud computing accelerates optical adoption
- Emerging use in autonomous and industrial systems
Optical Interconnect Market Regional Insights
- North America leads with hyperscale data centers
- Europe driven by sustainability and telecom upgrades
- Asia Pacific fastest-growing due to digital expansion
- Middle East investing in smart city infrastructure
- Latin America emerging in cloud infrastructure adoption
Optical Interconnect Market Specific Market Trends
- China leads APAC with AI infrastructure growth
- Japan focuses on advanced photonics innovation
- United States dominates hyperscale data center expansion
- Germany leads Europe in industrial digitalization
- France and Canada invest in telecom and cloud growth
Key Optical Interconnect Market Company Insights
- Focus on silicon photonics integration
- AI-driven optical networking solutions
- Expansion of co-packaged optics technologies
- Strong investment in R&D for high-speed connectivity
- Strategic partnerships with hyperscale cloud providers
Optical Interconnect Market Segmentation
- Optical transceivers dominate product segment
- Silicon photonics leads technology innovation
- Data centers remain key application area
- Asia Pacific fastest-growing region
- North America maintains market leadership
Optical Interconnect Market Conclusion
Optical Interconnect Market War Impact
- Semiconductor supply chain disruptions increased costs
- Regional shift in photonics manufacturing bases
- Delays in global data center deployments
- Rising emphasis on supply chain resilience
- Increased government investment in domestic chip production
Optical Interconnect Market Recent Developments
Key companies include Intel Corporation, Cisco Systems, Broadcom Inc., Nvidia Corporation, Marvell Technology, Coherent Corp., and Lumentum Holdings..
To speak to our analyst for a discussion on the above findings, click Speak to Analyst
 Exclusive indicates content/data unique to MarketsandMarkets and not available with any competitors.
TABLE OF CONTENTS
1 INTRODUCTION (Page No. - 21)
1.1 STUDY OBJECTIVES
1.2 MARKET DEFINITION AND SCOPE
1.2.1 INCLUSIONS AND EXCLUSIONS
1.3 MARKETS COVERED
1.3.1 GEOGRAPHIC SCOPE
1.3.2 YEARS CONSIDERED
1.4 CURRENCY
1.5 LIMITATIONS
1.6 MARKET STAKEHOLDERS
1.7 SUMMARY OF CHANGES
2 RESEARCH METHODOLOGY (Page No. - 26)
2.1 RESEARCH DATA
2.1.1 SECONDARY DATA
2.1.1.1 List of major secondary sources
2.1.1.2 Secondary sources
2.1.2 PRIMARY DATA
2.1.2.1 Breakdown of primaries
2.1.2.2 Key data from primary sources
2.2 MARKET SIZE ESTIMATION
2.2.1 BOTTOM-UP APPROACH
2.2.1.1 Approach for capturing market size using bottom-up analysis (demand side)
2.2.2 TOP-DOWN APPROACH
2.2.2.1 Approach for capturing market share using top-down analysis (supply side)
2.3 MARKET BREAKDOWN AND DATA TRIANGULATION
2.4 RESEARCH ASSUMPTIONS
3 EXECUTIVE SUMMARY (Page No. - 37)
4 PREMIUM INSIGHTS (Page No. - 41)
4.1 ATTRACTIVE GROWTH OPPORTUNITIES IN OPTICAL INTERCONNECT MARKET
4.2 MARKET, BY COUNTRY
4.3 MARKET, BY REGION
4.4 MARKET, BY APPLICATION AND REGION
5 MARKET OVERVIEW (Page No. - 43)
5.1 INTRODUCTION
5.2 MARKET DYNAMICS
5.2.1 DRIVERS
5.2.1.1 Rise in global deployment of datacenters
5.2.1.2 Surge in global adoption of cloud computing, big data analytics, and IoT
5.2.2 RESTRAINTS
5.2.2.1 High deployment costs of optical interconnects
5.2.2.2 Data losses suffered during high-frequency long-distance data transmission
5.2.3 OPPORTUNITIES
5.2.3.1 Increase in use of optical interconnects in high-performance computing applications
5.2.3.2 Rise in demand for chip-level optical interconnects used in multicore processors and 3D chips
5.2.3.3 Continuous developments in 5G network infrastructures
5.2.4 CHALLENGES
5.2.4.1 Continuous requirement to optimize size of optical interconnects
5.3 VALUE CHAIN ANALYSIS
5.3.1 OPTICAL INTERCONNECT VALUE CHAIN
5.4 COVID-19 IMPACT ON OPTICAL INTERCONNECT MARKET
6 CASE STUDIES (Page No. - 52)
6.1 INTRODUCTION
6.2 OAK RIDGE NATIONAL LABORATORY (US)
6.3 OLYMPIA EYE & LASER CENTRE (NAMIBIA)
6.4 EUROPEAN CENTRE FOR MEDIUM-RANGE WEATHER FORECASTS (UK)
7 OPTICAL INTERCONNECT MARKET, BY PRODUCT CATEGORY (Page No. - 53)
7.1 INTRODUCTION
7.2 CABLE ASSEMBLIES
7.2.1 INDOOR CABLE ASSEMBLIES
7.2.1.1 High demand for indoor cable assemblies for intra-datacenter interconnections
7.2.2 OUTDOOR CABLE ASSEMBLIES
7.2.2.1 Rise in adoption of outdoor cable assemblies for long-distance data transmission
7.2.3 ACTIVE OPTICAL CABLES
7.2.3.1 Surge in demand for AOCs for short-distance multilane data communication and interconnection applications
7.2.4 MULTI-SOURCE AGREEMENTS
7.2.4.1 QSFP
7.2.4.1.1 QSFP multi-source agreements support Ethernet, fiber channels, and SONET/SDH standards
7.2.4.2 CXP
7.2.4.2.1 High demand for CXP multi-source agreements for 100G applications
7.2.4.3 CFP
7.2.4.3.1 CFP multi-source agreements enable 40, 100, and 400 Gbps data transmissions
7.2.4.4 CDFP
7.2.4.4.1 Increase in adoption of CDFP multi-source agreements in telecommunication applications
7.2.4.5 Others
7.3 CONNECTORS
7.3.1 LC CONNECTORS
7.3.1.1 Significant demand for LC connectors owing to low insertion losses and high density
7.3.2 SC CONNECTORS
7.3.2.1 Increased adoption of SC connectors in telecommunication networks
7.3.3 ST CONNECTORS
7.3.3.1 Surged demand for ST connectors in LAN and data processing network applications
7.3.4 MPO/MTP CONNECTORS
7.3.4.1 Increased adoption of MPO/MTP connectors in telecommunication and Gigabit Ethernet applications
7.4 OPTICAL TRANSCEIVERS
7.4.1 SIGNIFICANT DEVELOPMENTS IN OPTICAL TRANSCEIVERS WITH ADVENT OF TRANSCEIVERS WITH 10, 40, 100, AND 400 GBPS DATA RATE
7.5 FREE SPACE OPTICS, FIBER, AND WAVEGUIDES
7.5.1 FREE SPACE OPTICS, FIBERS, AND WAVEGUIDES USE FREE AIR TO TRANSMIT DATA
7.6 SILICON PHOTONICS
7.6.1 LOW- COST AND HIGH-VOLUME ASSEMBLY OF SEMICONDUCTORS ENABLED BY SILICON PHOTONICS
7.7 PIC-BASED INTERCONNECTS
7.7.1 PIC-BASED INTERCONNECTS SEGMENT OF MARKET TO GROW AT HIGHEST CAGR FROM 2020 TO 2025
7.8 OPTICAL ENGINES
7.8.1 OPTICAL ENGINES COMPRISE LOW POWER CONSUMPTION AND HIGHEST-DENSITY OPTICAL INTERFACES
8 OPTICAL INTERCONNECT MARKET, BY INTERCONNECT LEVEL (Page No. - 64)
8.1 INTRODUCTION
8.2 METRO AND LONG-HAUL OPTICAL INTERCONNECT
8.2.1 RISE IN ADOPTION OF METRO AND LONG-HAUL OPTICAL INTERCONNECT FOR TELECOMMUNICATION NETWORKS
8.3 BOARD-TO-BOARD AND RACK-LEVEL OPTICAL INTERCONNECT
8.3.1 INCREASE IN DEMAND FOR BOARD-TO-BOARD AND RACK-LEVEL OPTICAL INTERCONNECTIONS FOR FAST AND GREEN SYSTEMS
8.4 CHIP- AND BOARD-LEVEL OPTICAL INTERCONNECT
8.4.1 SURGE IN USE OF CHIP- AND BOARD-LEVEL OPTICAL INTERCONNECTIONS FOR DATACENTERS
9 OPTICAL INTERCONNECT MARKET, BY FIBER MODE (Page No. - 74)
9.1 INTRODUCTION
9.2 SINGLE MODE FIBER
9.2.1 SINGLE MODE FIBERS REDUCE DATA LOSSES IN LONG-DISTANCE DATA TRANSMISSIONS
9.3 MULTIMODE FIBER
9.3.1 STEP-INDEX MULTIMODE FIBER
9.3.1.1 Rise in use of step-index multimode fibers in short-distance applications
9.3.2 GRADED-INDEX MULTIMODE FIBER
9.3.2.1 Surge in demand for graded-index multimode fibers for less attenuation and high bandwidth signal transmissions
10 OPTICAL INTERCONNECT MARKET, BY DATA RATE (Page No. - 79)
10.1 INTRODUCTION
10.2 LESS THAN 10 GBPS
10.2.1 HIGH DEMAND FOR OPTICAL INTERCONNECTS WITH LESS THAN 10 GBPS DATA RATE OWING TO THEIR LOW POWER CONSUMPTION
10.3 10 GBPS TO 40 GBPS
10.3.1 INCREASE IN DEPLOYMENT OF OPTICAL INTERCONNECTS WITH 10 GBPS TO 40 GBPS DATA RATE IN TELECOMMUNICATION APPLICATIONS
10.4 41 GBPS TO 100 GBPS
10.4.1 RISE IN ADOPTION OF OPTICAL INTERCONNECTS WITH 41 GBPS TO 100 GBPS DATA RATE BY CLOUD SERVICE PROVIDERS
10.5 MORE THAN 100 GBPS
10.5.1 INCREASE IN ADOPTION OF MORE THAN 100 GBPS OPTICAL INTERCONNECTS IN 5G INFRASTRUCTURES
11 OPTICAL INTERCONNECT MARKET, BY DISTANCE (Page No. - 83)
11.1 INTRODUCTION
11.2 LESS THAN 1 KM
11.2.1 INCREASE IN DEPLOYMENT OF OPTICAL INTERCONNECTS IN DATACENTERS FOR LESS THAN 1 KM DATA TRANSMISSION
11.3 1 KM TO 10 KM
11.3.1 RISE IN USE OF OPTICAL INTERCONNECTS WITH 1 KM TO 10 KM DISTANCE RANGE FOR INTRA-DATACENTER INTERCONNECTIONS
11.4 11 KM TO 100 KM
11.4.1 SURGE IN DEMAND FOR OPTICAL INTERCONNECTS WITH DATA TRANSMISSION DISTANCE RANGING FROM 11 KM TO 100 KM
11.5 MORE THAN 100 KM
11.5.1 INCREASE IN DEMAND FOR OPTICAL INTERCONNECTS CAPABLE OF TRANSMITTING DATA FOR DISTANCE OF MORE THAN 100 KM
12 OPTICAL INTERCONNECT MARKET, BY APPLICATION (Page No. - 87)
12.1 INTRODUCTION
12.2 DATA COMMUNICATION
12.2.1 DATACENTERS
12.2.1.1 Surged demand for data storage and transfer to contribute to increased use of optical interconnects in datacenters
12.2.2 HIGH-PERFORMANCE COMPUTING (HPC)
12.2.2.1 Increased demand for aggregated computing to fuel use of optical interconnects in high-performance computing applications
12.3 TELECOMMUNICATION
12.3.1 DEVELOPMENTS IN 5G NETWORK INFRASTRUCTURES TO FUEL DEMAND FOR OPTICAL INTERCONNECTS USED IN TELECOMMUNICATION APPLICATIONS
13 GEOGRAPHIC ANALYSIS (Page No. - 103)
13.1 INTRODUCTION
13.2 NORTH AMERICA
13.2.1 US
13.2.1.1 US to lead market in North America from 2020 to 2025
13.2.2 CANADA
13.2.2.1 Surged demand for high-speed wired and wireless networking services to drive growth of market in Canada
13.2.3 MEXICO
13.2.3.1 Increased adoption of 5G network services in Mexico
13.3 EUROPE
13.3.1 UK
13.3.1.1 Significant investments for development of infrastructure to support 5G technology and datacenters in UK
13.3.2 GERMANY
13.3.2.1 Increased adoption of connected and IoT-enabled devices to drive growth of optical interconnect market in Germany
13.3.3 FRANCE
13.3.3.1 Presence of leading telecom operators to facilitate 5G communication in France
13.3.4 NETHERLANDS
13.3.4.1 Initiatives undertaken by government to contribute to growth of optical interconnect market in Netherlands
13.3.5 REST OF EUROPE
13.4 APAC
13.4.1 CHINA
13.4.1.1 Presence of key datacenter companies fueling growth of market in China
13.4.2 JAPAN
13.4.2.1 Transition of manufacturing industry toward high-speed networks to spur growth of optical interconnect market in Japan
13.4.3 INDIA
13.4.3.1 Increased Internet penetration to fuel demand for optical interconnects in India
13.4.4 SOUTH KOREA
13.4.4.1 Early adoption of 5G network services driving demand for optical interconnects in South Korea
13.4.5 REST OF APAC
13.5 REST OF THE WORLD (ROW)
13.5.1 SOUTH AMERICA
13.5.1.1 Initiatives undertaken by 5G service providers to create demand for optical interconnects in South America
13.5.2 MIDDLE EAST AND AFRICA
13.5.2.1 Surged demand for high-speed data communication in Middle East and Africa
14 COMPETITIVE LANDSCAPE (Page No. - 129)
14.1 INTRODUCTION
14.2 MARKET RANKING ANALYSIS, 2019
14.3 MARKET EVALUATION FRAMEWORK
14.3.1 PRODUCT LAUNCHES AND DEVELOPMENTS
14.3.2 ACQUISITIONS
14.3.3 COLLABORATIONS AND CONTRACTS
14.3.4 EXPANSIONS
15 COMPANY EVALUATION MATRIX (Page No. - 137)
15.1 OVERVIEW
15.2 COMPANY EVALUATION MATRIX DEFINITION AND METHODOLOGY
15.2.1 MARKET SHARE/RANKING
15.2.2 STAR
15.2.3 PERVASIVE
15.2.4 EMERGING LEADERS
15.2.5 BURGEONING PLAYERS
15.3 COMPANY EVOLUTIONS MATRIX, 2019
15.4 STRENGTH OF PRODUCT PORTFOLIO
15.5 BUSINESS STRATEGY EXCELLENCE
16 COMPANY PROFILES (Page No. - 142)
16.1 KEY PLAYERS
(Business Overview, Products/Solutions/Services offered, Recent Developments, SWOT Analysis, and MnM View)*
16.1.1 II-VI INCORPORATED
16.1.2 LUMENTUM OPERATIONS LLC
16.1.3 MOLEX, LLC
16.1.4 INNOLIGHT TECHNOLOGY (SUZHOU) LTD.
16.1.5 NVIDIA CORPORATION
16.1.6 SUMITOMO ELECTRIC INDUSTRIES, LTD.
16.1.7 BROADCOM INC.
16.1.8 TE CONNECTIVITY
16.1.9 FUJITSU LTD.
16.1.10 INFINERA CORPORATION
* Business Overview, Products/Solutions/Services offered, Recent Developments, SWOT Analysis, and MnM View might not be captured in case of unlisted companies.
16.2 RIGHT TO WIN
16.3 OTHER KEY PLAYERS
16.3.1 ACACIA COMMUNICATIONS, INC.
16.3.2 ACCELINK TECHNOLOGY CO. LTD.
16.3.3 JUNIPER NETWORKS, INC.
16.3.4 AMPHENOL CORPORATION
16.3.5 NEOPHOTONICS CORPORATION
16.4 STARTUP ECOSYSTEM
16.4.1 OPTOSCRIBE LTD.
16.4.2 SMITHS INTERCONNECT
16.4.3 CAILABS
16.4.4 FIBERPLEX TECHNOLOGIES, LLC
16.4.5 CLEERLINE TECHNOLOGY GROUP
17 APPENDIX (Page No. - 175)
17.1 DISCUSSION GUIDE
17.2 KNOWLEDGE STORE: MARKETSANDMARKETS’ SUBSCRIPTION PORTAL
17.3 AVAILABLE CUSTOMIZATIONS
17.4 RELATED REPORTS
17.5 AUTHOR DETAILS
LIST OF TABLES (109 TABLES)
TABLE 1 OPTICAL INTERCONNECT MARKET, BY PRODUCT CATEGORY, 2017–2025 (USD MILLION)
TABLE 2 MARKET FOR CABLE ASSEMBLIES, BY INTERCONNECT LEVEL, 2017–2025 (USD MILLION)
TABLE 3 MARKET FOR CABLE ASSEMBLIES, BY MULTI-SOURCE AGREEMENT, 2017–2025 (USD MILLION)
TABLE 4 MARKET FOR CONNECTORS, BY INTERCONNECT LEVEL, 2017–2025 (USD MILLION)
TABLE 5 MARKET FOR OPTICAL TRANSCEIVERS, BY INTERCONNECT LEVEL, 2017–2025 (USD MILLION)
TABLE 6 MARKET, BY INTERCONNECT LEVEL, 2017–2025 (USD MILLION)
TABLE 7 METRO AND LONG-HAUL MARKET, BY TYPE, 2017–2025 (USD MILLION)
TABLE 8 METRO AND LONG-HAUL MARKET, BY PRODUCT CATEGORY, 2017–2025 (USD MILLION)
TABLE 9 METRO AND LONG-HAUL MARKET, BY APPLICATION, 2017–2025 (USD MILLION)
TABLE 10 METRO AND LONG-HAUL MARKET FOR DATA COMMUNICATION, BY REGION, 2017–2025 (USD MILLION)
TABLE 11 METRO AND LONG-HAUL MARKET FOR TELECOMMUNICATION, BY REGION, 2017–2025 (USD MILLION)
TABLE 12 BOARD-TO-BOARD AND RACK-LEVEL MARKET, BY PRODUCT CATEGORY, 2017–2025 (USD MILLION)
TABLE 13 BOARD-TO-BOARD AND RACK-LEVELMARKET FOR CONNECTORS, BY TYPE, 2017–2025 (USD MILLION)
TABLE 14 BOARD-TO-BOARD AND RACK-LEVEL MARKET, BY APPLICATION, 2017–2025 (USD MILLION)
TABLE 15 BOARD-TO-BOARD AND RACK-LEVEL OPTICAL INTERCONNECT FOR DATA COMMUNICATION, BY APPLICATION TYPE, 2017–2025 (USD MILLION)
TABLE 16 BOARD-TO-BOARD AND RACK-LEVEL OPTICAL INTERCONNECT FOR DATA COMMUNICATION, BY REGION, 2017–2025 (USD MILLION)
TABLE 17 BOARD-TO-BOARD AND RACK-LEVEL OPTICAL INTERCONNECT DATA COMMUNICATION MARKET FOR DATACENTERS, BY REGION, 2017–2025 (USD MILLION)
TABLE 18 BOARD-TO-BOARD AND RACK-LEVEL OPTICAL INTERCONNECT DATA COMMUNICATION MARKET FOR HIGH-PERFORMANCE COMPUTING, BY REGION, 2017–2025 (USD MILLION)
TABLE 19 BOARD-TO-BOARD AND RACK-LEVEL OPTICAL INTERCONNECT FOR TELECOMMUNICATION, BY REGION, 2017–2025 (USD MILLION)
TABLE 20 CHIP- AND BOARD-LEVEL OPTICAL INTERCONNECT , BY PRODUCT CATEGORY, 2017–2025 (USD MILLION)
TABLE 21 CHIP- AND BOARD-LEVEL OPTICAL INTERCONNECT FOR DATA COMMUNICATION, BY APPLICATION TYPE, 2017–2025 (USD MILLION)
TABLE 22 CHIP- AND BOARD-LEVEL OPTICAL INTERCONNECT FOR DATA COMMUNICATION, BY REGION, 2017–2025 (USD MILLION)
TABLE 23 CHIP- AND BOARD-LEVEL OPTICAL INTERCONNECT DATA COMMUNICATION MARKET FOR DATACENTERS, BY REGION, 2017–2025 (USD MILLION)
TABLE 24 CHIP- AND BOARD-LEVEL OPTICAL INTERCONNECT DATA COMMUNICATION MARKET FOR HIGH-PERFORMANCE COMPUTING, BY REGION, 2017–2025 (USD MILLION)
TABLE 25 MARKET, BY FIBER MODE, 2017–2025 (USD MILLION)
TABLE 26 MARKET FOR SINGLE MODE FIBER, BY APPLICATION, 2017–2025 (USD MILLION)
TABLE 27 MARKET FOR SINGLE MODE FIBER, BY APPLICATION TYPE, 2017–2025 (USD MILLION)
TABLE 28 MARKET FOR MULTIMODE FIBER, BY APPLICATION, 2017–2025 (USD MILLION)
TABLE 29 MARKET FOR MULTIMODE FIBER, BY APPLICATION TYPE, 2017–2025 (USD MILLION)
TABLE 30 MARKET, BY DATA RATE, 2017–2025 (USD MILLION)
TABLE 31 MARKET, BY DISTANCE, 2017–2025 (USD MILLION)
TABLE 32 MARKET, BY APPLICATION, 2017–2025 (USD MILLION)
TABLE 33 MARKET FOR DATA COMMUNICATION, BY APPLICATION TYPE, 2017–2025 (USD MILLION)
TABLE 34 MARKET FOR DATA COMMUNICATION, BY FIBER MODE, 2017–2025 (USD MILLION)
TABLE 35 MARKET FOR DATA COMMUNICATION, BY INTERCONNECT LEVEL, 2017–2025 (USD MILLION)
TABLE 36 MARKET FOR DATA COMMUNICATION, BY REGION, 2017–2025 (USD MILLION)
TABLE 37 MARKET IN NORTH AMERICA FOR DATA COMMUNICATION, BY COUNTRY, 2017–2025 (USD MILLION)
TABLE 38 MARKET IN EUROPE FOR DATA COMMUNICATION, BY COUNTRY, 2017–2025 (USD MILLION)
TABLE 39 MARKET IN APAC FOR DATA COMMUNICATION, BY COUNTRY, 2017–2025 (USD MILLION)
TABLE 40 MARKET IN ROW FOR DATA COMMUNICATION, BY REGION, 2017–2025 (USD MILLION)
TABLE 41 OPTICAL INTERCONNECT DATA COMMUNICATION MARKET FOR DATACENTERS, BY FIBER MODE, 2017–2025 (USD MILLION)
TABLE 42 OPTICAL INTERCONNECT DATA COMMUNICATION MARKET FOR DATACENTERS, BY INTERCONNECT LEVEL, 2017–2025 (USD MILLION)
TABLE 43 OPTICAL INTERCONNECT DATA COMMUNICATION MARKET FOR DATACENTERS, BY REGION, 2017–2025 (USD MILLION)
TABLE 44 OPTICAL INTERCONNECT DATA COMMUNICATION MARKET IN NORTH AMERICA FOR DATACENTERS, BY COUNTRY, 2017–2025 (USD MILLION)
TABLE 45 OPTICAL INTERCONNECT DATA COMMUNICATION MARKET IN EUROPE FOR DATACENTERS, BY COUNTRY, 2017–2025 (USD MILLION)
TABLE 46 OPTICAL INTERCONNECT DATA COMMUNICATION MARKET IN APAC FOR DATACENTERS, BY COUNTRY, 2017–2025 (USD MILLION)
TABLE 47 OPTICAL INTERCONNECT DATA COMMUNICATION MARKET IN ROW FOR DATACENTERS, BY REGION, 2017–2025 (USD MILLION)
TABLE 48 OPTICAL INTERCONNECT DATA COMMUNICATION MARKET FOR HIGH-PERFORMANCE COMPUTING, BY FIBER MODE, 2017–2025 (USD MILLION)
TABLE 49 OPTICAL INTERCONNECT DATA COMMUNICATION MARKET FOR HIGH-PERFORMANCE COMPUTING, BY INTERCONNECT LEVEL, 2017–2025 (USD MILLION)
TABLE 50 OPTICAL INTERCONNECT DATA COMMUNICATION MARKET FOR HIGH-PERFORMANCE COMPUTING, BY REGION, 2017–2025 (USD MILLION)
TABLE 51 OPTICAL INTERCONNECT DATA COMMUNICATION MARKET IN NORTH AMERICA FOR HIGH-PERFORMANCE COMPUTING, BY COUNTRY, 2017–2025 (USD MILLION)
TABLE 52 OPTICAL INTERCONNECT DATA COMMUNICATION MARKET IN EUROPE FOR HIGH-PERFORMANCE COMPUTING, BY COUNTRY, 2017–2025 (USD MILLION)
TABLE 53 OPTICAL INTERCONNECT DATA COMMUNICATION MARKET IN APAC FOR HIGH-PERFORMANCE COMPUTING, BY COUNTRY, 2017–2025 (USD MILLION)
TABLE 54 OPTICAL INTERCONNECT DATA COMMUNICATION MARKET IN ROW FOR HIGH-PERFORMANCE COMPUTING, BY REGION, 2017–2025 (USD MILLION)
TABLE 55 OPTICAL INTERCONNECT MARKET FOR TELECOMMUNICATION, BY EQUIPMENT TYPE, 2017–2025 (USD MILLION)
TABLE 56 MARKET FOR TELECOMMUNICATION, BY FIBER MODE, 2017–2025 (USD MILLION)
TABLE 57 MARKET FOR TELECOMMUNICATION, BY INTERCONNECT LEVEL, 2017–2025 (USD MILLION)
TABLE 58 MARKET FOR TELECOMMUNICATION, BY REGION, 2017–2025 (USD MILLION)
TABLE 59 MARKET IN NORTH AMERICA FOR TELECOMMUNICATION, BY COUNTRY, 2017–2025 (USD MILLION)
TABLE 60 MARKET IN EUROPE FOR TELECOMMUNICATION, BY COUNTRY, 2017–2025 (USD MILLION)
TABLE 61 MARKET IN APAC FOR TELECOMMUNICATION, BY COUNTRY, 2017–2025 (USD MILLION)
TABLE 62 MARKET IN ROW FOR TELECOMMUNICATION, BY REGION, 2017–2025 (USD MILLION)
TABLE 63 MARKET, BY REGION, 2017–2025 (USD MILLION)
TABLE 64 MARKET IN NORTH AMERICA, BY INTERCONNECT LEVEL, 2017–2025 (USD MILLION)
TABLE 65 MARKET IN NORTH AMERICA, BY APPLICATION, 2017–2025 (USD MILLION)
TABLE 66 MARKET IN NORTH AMERICA, BY COUNTRY, 2017–2025 (USD MILLION)
TABLE 67 MARKET IN US, BY APPLICATION, 2017–2025 (USD MILLION)
TABLE 68 MARKET IN US FOR DATA COMMUNICATION, BY APPLICATION TYPE, 2017–2025 (USD MILLION)
TABLE 69 MARKET IN CANADA, BY APPLICATION, 2017–2025 (USD MILLION)
TABLE 70 MARKET IN CANADA FOR DATA COMMUNICATION, BY APPLICATION TYPE, 2017–2025 (USD MILLION)
TABLE 71 MARKET IN MEXICO, BY APPLICATION, 2017–2025 (USD MILLION)
TABLE 72 MARKET IN MEXICO FOR DATA COMMUNICATION, BY APPLICATION TYPE, 2017–2025 (USD MILLION)
TABLE 73 MARKET IN EUROPE, BY INTERCONNECT LEVEL, 2017–2025 (USD MILLION)
TABLE 74 MARKET IN EUROPE, BY APPLICATION, 2017–2025 (USD MILLION)
TABLE 75 MARKET IN EUROPE, BY COUNTRY, 2017–2025 (USD MILLION)
TABLE 76 MARKET IN UK, BY APPLICATION, 2017–2025 (USD MILLION)
TABLE 77 MARKET IN UK FOR DATA COMMUNICATION, BY APPLICATION TYPE, 2017–2025 (USD MILLION)
TABLE 78 MARKET IN GERMANY, BY APPLICATION, 2017–2025 (USD MILLION)
TABLE 79 MARKET IN GERMANY FOR DATA COMMUNICATION, BY APPLICATION TYPE, 2017–2025 (USD MILLION)
TABLE 80 MARKET IN FRANCE, BY APPLICATION, 2017–2025 (USD MILLION)
TABLE 81 MARKET IN FRANCE FOR DATA COMMUNICATION, BY APPLICATION TYPE, 2017–2025 (USD MILLION)
TABLE 82 MARKET IN NETHERLANDS, BY APPLICATION, 2017–2025 (USD MILLION)
TABLE 83 MARKET IN NETHERLANDS FOR DATA COMMUNICATION, BY APPLICATION TYPE, 2017–2025 (USD MILLION)
TABLE 84 MARKET IN REST OF EUROPE, BY APPLICATION, 2017–2025 (USD MILLION)
TABLE 85 MARKET IN REST OF EUROPE FOR DATA COMMUNICATION, BY APPLICATION TYPE, 2017–2025 (USD MILLION)
TABLE 86 MARKET IN APAC, BY INTERCONNECT LEVEL, 2017–2025 (USD MILLION)
TABLE 87 MARKET IN APAC, BY APPLICATION, 2017–2025 (USD MILLION)
TABLE 88 MARKET IN APAC, BY COUNTRY, 2017–2025 (USD MILLION)
TABLE 89 MARKET IN CHINA, BY APPLICATION, 2017–2025 (USD MILLION)
TABLE 90 MARKET IN CHINA FOR DATA COMMUNICATION, BY APPLICATION TYPE, 2017–2025 (USD MILLION)
TABLE 91 MARKET IN JAPAN, BY APPLICATION, 2017–2025 (USD MILLION)
TABLE 92 MARKET IN JAPAN FOR DATA COMMUNICATION, BY APPLICATION TYPE, 2017–2025 (USD MILLION)
TABLE 93 MARKET IN INDIA, BY APPLICATION, 2017–2025 (USD MILLION)
TABLE 94 MARKET IN INDIA FOR DATA COMMUNICATION, BY APPLICATION TYPE, 2017–2025 (USD MILLION)
TABLE 95 MARKET IN SOUTH KOREA, BY APPLICATION, 2017–2025 (USD MILLION)
TABLE 96 MARKET IN SOUTH KOREA FOR DATA COMMUNICATION, BY APPLICATION TYPE, 2017–2025 (USD MILLION)
TABLE 97 MARKET IN REST OF APAC, BY APPLICATION, 2017–2025 (USD MILLION)
TABLE 98 MARKET IN REST OF APAC FOR DATA COMMUNICATION, BY APPLICATION TYPE, 2017–2025 (USD MILLION)
TABLE 99 MARKET IN ROW, BY INTERCONNECT LEVEL, 2017–2025 (USD MILLION)
TABLE 100 MARKET IN ROW, BY APPLICATION, 2017–2025 (USD MILLION)
TABLE 101 MARKET IN ROW, BY REGION, 2017–2025 (USD MILLION)
TABLE 102 MARKET IN SOUTH AMERICA, BY APPLICATION, 2017–2025 (USD MILLION)
TABLE 103 MARKET IN SOUTH AMERICA FOR DATA COMMUNICATION, BY APPLICATION TYPE, 2017–2025 (USD MILLION)
TABLE 104 MARKET IN MIDDLE EAST AND AFRICA, BY APPLICATION, 2017–2025 (USD MILLION)
TABLE 105 MARKET IN MIDDLE EAST AND AFRICA FOR DATA COMMUNICATION, BY APPLICATION TYPE, 2017–2025 (USD MILLION)
TABLE 106 PRODUCT LAUNCHES AND DEVELOPMENTS, SEPTEMBER 2018– APRIL 2020
TABLE 107 ACQUISITIONS, SEPTEMBER 2018 – APRIL 2020
TABLE 108 COLLABORATIONS AND CONTRACTS, SEPTEMBER 2018 – APRIL 2020
TABLE 109 EXPANSIONS, SEPTEMBER 2018– APRIL 2020
LIST OF FIGURES (65 FIGURES)
FIGURE 1 OPTICAL INTERCONNECT MARKET: RESEARCH DESIGN
FIGURE 2 MARKET SIZE ESTIMATION METHODOLOGY: APPROACH 1 (SUPPLY SIDE): REVENUE GENERATED BY COMPANIES FROM SALES OF OPTICAL INTERCONNECTS
FIGURE 3 MARKET SIZE ESTIMATION METHODOLOGY: APPROACH 2 – BOTTOM-UP (SUPPLY SIDE): ILLUSTRATIVE EXAMPLE OF COMPANY OPERATING IN MARKET
FIGURE 4 MARKET SIZE ESTIMATION METHODOLOGY: APPROACH 3 – BOTTOM-UP APPROACH FOR ESTIMATION OF SIZE OF OPTICAL TRANSCEIVER MARKET BASED ON FIBER MODE
FIGURE 5 MARKET SIZE ESTIMATION METHODOLOGY: BOTTOM-UP APPROACH
FIGURE 6 MARKET SIZE ESTIMATION METHODOLOGY: TOP-DOWN APPROACH
FIGURE 7 DATA TRIANGULATION
FIGURE 8 MULTIMODE FIBER SEGMENT OF MARKET TO GROW AT HIGH CAGR FROM 2020 TO 2025
FIGURE 9 41 GBPS TO 100 GBPS SEGMENT OF MARKET TO GROW AT HIGHEST CAGR FROM 2020 TO 2025
FIGURE 10 DATA COMMUNICATION SEGMENT OF MARKET TO GROW AT HIGH CAGR FROM 2020 TO 2025
FIGURE 11 MARKET IN APAC TO GROW AT HIGHEST CAGR FROM 2020 TO 2025
FIGURE 12 RISE IN GLOBAL DEPLOYMENT OF DATACENTERS TO FUEL MARKET GROWTH
FIGURE 13 MARKET IN CHINA TO GROW AT HIGHEST CAGR FROM 2020 TO 2025
FIGURE 14 NORTH AMERICA TO ACCOUNT FOR LARGEST SHARE OF MARKET IN 2025
FIGURE 15 DATA COMMUNICATION SEGMENT AND NORTH AMERICA TO ACCOUNT FOR LARGEST SHARES OF MARKET IN 2025
FIGURE 16 RISE IN GLOBAL DEPLOYMENT OF DATACENTERS
FIGURE 17 GROWTH IN GLOBAL NUMBER OF INTERNET USERS FROM 2018 TO 2023
FIGURE 18 MARKET DRIVERS AND THEIR IMPACT
FIGURE 19 MARKET RESTRAINTS AND THEIR IMPACT
FIGURE 20 GLOBAL 5G MARKET FORECAST TO 2025
FIGURE 21 MARKET OPPORTUNITIES AND THEIR IMPACT
FIGURE 22 MARKET CHALLENGES AND THEIR IMPACT
FIGURE 23 OPTICAL INTERCONNECT ECOSYSTEM: MAJOR VALUE ADDED BY OPTICAL INTERCONNECT MANUFACTURERS AND SYSTEM INTEGRATORS
FIGURE 24 MARKET, BY PRODUCT CATEGORY
FIGURE 25 PIC-BASED INTERCONNECTS SEGMENT OF OPTICAL INTERCONNECT MARKET PROJECTED TO GROW AT HIGHEST CAGR FROM 2020 TO 2025
FIGURE 26 CDFP MULTI-SOURCE AGREEMENTS SEGMENT OF MARKET PROJECTED TO GROW AT HIGHEST CAGR FROM 2020 TO 2025
FIGURE 27 MARKET, BY INTERCONNECT LEVEL
FIGURE 28 CHIP- AND BOARD-LEVEL OPTICAL INTERCONNECT SEGMENT OF MARKET PROJECTED TO GROW AT HIGHEST CAGR FROM 2020 TO 2025
FIGURE 29 METRO AND LONG-HAUL OPTICAL INTERCONNECT IN APAC FOR DATA COMMUNICATION PROJECTED TO GROW AT HIGHEST CAGR FROM 2020 TO 2025
FIGURE 30 HIGH-PERFORMANCE COMPUTING SEGMENT OF CHIP- AND BOARD-LEVEL MARKET FOR DATA COMMUNICATION TO GROW AT HIGH CAGR FROM 2020 TO 2025
FIGURE 31 MARKET, BY FIBER MODE
FIGURE 32 MULTIMODE FIBER SEGMENT OF MARKET TO GROW AT HIGHER CAGR FROM 2020 TO 2025
FIGURE 33 DATA COMMUNICATION SEGMENT OF MARKET FOR MULTIMODE FIBER TO GROW AT HIGH CAGR FROM 2020 TO 2025
FIGURE 34 MARKET, BY DATA RATE
FIGURE 35 41 GBPS TO 100 GBPS SEGMENT OF MARKET PROJECTED TO GROW AT HIGHEST CAGR FROM 2020 TO 2025
FIGURE 36 MARKET, BY DISTANCE
FIGURE 37 LESS THAN 1 KM SEGMENT OF MARKET PROJECTED TO GROW AT HIGHEST CAGR FROM 2020 TO 2025
FIGURE 38 MARKET, BY APPLICATION
FIGURE 39 DATA COMMUNICATION SEGMENT OF MARKET PROJECTED TO GROW AT HIGH CAGR FROM 2020 TO 2025
FIGURE 40 MARKET FOR DATA COMMUNICATION IN APAC PROJECTED TO GROW AT HIGHEST CAGR FROM 2020 TO 2025
FIGURE 41 OPTICAL INTERCONNECT DATA COMMUNICATION MARKET IN CHINA FOR DATACENTERS TO GROW AT HIGHEST CAGR FROM 2020 TO 2025
FIGURE 42 SINGLE MODE FIBER SEGMENT OF MARKET FOR TELECOMMUNICATION TO GROW AT HIGH CAGR FROM 2020 TO 2025
FIGURE 43 MARKET IN APAC TO GROW AT HIGHEST CAGR FROM 2020 TO 2025
FIGURE 44 NORTH AMERICA: MARKET SNAPSHOT
FIGURE 45 MARKET IN US TO GROW AT HIGHEST CAGR FROM 2020 TO 2025
FIGURE 46 EUROPE: MARKET SNAPSHOT
FIGURE 47 MARKET IN UK TO GROW AT HIGHEST CAGR FROM 2020 TO 2025
FIGURE 48 APAC: MARKET SNAPSHOT
FIGURE 49 MARKET IN CHINA TO GROW AT HIGHEST CAGR FROM 2020 TO 2025
FIGURE 50 MARKET IN SOUTH AMERICA TO GROW AT HIGHEST CAGR FROM 2020 TO 2025
FIGURE 51 COMPANIES ADOPTED PRODUCT LAUNCHES AND DEVELOPMENTS AS KEY GROWTH STRATEGY FROM SEPTEMBER 2018 TO APRIL 2020
FIGURE 52 RANKING OF TOP 5 PLAYERS IN MARKET
FIGURE 53 MARKET EVALUATION FRAMEWORK-PRODUCT LAUNCHES AND DEVELOPMENTS FUELED GROWTH AND INNOVATIONS FROM SEPTEMBER 2018 TO APRIL 2020
FIGURE 54 II-VI INCORPORATED LED MARKET IN 2019
FIGURE 55 COMPETITIVE EVOLUTION MATRIX, 2019
FIGURE 56 PRODUCT PORTFOLIO ANALYSIS OF TOP PLAYERS IN MARKET
FIGURE 57 BUSINESS STRATEGY EXCELLENCE OF TOP PLAYERS IN MARKET
FIGURE 58 II-VI INCORPORATED: COMPANY SNAPSHOT
FIGURE 59 LUMENTUM OPERATIONS LLC: COMPANY SNAPSHOT
FIGURE 60 MELLANOX TECHNOLOGIES, LTD. (PART OF NVIDIA CORPORATION): COMPANY SNAPSHOT
FIGURE 61 SUMITOMO ELECTRIC INDUSTRIES, LTD.: COMPANY SNAPSHOT
FIGURE 62 BROADCOM INC.: COMPANY SNAPSHOT
FIGURE 63 TE CONNECTIVITY: COMPANY SNAPSHOT
FIGURE 64 FUJITSU LTD.: COMPANY SNAPSHOT
FIGURE 65 INFINERA CORPORATION: COMPANY SNAPSHOT
The study involves four major activities for estimating the size of the optical interconnect market. Exhaustive secondary research has been carried out to collect information relevant to the market, the peer markets, and the parent market. Primary research has been undertaken to validate these findings, assumptions, and sizing with the industry experts across the value chain of the optical interconnect market. Both top-down and bottom-up approaches have been employed to estimate the complete market size. These have been followed by the market breakdown and data triangulation methods that have been used to estimate the size of different segments and subsegments of the market.
Secondary Research
The research methodology that has been used to estimate and forecast the size of the optical interconnect market began with the capturing of data related to the revenues of key vendors in the market through secondary research. This study involves the extensive use of secondary sources, directories, and databases (such as Hoovers, Bloomberg Businessweek, Factiva, and OneSource) to identify and collect information useful for a technical, market-oriented, and commercial study of the optical interconnect market. Vendor offerings have been taken into consideration to determine the market segmentation. The entire research methodology includes the study of the annual reports, press releases, and investor presentations of companies; white papers; and certified publications and articles by recognized authors; directories; and databases.
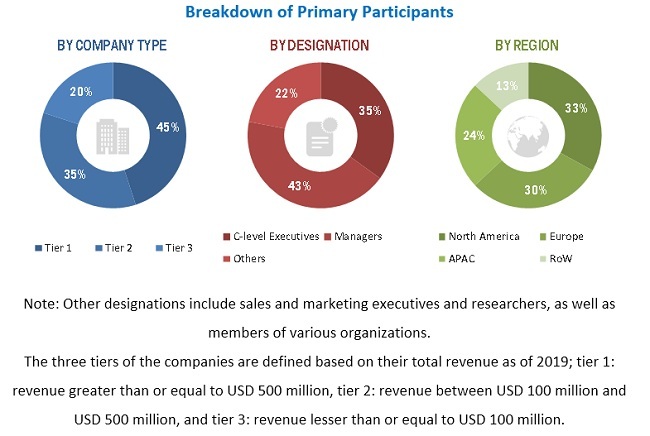
Primary Research
The optical interconnect market comprises several stakeholders, such as suppliers of the standard products and original equipment manufacturers (OEMs). The demand side of this market has been characterized by the development of optical interconnect products, as well as their use in different applications. The supply side has been characterized by advancements carried out in different optical interconnect products such as cable assemblies; connectors; optical transceivers; free space optics, fibers, and waveguides; silicon photonics; PIC-based interconnects; and optical engines. Various primary sources from both supply and demand sides of the market have been interviewed to obtain qualitative and quantitative information. Following is the breakdown of the primary respondents.
To know about the assumptions considered for the study, download the pdf brochure
Market Size Estimation
Both top-down and bottom-up approaches have been used to estimate and validate the size of the optical interconnect market and its segments. The research methodology used to estimate the market size includes the following:
- Key players in the market have been identified through extensive secondary research
- The supply chain of the manufacturing industry and the size of the optical interconnect market, in terms of value has been determined through primary and secondary research processes
- All percentage shares, splits, and breakdowns have been determined using secondary sources and verified through primary sources
Data Triangulation
After arriving at the overall market size—using the market size estimation process explained above—the total market has been split into several segments and subsegments. Data triangulation and market breakdown procedures have been employed, wherever applicable, to complete the overall market engineering process and arrive at the exact statistics of each market segment and subsegment. The data has been triangulated by studying various factors and trends from both demand and supply sides of the optical interconnect market.
Research Objectives
- To describe, segment, and forecast the optical interconnect market based on product category, data rate, distance, interconnect level, fiber mode, and application in terms of value
-
To describe and forecast the optical interconnect market size with regard to 4 main regions, namely, North America, Europe, Asia Pacific (APAC), and the Rest of the World (RoW), in terms
of value - To strategically analyze micromarkets1 with regard to individual growth trends, prospects, and contribution to the overall optical interconnect market
- To provide detailed information regarding drivers, restraints, opportunities, and challenges influencing the growth of the optical interconnect market
- To analyze opportunities in the market for stakeholders and provide a detailed competitive landscape for the market leaders
- To provide a detailed overview of the optical interconnect value chain
- To analyze competitive developments such as new product launches and developments , acquisitions, collaborations, contracts, and expansions, along with research and development (R&D) activities undertaken in the optical interconnect market
Available Customizations
Along with the market data, MarketsandMarkets offers customizations according to the specific requirements of companies. The following customization options are available for the report:
Company Information
- Detailed analysis and profiling of additional market players based on various blocks of the optical interconnect value chain
Critical Questions
- What are new application areas being explored by the providers of optical interconnect products?
- Who are the key players in the optical interconnect market, and how intense is the competition in this market?


Growth opportunities and latent adjacency in Optical Interconnect Market
I am interested in optical interconnects; photonic/electro-photonic integration for telecommuncations. Do you have such information in the report?