High Voltage Battery Market By Capacity (75-150, 151-225, 226-300, >300kWh), Type (NCA, NMC, LFP, Others), Range (100-250, 251-400, 401-550, >550 Miles), Voltage (400-600, >600V), Vehicle Type (Truck, Bus, Passenger Car) and Region-Global Forecast to 2025


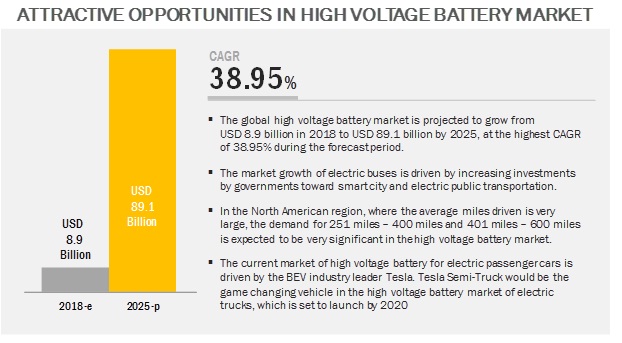
The global high voltage battery market size was valued at USD 8.9 billion in 2018 and is expected to reach USD 89.1 billion by 2025, at a CAGR of 38.95%, during the forecast period 2018-2025. The study involves 4 main activities to estimate the current size of the high voltage battery market. Exhaustive secondary research was done to collect information on the market, such as battery types, upcoming model launches, and upcoming battery chemistry. The next step was to validate these findings, assumptions, and market analysis with industry experts across value chains through primary research. A bottom-up approach was employed to estimate the complete market size for different segments considered under this study.
Secondary Research
The secondary sources referred for this research study include automotive industry organizations such as the Organisation Internationale des Constructeurs d'Automobiles (OICA), corporate filings (such as annual reports, investor presentations, and financial statements), Factiva, Crunchbase, Bloomberg and trade, business, and automotive associations. Secondary data has been collected and analyzed to arrive at the overall market size, which is further validated by multiple industry experts.
Primary Research
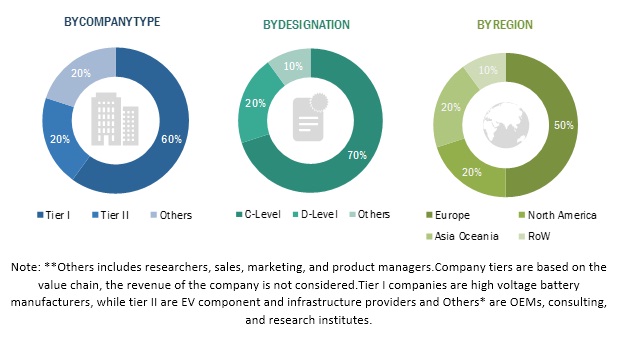
Extensive primary research has been conducted after acquiring an understanding of the high voltage battery market scenario through secondary research. Several primary interviews have been conducted with market experts from both the demand- (OEMs) and supply-side (battery manufacturers) across major regions, namely, North America, Europe, Asia Oceania, and the Rest of the World. Primary data has been collected through questionnaires, emails, and telephonic interviews. In the canvassing of primaries, we have strived to cover various departments within organizations, such as sales, operations, and administration, to provide a holistic viewpoint in our report.
After interacting with industry experts, we also conducted brief sessions with highly experienced independent consultants to reinforce the findings from our primaries. This, along with the in-house subject matter experts’ opinions, has led us to the findings as described in the remainder of this report.
To know about the assumptions considered for the study, download the pdf brochure
High Voltage Battery Market Size Estimation
Bottom-up approach
The country-level market size, by volume, of the high voltage battery market has been derived by multiplying the country-level penetration (obtained from country level extensive model mapping for each vehicle segment until 2018 which is further validated through multiple industry experts) of high voltage battery (>75 kWh battery capacity) in BEV sales data of electric passenger cars, electric trucks, and electric buses with sources such as country-wise automotive manufacturing associations, electric vehicle associations, and primary validations. The country-level model mapping also considered the penetration of different battery capacity (75-150 kWh, 151-225 kWh, 226-300 kWh, and >300 kWh), battery type (NMC, NCA, LFP, and Others), driving range (100-250 miles, 251-400 miles, 400-550 miles, and >500 miles) on BEV sales data until 2018. Forecast of the same is based on multiple factors such as historic trends (2015–2016), future model launches and their battery capacity, supply chain readiness, and government investments, upcoming battery chemistry, consumer acceptance, and averages miles driven. Additionally, to support the market forecast, the study also identifies futuristic electric truck models and their battery capacity specifications. The market size, by value, is derived by multiplying the per kWh cost of the battery (USD) with the market size at country-level. The market size, by value, of the market for different regions, is derived by adding the country-wise market of high voltage battery. The regional-level markets are summed up to derive the global market by battery capacity, battery type, driving range, vehicle type, and region.
Data Triangulation
All percentage shares, splits, and breakdowns have been determined using secondary sources and verified by primary sources. All parameters that are said to affect the markets covered in this research study have been accounted for, viewed in extensive detail, and analyzed to obtain the final quantitative and qualitative data. This data has been consolidated, enhanced with detailed inputs and analysis from MarketsandMarkets, and presented in the report. The data was triangulated by studying various factors and trends from both the demand and supply sides in the high voltage battery market.
High Voltage Battery Market Report Objectives
- To analyze and forecast the market, in terms of volume (’000 units) and value (USD million), from 2018 to 2025
- To define, describe, and forecast the market, by volume and value, based on vehicle type (Passenger Car, Bus, and Truck)
- To define, describe, and forecast the market, by volume and value, based on battery type (LFP, NCA. NMC, and Others)
- To define, describe, and forecast the market, by volume and value, based on by driving range (100–250 miles, 251–400 miles, 400–550 miles, and >500 miles)
- To define, describe, and forecast the market, by volume and value, based on battery capacity (75–150 kWh, 151–225 kWh, 225–300 kWh, and >300 kWh)
- To analyze and forecast the market across 4 key regions, namely, Asia Oceania, Europe, North America, and the Rest of World (RoW)
- To define, describe, and analyze the market, based on voltage (400–600 V and >600 V)
- To analyze the regional markets for growth trends, prospects, and their contribution to the total market
- To strategically profile key players in the market and comprehensively analyze their market share analysis and core competencies
- To track and analyze competitive developments such as joint ventures, mergers & acquisitions, new product launches, expansions, and other activities carried out by the key industry players
- To define and analyze the stakeholders in the market and provide a detailed competitive landscape
- To analyze the opportunities offered by various segments of the market to the stakeholders
Scope of the High Voltage Battery Market Report
|
Report Metric |
Details |
|
Market Size Available for Years |
2016–2025 |
|
Base Year Considered |
2017 |
|
Forecast Period |
2018–2025 |
|
Forecast Units |
Value (USD million/billion) and Volume (Units) |
|
Segments Covered |
Battery capacity, battery type, driving range, vehicle type, voltage, and region |
|
Geographies Covered |
Asia Oceania, Europe, North America, and the RoW |
|
Companies Covered |
The key players in the high voltage battery market are Tesla (US), BYD (China), Panasonic (Japan), LG Chem (South Korea), Samsung SDI (South Korea), and CATL (China). Additionally, the report covered 20 major players. |
This research report categorizes the high voltage battery market based on battery capacity, battery type, driving range, vehicle type, voltage, and region.
Market, By Battery Capacity
- 75 kWh–150 kWh
- 151 kWh–225 kWh
- 226 kWh–300 kWh
- >300 kWh
Market, By Voltage
- 400–600V
- >600V
Market, By Vehicle Type
- Bus
- Passenger Car
- Truck
Market, By Battery Type
- LFP
- NCA
- NMC
- Others
Market, By Driving Range
- 100–250 miles
- 251–400 miles
- 401–550 miles
- > 550 miles
Market, By Region
- Asia Oceania
- Europe
- North America
- RoW
Available Customizations of High Voltage Battery Market
With the given market data, MarketsandMarkets offers customizations in accordance with the company
High Voltage Battery Market, By Battery Type (At Country Level)
- NCA
- NMC
- LFP
- Others
Note: The countries would be covered: Asia Oceania (India, Japan, China, and South Korea,), Europe (Germany, UK, France, Norway, Sweden, The Netherlands, and the Rest of Europe), North America (US and Canada), and the Rest of World (Brazil and South Africa)
High Voltage Battery Market, By Driving Range (At Country Level)
- 100–250 miles
- 251–400 miles
- 401–550 miles
- > 550 Miles
Note: The countries would be covered: Asia Oceania (India, Japan, China, and South Korea,), Europe (Germany, UK, France, Norway, Sweden, The Netherlands, and the Rest of Europe), North America (US and Canada), and the Rest of World (Brazil and South Africa)
High Voltage Battery Truck Market (At Selected Country Level)
High Voltage Battery Bus Market (At Selected Country Level)
The high voltage battery market is projected to grow at a CAGR of 38.95% from 2018 to 2025, and the market size is projected to grow from USD 8.9 billion in 2018 to USD 89.1 billion by 2025. The increasing demand for higher driving range vehicles, significant focus toward smart transportation, and advancement toward battery chemistry are expected to play a significant role in the growth of the market.
The >300 kWh segment is expected to be the largest contributor in the high voltage battery market, by battery capacity, during the forecast period.
The growth of >300kWh batteries is mainly driven by the dominating electric bus industry in China. All the electric bus models of the market leader, BYD, fall under this category. Additionally, the electrification of public transportation would drive the demand for electric buses and trucks, which, in turn, would drive the high voltage battery market as electric buses and trucks are equipped with more than >300 kWh battery packs. For instance, Tesla Semi’s battery pack will have a capacity of 800–1,000 kWh. According to primary insights, Tesla Semi Truck would be a game changer in the electric truck industry, as a significant number of logistics and transport companies have pre-ordered Tesla Semi Truck.
The high voltage battery market for bus is estimated to be the largest market during the forecast period.
As the energy requirement of electric buses is very high, currently 90% of the electric buses fall under the high voltage category. According to primary insights, this number is expected to be 100% by 2025. With aggressive incentives and mandates from the Chinese government, the country has already proved themselves as a leader in clean technologies. The electric buses are expected to dominate the high voltage market, by vehicle type, due to the rising adoption of electric buses for public transportation in cities across the globe. Moreover, in the passenger car segment, the current high voltage battery market is driven by the BEV industry leader, Tesla.
In driving range, the >550 miles segment is projected to grow at fastest rate during forecast period.
Currently, majority of the electric buses and passenger cars fall under 251–400 miles and 401–550 miles drving range. However, with advacement in battery chemistry and growing fast charging network, elctric buses are expected to shift gradually toward >550 miles range. A similar trend is expected for electric trucks, as the market for electric trucks is under development phase. However, successful electric transportation also drives the demand for > 550 miles battery electric vehicles. For instance, in November 2017, Tesla unveiled a prototype of Semi-Truck, which will go for full-fledged production by 2019. The semi-trucks can travel approximately 600 miles of range.
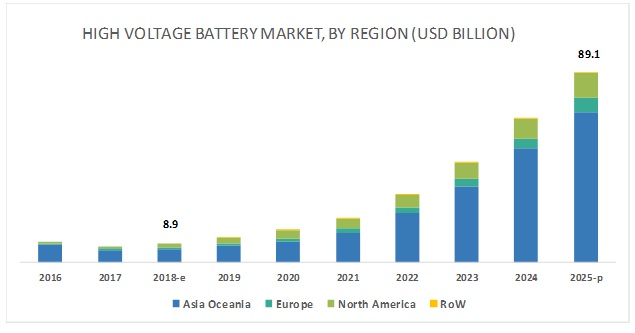
Asia Oceania is expected to account for the largest market size during the forecast period.
Asia Oceania is projected to hold the largest market share. Factors such as dominating Chinese EV industry, strong economic growth, increasing focus toward smart cities, development related to Gigafactory setup, and favorable government policies have triggered the demand for high voltage battery in the region. China accounts for the highest market share of 78.8% of the global high voltage battery market, which can be attributed to the ever-growing production of electric buses in the country. Additionally, China and South Korea, home for the largest battery manufacturers, play a key role in the high voltage battery supply chain industry in the Asia Oceania region. On the other hand, when compared to the European and North American region, people from the Asia Oceania region prefer economic electric cars with a driving range of >100 miles. This trend is expected to change with the entry of Tesla model 3 in the country. According to Tesla, the company is planning to produce 500,000 cars in China. Such developments are expected to help Asia Oceania dominate the market in the near future as well.
Some of the key players in the high voltage battery market are Panasonic (Japan), BYD (China), CATL (China), LG Chem (South Korea), and Tesla (US). Panasonic (Japan) is identified as the leading player in the market. The company is one of the established players and a globally renowned supplier of high voltage batteries to electric vehicles. The company follows the strategy of new product developments to gain a competitive edge in the market. In September 2018, Panasonic developed the technology to visualize the movement of the lithium-ions in the next-generation batteries during the charging and discharging processes. Additionally, Panasonic is working with Tesla for the manufacturing of Model 3 batteries.
Recent Developments
- In May 2018, Proterra introduced new high-power charging options to achieve 100% electric bus fleet. At the American Public Transportation Association’s (APTA) Bus & Paratransit Conference, Proterra introduced new systems for reliable, smarter charging that is flexible, scalable, and powerful.
- In November 2017, Tesla unveiled a prototype of Semi-Truck. The tractor can be linked up with any trailer, no brand-specific trailer is necessary. Semi-Truck can travel approximately 600 miles of range having a battery capacity of 800–1,000 kWh. The semi-trailer will go on full-fledged production by 2019.
- In July 2016, Tesla opened its Gigafactory in Nevada, US. It is one of the biggest battery manufacturing plants for EV batteries, in terms of capacity. Tesla built it keeping in mind the future demand for EVs.
- In October 2017, LG Chem, a leading manufacturer of advanced batteries based in Korea, announced the construction of an Electric Vehicle (EV) battery plant in Wroclaw, Poland. LG Chem will invest approximately USD 340 million in the plant by the end of 2018 to produce lithium-ion batteries. The company plans to produce 100,000 EV batteries in Poland annually.
Key Questions addressed by the report
- What would be the expected year of commercialization for the solid-state battery? What would trigger the influx of this new battery technology?
- What would be the expected year of commercialization for heavy duty electric trucks?
- What would be the trend of battery cost over the next 5 years?
- What would be the share of high voltage battery vehicles in the total BEV sales of each vehicle type?
- How is battery chemistry different as per different vehicle types? How is the trend going to change in the coming years?
To speak to our analyst for a discussion on the above findings, click Speak to Analyst
 Exclusive indicates content/data unique to MarketsandMarkets and not available with any competitors.
Table of Contents
1 Introduction (Page No. - 18)
1.1 Objectives
1.2 Product and Market Definition
1.3 High Voltage Battery Market Scope
1.3.1 Markets Covered
1.3.2 Years Considered in the Study
1.4 Currency
1.5 Package Size
1.6 Limitations
1.7 Stakeholders
2 Research Methodology (Page No. - 22)
2.1 Research Data
2.2 Secondary Data
2.2.1 Key Secondary Sources for Battery Electric Vehicle
2.2.2 Key Secondary Sources for High Voltage Battery
2.2.3 Key Data From Secondary Sources
2.3 Primary Data
2.3.1 Sampling Techniques & Data Collection Methods
2.3.2 Primary Participants
2.4 Market Size Estimation
2.4.1 Bottom-Up Approach
2.5 Market Breakdown and Data Triangulation
2.6 Assumptions
3 Executive Summary (Page No. - 31)
4 Premium Insights (Page No. - 34)
4.1 High Voltage Battery Market- Global Trends
4.2 Market, By Battery Type
4.3 Market, By Battery Capacity
4.4 Market, By Driving Range
4.5 Market, By Vehicle Type
4.6 Market, By Country
4.7 Market, By Region
5 High Voltage Battery Market Overview (Page No. - 39)
5.1 Introduction
5.2 Market Dynamics
5.2.1 Drivers
5.2.1.1 Increased Investment and Government Support Toward Electric Vehicles
5.2.1.2 Increased Demand for Higher Voltage Systems
5.2.1.3 Increase in Government Spending Toward Smart Cities
5.2.2 Restraint
5.2.2.1 High Development Cost
5.2.3 Opportunities
5.2.3.1 Fast Charging
5.2.3.2 Electrification of Trucks
5.2.4 Challenges
5.2.4.1 Battery Thermal Management
5.2.4.1.1 Developing Fail-Safe Electronic and Electrical Components
6 High Voltage Battery Market, By Voltage (Page No. - 52)
6.1 Introduction
6.2 400v–600v
6.3 >600v
7 High Voltage Battery Market, By Battery Type (Page No. - 56)
Note: the Chapter is Further Segmented By Region (Asia Oceania, Europe, North America, and RoW)
7.1 Introduction
7.1.1 Research Methodology
7.1.2 Assumptions
7.2 Lithium Nickel Cobalt Aluminum Oxide (NCA)
7.2.1 With the Presence of Industry Leader Tesla, North America Leads NCA Battery Market
7.3 Lithium Nickel Manganese Cobalt Oxide (NMC)
7.3.1 Companies Have Switched From NMC 111 to NMC 442, NMC 622, & Now to NMC 811
7.4 Lithium Iron Phosphate (LFP)
7.4.1 Emerging Market of LFP Battery is Largely Driven By the Rapid GRoWth in Electric Bus Sales
7.5 Other Battery Types
7.5.1 Solid-State Battery Type Can Be A Game Changing Technology in the Near Future
8 High Voltage Battery Market, By Battery Capacity (Page No. - 64)
Note: the Chapter is Further Segmented By Region (Asia Oceania, Europe, North America, and RoW)
8.1 Introduction
8.1.1 Research Methodology
8.1.2 Assumptions
8.2 75–150 kWh
8.2.1 85 kWh is the Most Demanded Battery Capacity in the High Voltage Battery Market
8.3 151–225 kWh
8.3.1 North America is Projected to Be the Leading Market for the 151–225 kWh Segment Due to the Proposed Public Electric Transportation in the Region69
8.4 226–300 kWh
8.4.1 Introduction of Medium Range Electric Buses in Europe and North America Region is Expected to Drive the Growth of the 226–300 kWh Segment
8.5 >300 kWh
8.5.1 Growth of Electric Bus and Truck Sales are Expected to Drive the >300 kWh Battery Market
9 High Voltage Battery Market, By Driving Range (Page No. - 72)
Note: the Chapter is Further Segmented By Region (Asia Oceania, Europe, North America, and Row)
9.1 Introduction
9.1.1 Research Methodology
9.1.2 Assumptions
9.2 100–250 Miles
9.2.1 Growing Demand for Intercity Electric Buses is Projected to Drive the Market for 100-250 Miles Segment
9.3 251–400 Miles
9.3.1 Introduction of Tesla 3 Long Range in North America Region is Expected to Accelerate the Market for 251- 400 Miles Segment
9.4 401–550 Miles
9.4.1 Growing Sales of Electric Bus is Projected to Accelerate the Demand for 401- 550 Miles Segment
9.5 >550 Miles
9.5.1 Increasing Electrification of Transportation is Projected to Drive the Growth of >550 Miles Segment
10 High Voltage Battery Market, By Vehicle Type (Page No. - 81)
Note: the Chapter is Further Segmented By Region (Asia Oceania, Europe, North America, and RoW)
10.1 Introduction
10.1.1 Research Methodology
10.1.2 Assumptions
10.2 Passenger Car
10.2.1 Tesla Sales, Especially Outside the US, to Have Major Influence on the High Voltage Battery Passenger Car Market
10.3 Bus
10.3.1 More Than 90% of the Electric Bus Market is Driven By China
10.4 Truck
10.4.1 Tesla Semi-Truck is Expected to Be the Game Changer in the Electric Truck Segment
11 High Voltage Battery Market, By Region (Page No. - 91)
Note: the Chapter is Further Segmented By Battery Capacity (75-150 kWh, 151-225 kWh, 226-300 kWh, and >300 kWh)
11.1 Introduction
11.1.1 Research Methodology
11.1.2 Assumptions
11.2 Asia Oceania
11.2.1 China
11.2.1.1 Dominated Electric Bus Industry in China is Expected to Drive the >300 kWh Market
11.2.2 India
11.2.2.1 Increasing Government Efforts Towards Public Transportation is Projected to Drive the High Voltage Battery Market for India
11.2.3 Japan
11.2.3.1 75-150 kWh is Expected to Be the Largest Segment
11.2.4 South Korea
11.2.4.1 >300 kWh is Projected to Be the Fastest Growing Segment
11.3 Europe
11.3.1 France
11.3.1.1 75-150 kWh is Projected to Be the Largest Segment
11.3.2 Germany
11.3.2.1 Entry of Tesla 3 in 2019 is Expected to Accelerate the Growth of 75-150 kWh Segment in Germany
11.3.3 Norway
11.3.3.1 Increasing Focus Towards Zero Emission is Expected to Drive the Growth of this Market in Norway
11.3.4 Sweden
11.3.4.1 Significant Investment Towards Smart Transportation is Expected to Drive the Growth of Market in Sweden
11.3.5 the Netherlands
11.3.5.1 Increasing Sales of Tesla in the Netherlands is Projected to Drive the Growth of this Market
11.3.6 UK
11.3.6.1 Electrification of Public Transportation is Projected to Accelerate the Growth of Market in the UK
11.3.7 Rest of Europe
11.3.7.1 Increasing Demand for Higher Driving Range Electric Cars is Projected to Drive the Growth of Market in Rest of Europe
11.4 North America
11.4.1 Canada
11.4.1.1 Introduction Electric Buses Through Public-Private Partnership (Ppp) Schemes is Expected to Drive the Demand of this Market in Canada
11.4.2 US
11.4.2.1 Higher Miles Driven in US Drives the Demand for 75-150 kWh Market
11.5 Row
11.5.1 Brazil
11.5.1.1 Market for >300 kWh Segment is Projected to Be the Largest By Value
11.5.2 South Africa
11.5.2.1 Tesla Entry in South Africa is Projected to Drive the Demand for 75-150 kWh Market
12 Competitive Landscape (Page No. - 122)
12.1 Introduction
12.2 High Voltage Battery: Market Share Analysis (2017)
12.3 Competitive Situation & Trends
12.3.1 Competitive Situation & Trends: New Product Developments Was the Most Widely Adopted Strategy
12.3.2 New Product Developments
12.3.3 Supply Contracts/Collaborations/Partnerships/ Joint Ventures
12.3.4 Expansions
12.3.5 Mergers & Acquisitions
13 Company Profiles (Page No. - 128)
(Business Overview, Products Offered, Recent Developments & SWOT Analysis)*
13.1 Tesla
13.2 BYD
13.3 Panasonic
13.4 LG Chem
13.5 Continental
13.6 Samsung SDI
13.7 CATL
13.8 XALT Energy
13.9 ABB
13.10 Siemens
13.11 Proterra
13.12 BOSCH
13.13 Other Players
13.13.1.1 Mitsubishi Electric
13.13.1.2 Nissan
13.13.2 Europe
13.13.2.1 Delphi
13.13.2.2 Johnson Controls
13.13.3 Americas
13.13.3.1 Chargepoint
13.13.3.2 Magna
13.13.4 RoW
13.13.4.1 EDP Brasil
*Details on Business Overview, Products Offered, Recent Developments & SWOT Analysis Might Not Be Captured in Case of Unlisted Companies.
14 Appendix (Page No. - 168)
14.1 Insights of Industry Experts
14.2 Discussion Guide
14.3 Knowledge Store: Marketsandmarkets’ Subscription Portal
14.4 Available Customizations
14.4.1 High Voltage Battery Market, By Battery Type (At Country Level)
Note: The Countries Would Be Covered: Asia Oceania (India, Japan, China, and South Korea), Europe (Germany, UK, France, Norway, Sweden, the Netherlands, and the Rest of Europe), North America (US and Canada), and the Rest of World (Brazil and South Africa)
14.4.1.1 NCA
14.4.1.2 NMC
14.4.1.3 LFP
14.4.1.4 Others
14.4.2 High Voltage Battery Market, By Driving Range (At Country Level)
Note: The Countries Would Be Covered: Asia Oceania (India, Japan, China, and South Korea), Europe (Germany, UK, France, Norway, Sweden, the Netherlands, and the Rest of Europe), North America (US and Canada), and the Rest of World (Brazil and South Africa)
14.4.2.1 100-250 Miles
14.4.2.2 251-400 Miles
14.4.2.3 401-550 Miles
14.4.2.4 > 550 Miles
14.4.3 High Voltage Battery Truck Market (At Selected Country Level)
14.5 Related Reports
14.6 Author Details
List of Tables (93 Tables)
Table 1 Currency Exchange Rates (Wrt USD)
Table 2 Global Tax Subsidies for Electric Vehicles
Table 3 Company-Wise Development Toward High Voltage Battery
Table 4 Battery Electric Passenger Car Driving Range, By Key Models & Region
Table 5 Upcoming BEV Models Installed With High Voltage Battery
Table 6 Voltage Levels Required to Power Various Systems in Passenger Cars
Table 7 Company-Wise Developments Toward Electric Trucks
Table 8 Ideal Temperature Range of Li-Ion Batteries
Table 9 BEV Models Installed With High Voltage Battery (400v–600v)
Table 10 BEV Models Installed With High Voltage Battery (>600v)
Table 11 Passenger Car: High Voltage Battery Market, By Voltage, 2019-2025 (Units)
Table 12 Passenger Car: Market for >600v, By Region, 2019-2025 (Units)
Table 13 Regional Development of Fast Charging Infrastructure
Table 14 Current Cathode Material Landscape
Table 15 Market, By Battery Type, 2016–2025 (Units)
Table 16 NCA: Market, By Region, 2016–2025 (Units)
Table 17 NMC: Market, By Region, 2016–2025 (Units)
Table 18 LFP: Market, By Region, 2016–2025 (Units)
Table 19 Other Battery Types: Market, By Region, 2016–2025 (Units)
Table 20 Market, By Battery Capacity, 2016–2025 (Units)
Table 21 Market, By Battery Capacity, 2016–2025 (USD Million)
Table 22 75–150 kWh: Market, By Region, 2016–2025 (Units)
Table 23 75–150 kWh: Market, By Region, 2016–2025 (USD Million)
Table 24 151–225 kWh: Market, By Region, 2016–2025 (Units)
Table 25 151–225 kWh: Market, By Region, 2016–2025 (USD Million)
Table 26 226–300 kWh: Market, By Region, 2016–2025 (Units)
Table 27 226–300 kWh: Market, By Region, 2016–2025 (USD Million)
Table 28 >300 kWh : Market, By Region, 2016–2025 (Units)
Table 29 >300 kWh: Market, By Region, 2016–2025 (USD Million)
Table 30 Market, By Driving Range, 2016–2025 (Units)
Table 31 Market, By Driving Range, 2016–2025 (USD Million)
Table 32 100–250 Miles: Market, By Region, 2016–2025 (Units)
Table 33 100–250 Miles: Market, By Region, 2016–2025 (USD Million)
Table 34 251–400 Miles: Market, By Region, 2016–2025 (Units)
Table 35 251–400 Miles: Market, By Region, 2016–2025 (USD Million)
Table 36 401–550 Miles: Market, By Region, 2016–2025 (Units)
Table 37 401–550 Miles: Market, By Region, 2016–2025 (USD Million)
Table 38 >550 Miles: Market, By Region, 2016–2025 (Units)
Table 39 > 550 Miles: Market, By Region, 2016–2025 (USD Million)
Table 40 Market, By Vehicle Type, 2016–2025 (Units)
Table 41 Market, By Vehicle Type, 2016–2025 (USD Million)
Table 42 Upcoming High Voltage Battery Electric Passenger Cars, 2019-2022
Table 43 Passenger Car: Market, By Region, 2016–2025 (Units)
Table 44 Passenger Car: Market, By Region, 2016–2025 (USD Million)
Table 45 Bus: Market, By Region, 2016–2025 (Units)
Table 46 Bus: Market, By Region, 2016–2025 (USD Million)
Table 47 Tesla Semi-Truck Pre -Orders, By Company
Table 48 Truck: Market, By Region, 2016–2025 (Units)
Table 49 Truck: Market, By Region, 2016–2025 (USD Million)
Table 50 Global Market, By Region, 2016–2025 (Units)
Table 51 Global Market, By Region, 2016–2025 (USD Million)
Table 52 Asia Oceania: Market, By Country, 2016–2025 (Units)
Table 53 Asia Oceania: Market, By Country, 2016–2025 (USD Million)
Table 54 China: Market, By Battery Capacity, 2016–2025 (Units)
Table 55 China: Market, By Battery Capacity, 2016–2025 (USD Million)
Table 56 India: Market, By Battery Capacity, 2016–2025 (Units)
Table 57 India: Market, By Battery Capacity, 2016–2025 (USD Million)
Table 58 Japan: Market, By Battery Capacity, 2016–2025 (Units)
Table 59 Japan: Market, By Battery Capacity, 2016–2025 (USD Million)
Table 60 South Korea: Market, By Battery Capacity, 2016–2025 (Units)
Table 61 South Korea: Market, By Battery Capacity, 2016–2025 (USD Million)
Table 62 Europe: Market, By Country, 2016–2025 (Units)
Table 63 Europe: Market, By Country, 2016–2025 (USD Million)
Table 64 France: Market, By Battery Capacity, 2016–2025 (Units)
Table 65 France: Market, By Battery Capacity, 2016–2025 (USD Million)
Table 66 Germany: Market, By Battery Capacity, 2016–2025 (Units)
Table 67 Germany: Market, By Battery Capacity, 2016–2025 (USD Million)
Table 68 Norway: Market, By Battery Capacity, 2016–2025 (Units)
Table 69 Norway: Market, By Battery Capacity, 2016–2025 (USD Million)
Table 70 Sweden: Market, By Battery Capacity, 2016–2025 (Units)
Table 71 Sweden: Market, By Battery Capacity, 2016–2025 (USD Million)
Table 72 The Netherlands: Market, By Battery Capacity, 2016–2025 (Units)
Table 73 The Netherlands: Market, By Battery Capacity, 2016–2025 (USD Million)
Table 74 UK: Market, By Battery Capacity, 2016–2025 (Units)
Table 75 UK: Market, By Battery Capacity, 2016–2025 (USD Million)
Table 76 Rest of Europe: Market, By Battery Capacity, 2016–2025 (Units)
Table 77 Rest of Europe: Market, By Battery Capacity, 2016–2025 (USD Million)
Table 78 North America: Market, By Country, 2016–2025 (Units)
Table 79 North America: Market, By Country, 2016–2025 (USD Million)
Table 80 Canada: Market, By Battery Capacity, 2016–2025 (Units)
Table 81 Canada: Market, By Battery Capacity, 2016–2025 (USD Million)
Table 82 US: Market, By Battery Capacity, 2016–2025 (Units)
Table 83 US: Market, By Battery Capacity, 2016–2025 (USD Million)
Table 84 RoW: Market, By Country, 2016–2025 (Units)
Table 85 RoW:Market, By Country, 2016–2025 (USD Million)
Table 86 Brazil: Market, By Battery Capacity, 2016–2025 (Units)
Table 87 Brazil: Market, By Battery Capacity, 2016–2025 (USD Million)
Table 88 South Africa: Market, By Battery Capacity, 2016–2025 (Units)
Table 89 South Africa: Market, By Battery Capacity, 2016–2025 (USD Million)
Table 90 New Product Developments, 2017–2018
Table 91 Supply Contracts/Collaboration//Partnerships/Joint Ventures, 2017–2018
Table 92 Expansions, 2017–2018
Table 93 Mergers & Acquisitions, 2015–2018
List of Figures (50 Figures)
Figure 1 Market Segments of High Voltage Battery
Figure 2 High Voltage Battery: Research Design
Figure 3 Research Design Model
Figure 4 Breakdown of Primary Interviews
Figure 5 High Voltage Battery: Bottom-Up Approach
Figure 6 Data Triangulation
Figure 7 High Voltage Battery : Market Outlook
Figure 8 High Voltage Battery Market, By Region, 2018 vs. 2020 vs. 2025 (USD Million)
Figure 9 Increasing Focus on Development of Smart City and Growing Demand for Higher Acceleration to Drive the Market During Forecast Period
Figure 10 Increasing Focus on Reducing Cobalt Content in Battery Chemistry is Driving the Demand for NMC Batteries During the Forecast Period 202535
Figure 11 Increasing Sales of Electric Buses Will Attribute to the Largest Market Share of the >300 kWh Battery Segment in 2025 (USD Million)
Figure 12 Higher Miles Driven in North America Will Attribute to the Largest Market Share of the 250-400 Miles Segment in 2025 (USD Million)
Figure 13 Bus Segment is Projected to Dominate the Market, 2020 vs 2025 (USD Million)
Figure 14 Single Dominating Electric Bus Industry in China is Projected to Lead the Market in 2025 (USD Million)
Figure 15 Asia Oceania is Projected to Be the Largest Market, 2020 vs. 2025 (USD Million)
Figure 16 High Voltage Battery : Market Dynamics
Figure 17 Projected Cost of Li-Ion Batteries, 2015–2030 (USD Per kWh)
Figure 18 Average Cost of Diesel Bus vs Electric Bus
Figure 19 Existing Charging Infrastructure
Figure 20 Regional Development of Fast Charging Infrastructure
Figure 21 Evolution of High Voltage Battery for Battery Electric Cars
Figure 22 By Voltage: Industry Insights
Figure 23 By Battery Type: Industry Insights
Figure 24 Market, By Battery Type, 2018 vs. 2025 (’000 Units)
Figure 25 By Battery Capacity: Industry Insights
Figure 26 Market, By Battery Capacity, (USD Million)
Figure 27 By Driving Range: Industry Insights
Figure 28 Global Market, By Driving Range, \2018–2025 (USD Million)
Figure 29 By Vehicle Type: Industry Insights
Figure 30 Market, By Vehicle Type, 2020 vs 2025 (USD Million)
Figure 31 Global Market, By Region: Asia Oceania Accounts for the Largest Market Share, By Value, 2018 vs. 2020 vs. 2025 Million94
Figure 32 Asia Oceania: Industry Insights
Figure 33 Asia Oceania: Market Snapshot
Figure 34 Europe: Industry Insights
Figure 35 Europe: Market Snapshot
Figure 36 North America: Industry Insights
Figure 37 North America: US is Projected to Be the Largest Market, 2018 vs. 2025 (USD Million)
Figure 38 RoW: Industry Insights
Figure 39 RoW: Brazil is Projected to Be the Largest Market, 2018 vs. 2025 (USD Million)
Figure 40 Key Development By Leading Players in the High Voltage Battery Market
Figure 41 High Voltage Battery Market Share Analysis in 2017
Figure 42 Tesla: Company Snapshot
Figure 43 BYD: Company Snapshot
Figure 44 Panasonic: Company Snapshot
Figure 45 LG Chem: Company Snapshot
Figure 46 Continental: Company Snapshot
Figure 47 Samsung SDI: Company Snapshot
Figure 48 ABB: Company Snapshot
Figure 49 Siemens: Company Snapshot
Figure 50 BOSCH: Company Snapshot


Growth opportunities and latent adjacency in High Voltage Battery Market