
Manufacturing Execution System Market Size 2030

Manufacturing Execution System Market Size, Share, Growth & Trends by Deployment Mode (On-premises, Cloud, Hybrid), Application (Production Management, Quality Management, Material and Inventory Management, Maintenance Management, Performance Analysis) - Global Forecast to 2030


MANUFACTURING EXECUTION SYSTEM MARKET SIZE, SHARE & TRENDS
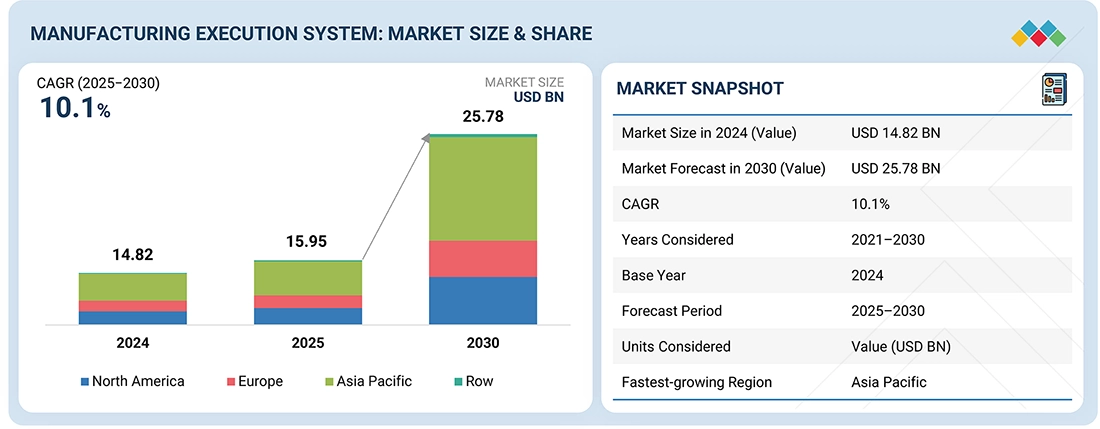
According to Marketsandmarkets, the global global manufacturing execution systems market size was valued at USD 15.95 billion in 2025 and is projected to reach USD 25.78 billion by 2030, growing at a CAGR of 10.1% from 2025 to 2030. The market is expected to expand significantly, driven by the increasing demand for real-time production monitoring and process optimization, along with the adoption of Industry 4.0 technologies. Manufacturing execution systems (MES) solutions, which include software and systems, facilitate connections between production planning systems and shop floor activities to enable data sharing and enhance production visibility.
MARKET SNAPSHOT TABLE
| REPORT METRIC | DETAILS |
|---|---|
| Market Size in 2025 (Value) | USD 15.95 billion |
| Market Forecast in 2030 (Value) | USD 25.78 Billion |
| Growth Rate | CAGR of 10.1% from 2025-2030 |
| Years Considered | 2021-2030 |
| Base Year | 2024 |
| Forecast Period | 2025-2030 |
| Units Considered | Value (USD Million/Billion) |
| Report Coverage | Revenue forecast, company ranking, competitive landscape, growth factors, and trends |
| Segments Covered |
|
| Regional Scope | North America, Europe, Asia Pacific, Middle East, RoW |
| Top Companies |
|
| Growth Drivers |
|
Market Size & Forecast
MANUFACTURING EXECUTION SYSTEM MARKET KEY TAKEAWAYS
-
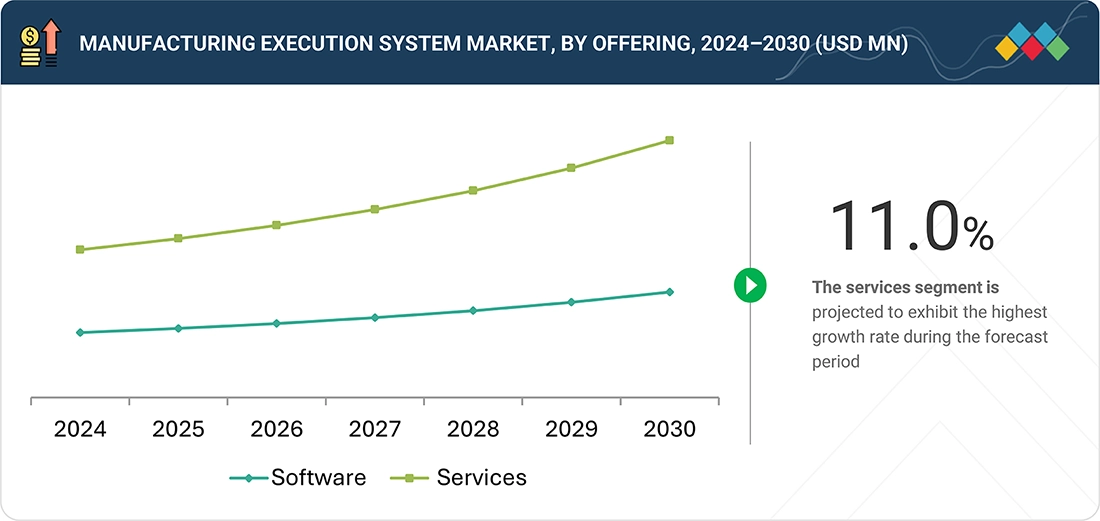
BY OFFERINGThe manufacturing execution system market size is divided into software and services. The services segment is expanding the fastest because MES solutions need extensive, custom implementation and integration with factory-specific IT/OT systems. This is further driven by the high demand for ongoing maintenance, support, and specialized consulting for digital transformation efforts. Ultimately, successful MES adoption depends heavily on expert services for configuration and validation.
-
BY DEPLOYMENTThe market is divided into on-premises, cloud, and hybrid solutions. The hybrid deployment model is rapidly expanding in the MES market because it provides the optimal balance between the main benefits of both cloud and on-premises systems. Manufacturers can keep low-latency, mission-critical operations on-site, ensuring data control and compliance. At the same time, they utilize the cloud for scalable, enterprise-wide analytics, remote access, and reduced maintenance costs, offering a flexible approach to digital transformation.
-
BY INDUSTRYThe market serves a wide range of industries, including food & beverages, oil & gas, chemicals, pharmaceuticals & life sciences, automotive, aerospace, medical devices, electronics & semiconductors, metals & mining, and others. The automotive industry holds the largest market share due to the highly complex and large-scale assembly processes involved in vehicle manufacturing. MES is critical for ensuring complete traceability of thousands of components, enforcing strict quality control, and maximizing efficiency in line with lean manufacturing principles.
-
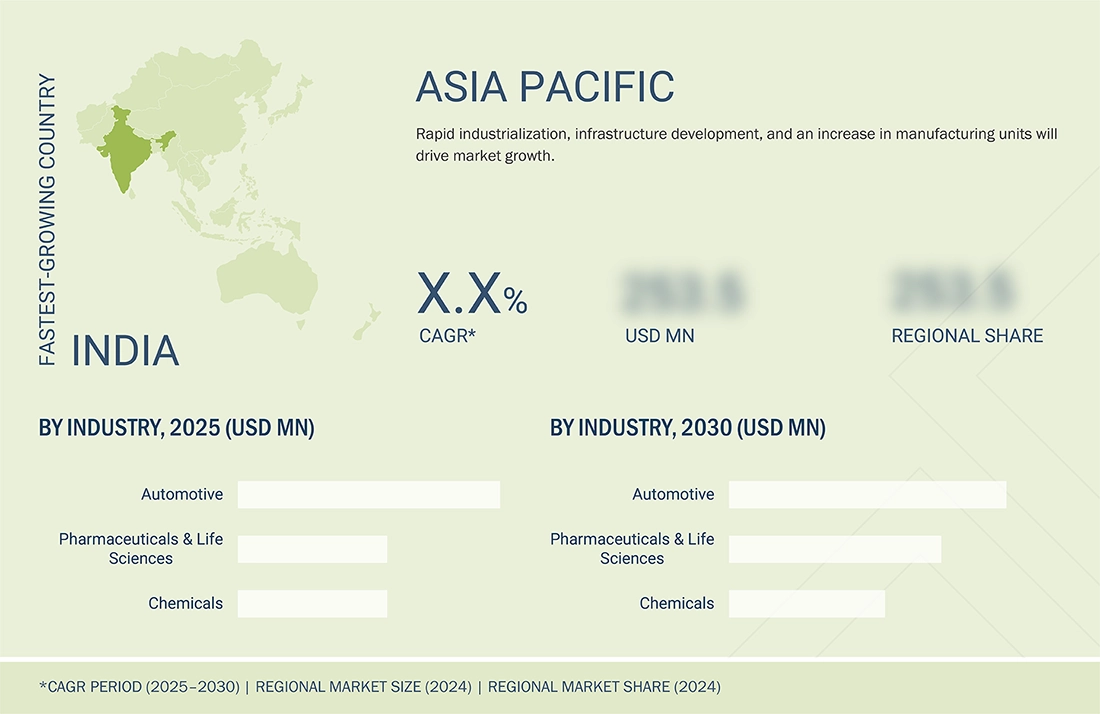
BY REGIONAsia Pacific is expected to experience the fastest growth with a CAGR of 11.2%, driven by increasing industrialization and major government-supported smart manufacturing policies. This trend is reinforced by rising demand for operational efficiency and quality control across a large manufacturing sector, especially in economies like China and India.
-
COMPETITIVE LANDSCAPEThe top players in the MES companies are Siemens, Dassault Systèmes, SAP SE, Rockwell Automation, and Honeywell International. Competition is driven by innovation in cloud computing and AI. Companies are making strategic acquisitions and forming partnerships to expand their product offerings and deliver manufacturing solutions, thus strengthening their market position.
The manufacturing execution system (MES) market growth is expected to grow significantly over the next decade, driven by increasing demand for industrial automation across various industries. MES can perform multiple tasks and improve efficiency by checking product quality as well as optimizing production. They can monitor processes that are automated through industrial automation. This helps users keep track of the entire supply chain, from the initial phase of raw materials to the final distribution of products to end users.
Source: Secondary Research, Interviews with Experts, MarketsandMarkets Analysis
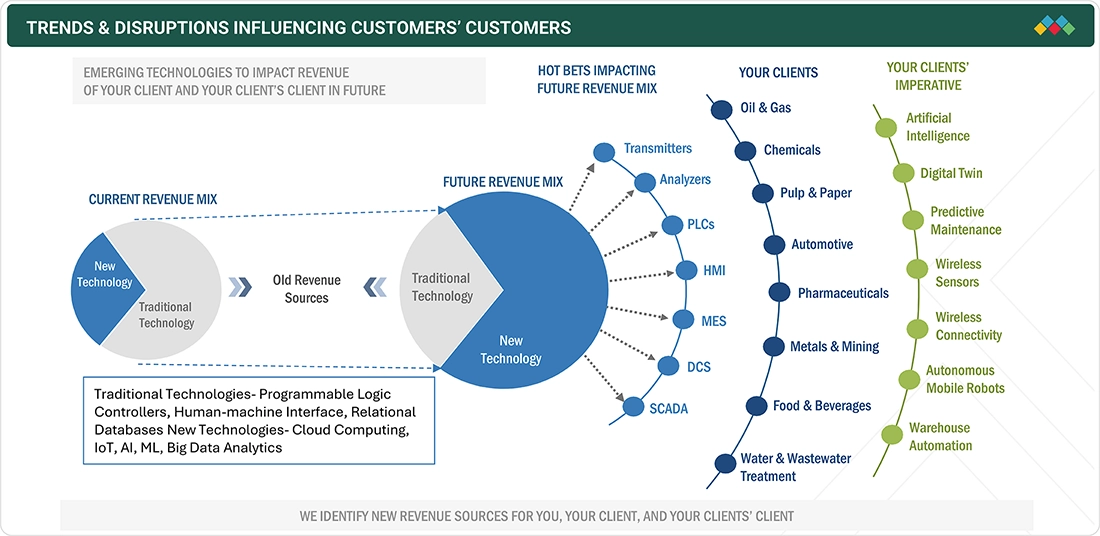
TRENDS & DISRUPTIONS IMPACTING CUSTOMERS' CUSTOMERS
The manufacturing execution systems (MES) market share is quickly changing with increased digitalization and the adoption of advanced technologies like AI, digital twins, predictive maintenance, and IoT. The revenue is shifting toward next-generation, tech-focused solutions as industries seek smarter, connected operations. This trend is pushing MES providers to integrate these technologies smoothly while offering sector-specific solutions tailored to industries such as automotive and pharmaceuticals, gradually replacing traditional, generic systems.
Source: Secondary Research, Interviews with Experts, MarketsandMarkets Analysis
MANUFACTURING EXECUTION SYSTEM MARKET DYNAMICS
Level
-
Rising demand for industrial automation across industries

-
Rising integration of information technology (IT) with operational

Level
-
High costs associated with MES upgrades and maintenance

-
Customization and integration issues

Level
-
MES integration with ERP and PLM solutions

-
Increasing need for regulatory compliance in pharmaceuticals & life sciences industry

Level
-
Complexities associated with deployment of MES in various industries

-
Data security concerns

Source: Secondary Research, Interviews with Experts, MarketsandMarkets Analysis
Driver: Rising demand for industrial automation across industries
Industrial automation, using control systems like computers and robots, is increasingly vital for achieving high productivity and enhanced product quality. Manufacturing Execution Systems (MES) integrate these automated processes with other solutions (ERP, SCADA) for real-time tracking across the entire supply chain. This integrated approach ensures efficient data accuracy and helps optimize production, overcoming the high-error risk associated with manual data entry
Restraint: Issues related to customization and integration
Integrating an MES with existing organizational systems, like ERP and legacy platforms, presents significant challenges due to data format and communication protocol inconsistencies. Successful deployment requires extensive customization, specialized expertise, detailed testing, and consistent employee training, all of which drive up costs and integration time. Furthermore, continuous system monitoring and optimization are mandatory to prevent performance degradation, maintain real-time data accuracy, and adapt to evolving production needs.
Opportunity: MES integration with ERP and PLM solutions
Manufacturing execution systems connect with ERP, SCM, WMS, DSS, and PLM to ensure smooth operations, real-time visibility, and efficient decision-making. This connection improves planning, productivity, and compliance by enhancing data accuracy and traceability. By linking across enterprise systems, MES supports automated workflows, fewer errors, and better resource use. Additionally, integration with digital twin technology boosts predictive maintenance and process improvement, further increasing operational efficiency.
Challenge: Complexities associated with MES deployment in industries
Implementing a manufacturing execution system is a complex, multi-year process that often takes about four years because of the need for extensive industry-specific customization. The process is lengthy, starting with adapting business processes, then investing in supporting solutions like ERP and PLM, and ending with moving to electronic records and final system integration. This long and detailed implementation, along with the challenge of adjusting the system to fit complex existing shop-floor hardware, presents a major challenge for market players.
Manufacturing Execution System Market Trends: COMMERCIAL USE CASES ACROSS INDUSTRIES
| COMPANY | USE CASE DESCRIPTION | BENEFITS |
|---|---|---|
 |
Real-time shopfloor MES for integrated production monitoring, digital workflows, and resource management | Complete production control, streamlined compliance, improved operational agility, and lower downtime |
 |
DELMIA MES for live quality control, batch traceability, and plant-wide process optimization | Enhanced plant productivity, cost savings, reduced scrap, and improved regulatory compliance |
 |
SAP MES integration with ERP; digitized work instructions, equipment monitoring, and full product traceability | Improved product quality, higher equipment uptime, reduced inventory costs, and real-time process visibility |
 |
FactoryTalk MES: Real-time production management, workflow tracking, and operation intelligence | Boosted supply chain efficiency, regulatory compliance, greater traceability, reduced waste, and fast scale-up |
 |
MES for process industries with deep DCS integration, modular batch digitization, and automated decision support | Real-time production insights, accelerated innovation, easier compliance/traceability, and scalable deployment |
Logos and trademarks shown above are the property of their respective owners. Their use here is for informational and illustrative purposes only.
MANUFACTURING EXECUTION SYSTEM MARKET GROWTH ECOSYSTEM
The manufacturing execution system ecosystem includes established software and service providers such as Siemens (Germany), Dassault Systèmes (France), SAP SE (Germany), Rockwell Automation (US), and Honeywell International Inc. (US). These companies supply advanced manufacturing execution systems. The ecosystem also includes system integrators and service providers.
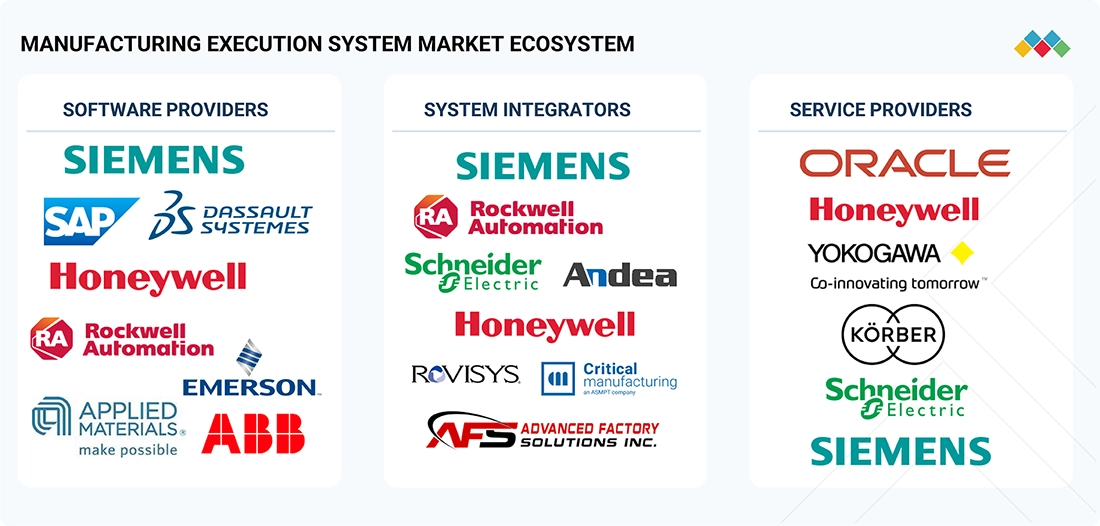
Logos and trademarks shown above are the property of their respective owners. Their use here is for informational and illustrative purposes only.
MANUFACTURING EXECUTION SYSTEM MARKET SIZE SEGMENTS
Source: Secondary Research, Interviews with Experts, MarketsandMarkets Analysis
Manufacturing Execution System Market, By Offering
The services segment held the largest market share in 2024, mainly because successful MES deployment needs extensive, specialized professional support beyond just the software. This support includes complex and time-consuming tasks like seamless integration with legacy systems (ERP, SCADA), custom configuration tailored to specific industrial processes, and thorough system validation.
Manufacturing Execution System Market, By Deployment
The on-premises segment held a significant share in 2024 because it provides essential benefits for highly regulated and data-sensitive industries such as aerospace, automotive, and pharmaceuticals. On-site deployments ensure superior data security, allow full control over critical manufacturing data, and maintain strict regulatory compliance.
Manufacturing Execution System Market, By Industry
The pharmaceuticals and life sciences sector is expected to see the fastest growth because of the critical requirement for strict regulatory standards like FDA's Good Manufacturing Practices (GMP). MES solutions are vital because they automate electronic batch records (EBRs), provide real-time quality checks, and standardize procedures to reduce human error. This trend is also propelled by the industry's move toward Industry 4.0 technologies, which enhance resource use and boost overall manufacturing efficiency.
MANUFACTURING EXECUTION SYSTEM MARKET REGION
Asia Pacific expected to register highest CAGR in global manufacturing execution system market during forecast period
Asia Pacific is expected to be the fastest-growing market for manufacturing execution systems, driven by rapid industrialization and comprehensive government initiatives such as China's "Made in China 2025," Japan's Manufacturing DX Support, and India's "Make in India" programs. These initiatives actively promote the adoption of MES software to increase production intelligence and improve operational efficiency across key industries like automotive, semiconductors, and electronics. As a result, the substantial manufacturing expansion, led by China, creates ongoing demand for MES, positioning the region as a global market leader.
The North America manufacturing execution system market is projected to reach USD 7.89 billion by 2030 from USD 4.90 billion in 2025, at a CAGR of 10.0% from 2025 to 2030. The market in North America is driven by the rapid digital transformation and Industry 4.0 adoption. The adoption of MES is aimed at improving shop-floor visibility, asset performance, and real-time decision-making. Additionally, strong regulatory compliance needs in sectors such as pharmaceuticals, food, aerospace, and automotive push manufacturers to deploy MES for traceability, quality assurance, and paperless operations.
Manufacturing Execution System Market: COMPANY EVALUATION MATRIX
In the manufacturing execution system market matrix, Siemens (Star) and Applied Materials (Emerging Leader) maintain strong positions as a Star player and Emerging Leader through their extensive product portfolios, global reach, and solid financial strength. Their ongoing innovation and brand reputation allow them to lead the widespread adoption of MES solutions globally.

Source: Secondary Research, Interviews with Experts, MarketsandMarkets Analysis
MANUFACTURING EXECUTION SYSTEM MARKET KEY PLAYERS
WHAT IS IN IT FOR YOU: Manufacturing Execution System Market REPORT CONTENT GUIDE
DELIVERED CUSTOMIZATIONS
We have successfully delivered the following deep-dive customizations:
| CLIENT REQUEST | CUSTOMIZATION DELIVERED | VALUE ADDS |
|---|---|---|
| Global Automotive Manufacturer |
|
|
| Pharmaceutical MES Provider |
|
|
| Electronics & Semiconductor Manufacturer |
|
|
| Food & Beverage Producer |
|
|
RECENT DEVELOPMENTS
- October 2024 : Yokogawa Electric Corporation announced the launch of OpreX Batch MES, a product in the OpreX Asset Operations and Optimization family. This MES software package is designed for batch plants manufacturing specialty and fine chemicals.
- April 2024 : Emerson Electric Co. introduced DeltaV Workflow Management, a next-generation MES software designed for early-stage development in the life sciences industry. This new MES will help enhance the DeltaV automation platform, offering more scalable options for innovators in the field.
- February 2024 : Dassault Systèmes announced a partnership with Groupe Clarins, the family-owned global cosmetics company. The group has chosen Dassault Systèmes’ 3DEXPERIENCE platform, utilizing DELMIA Apriso to optimize manufacturing processes and boost production capacity.
Table of Contents
 Exclusive indicates content/data unique to MarketsandMarkets and not available with any competitors.
Methodology
The study involved four major activities in estimating the current size of the manufacturing execution systems market. Exhaustive secondary research has been done to collect information on the market, peer market, and parent market. To validate these findings, assumptions, and sizing with industry experts across the value chain through primary research has been the next step. Both top-down and bottom-up approaches have been employed to estimate the complete market size. After that, market breakdown and data triangulation methods have been used to estimate the market size of segments and subsegments. Two sources of information—secondary and primary—have been used to identify and collect information for an extensive technical and commercial study of the manufacturing execution systems market.
Secondary Research
Various secondary sources have been referred to in the secondary research process to identify and collect information important for this study. The secondary sources include annual reports, press releases, and investor presentations of companies; white papers; journals and certified publications; and articles from recognized authors, websites, directories, and databases. Secondary research has been conducted to obtain key information about the industry’s supply chain, the market’s value chain, the total pool of key players, market segmentation according to the industry trends (to the bottom-most level), regional markets, and key developments from market- and technology-oriented perspectives. The secondary data has been collected and analyzed to determine the overall market size, further validated by primary research.
Primary Research
Extensive primary research was conducted after gaining knowledge about the current scenario of the manufacturing execution systems market through secondary research. Several primary interviews were conducted with experts from the demand and supply sides across four major regions—North America, Europe, Asia Pacific and RoW. This primary data was collected through questionnaires, emails, and telephonic interviews.

Note: RoW mainly comprises the Middle East, Africa, and South America.
Other designations include product managers, sales managers, and marketing managers.
Three tiers of companies have been defined based on their total revenue as of 2024; tier 3: revenue lesser than USD 500 million; tier 2: revenue between USD 500 million and 1 billion; and tier 1: revenue more than USD 1 billion.
To know about the assumptions considered for the study, download the pdf brochure
Market Size Estimation
Both top-down and bottom-up approaches have been used to estimate and validate the total size of the manufacturing execution systems market. These methods have also been used extensively to estimate the size of various subsegments in the market. The following research methodology has been used to estimate the market size:
- Major players in the industry and markets have been identified through extensive secondary research.
- The industry’s value chain and market size (in terms of value) have been determined through primary and secondary research processes.
- All percentage shares, splits, and breakdowns have been determined using secondary sources and verified through primary sources.
Manufacturing Execution System Market : Top-Down and Bottom-Up Approach

Data Triangulation
After arriving at the overall size of the manufacturing execution systems market from the market size estimation process explained above, the total market has been split into several segments and subsegments. Data triangulation and market breakdown procedures have been employed, wherever applicable, to complete the overall market engineering process and arrive at the exact statistics for all segments and subsegments of the market. The data has been triangulated by studying various factors and trends from both the demand and supply sides. Along with this, the market size has been validated using both top-down and bottom-up approaches..
Market Definition
The Manufacturing Execution Systems (MES) market refers to software designed to maximize real-time factory production management by integrating operational technology (OT) with information technology (IT). Unlike enterprise resource planning (ERP) systems, MES offers granular visibility, control, and coordination of the manufacturing process at the shop floor level. These systems maximize production efficiency through optimized monitoring, quality assurance, workflow automation, and compliance with regulatory requirements.
Propelled by Industry 4.0, smart manufacturing, and real-time analytics needs, MES solutions assist manufacturers in minimizing downtime, enhancing agility, and maximizing the use of resources. Industries such as automotive, electronics, pharmaceuticals, aerospace, and food & beverage depends on MES for smooth production, supply chain synchronization, and improved decision-making.
Key Stakeholders
- Associations and regulatory authorities (especially responsible for developing standards related to plant maintenance)
- Government bodies, venture capitalists, and private equity firms
- Automation consultants
- Automation system integrators
- ERP developers
- MES distributors and providers
- Process and discrete industries
- Research organizations and consulting companies
- Technology providers
- Technology investors, standards organizations, forums, alliances, and associations
Report Objectives
- To describe, segment, and forecast the overall manufacturing execution systems market, by deployment mode, offering, application, and industry, in terms of value.
- To describe and forecast the market for four key regions: North America, Europe, Asia Pacific, and Rest of the World (RoW), along with their respective countries, in terms of value.
- To describe the applications and leveraging entities of manufacturing execution systems and software.
- To provide an overview of the recent trends in the market.
- To provide detailed information regarding the drivers, restraints, opportunities, and challenges influencing the growth of the market.
- To analyze the supply chain, trends/disruptions impacting customers’ business, market/ecosystem map, pricing analysis, and regulatory landscape pertaining to manufacturing execution systems market.
- To strategically analyze micromarkets with respect to individual growth trends, prospects, and contributions to the overall market size.
- To analyze opportunities in the market for stakeholders and provide a competitive landscape of the market.
- To strategically profile the key players and comprehensively analyze their market positions in terms of their ranking and core competencies, along with detailing the competitive landscape for market leaders,
- To analyze competitive developments, such as product launches, acquisitions, collaborations, agreements, and partnerships, in the manufacturing execution systems market.
- To provide ecosystem analysis, case study analysis, patent analysis, technology analysis, value chain analysis, trends/disruptions impacting customer business, the impact of AI/Gen AI, key conferences and events, pricing analysis, Porter’s five forces analysis, and regulations pertaining to the market under study.
- To provide a macroeconomic outlook based on all the regions in the region chapter.
Available Customizations
With the given market data, MarketsandMarkets offers customizations according to the company’s specific needs. The following customization options are available for the report:
Company Information:
- Detailed analysis and profiling of additional market players (up to 5)
Key Questions Addressed by the Report
What is the current size of the Manufacturing Execution Systems (MES) market?
The global MES market is valued at approximately USD 15.95 billion in 2025 and is projected to reach USD 25.78 billion by 2030.
What is the expected growth rate of the MES market?
The MES market is expected to grow at a CAGR of 10.1% during the forecast period from 2025 to 2030.
What are the major growth drivers for the MES market?
Key growth drivers include increasing adoption of Industry 4.0, demand for real-time production monitoring, connected supply chains, IT-OT integration, industrial automation, and operational efficiency improvements.
Which industry holds the largest share in the MES market?
The automotive industry holds the largest market share due to complex manufacturing processes, quality control requirements, and the need for complete component traceability.
What are the latest trends shaping the MES market?
Key trends include cloud and hybrid MES deployment, AI-enabled manufacturing, predictive analytics, smart factories, Industrial IoT (IIoT) integration, and digital transformation initiatives.
Which deployment model is witnessing the fastest growth?
The hybrid deployment model is growing the fastest because it combines the security and control of on-premises systems with the scalability and analytics capabilities of cloud platforms.
Who are the leading companies operating in the MES market?
Major MES vendors include Siemens, Dassault Systèmes, SAP SE, Rockwell Automation, and Honeywell International.
Which region is expected to grow the fastest in the MES market?
The Asia Pacific region is projected to register the highest growth, with a CAGR of approximately 11.2%, driven by industrialization, smart manufacturing investments, and government initiatives in countries such as China and India.
What challenges could affect MES market growth?
Major challenges include high implementation and maintenance costs, customization complexities, integration issues with legacy systems, and cybersecurity concerns related to manufacturing data.
What strategic insights does the MES market report provide?
The report provides market sizing, forecasts, competitive landscape analysis, industry segmentation, regional opportunities, value chain analysis, pricing trends, investment outlook, and emerging technology trends influencing MES adoption.
Need a Tailored Report?
Customize this report to your needs
Get 10% FREE Customization
Customize This ReportPersonalize This Research
- Triangulate with your Own Data
- Get Data as per your Format and Definition
- Gain a Deeper Dive on a Specific Application, Geography, Customer or Competitor
- Any level of Personalization
Let Us Help You
- What are the Known and Unknown Adjacencies Impacting the Manufacturing Execution System Market
- What will your New Revenue Sources be?
- Who will be your Top Customer; what will make them switch?
- Defend your Market Share or Win Competitors
- Get a Scorecard for Target Partners

Custom Market Research Services
We Will Customise The Research For You, In Case The Report Listed Above Does Not Meet With Your Requirements
Get 10% Free CustomisationTESTIMONIALS

Tetsuya Ohhira
Business Development Manager-Technology Business
Nikon Corporation,
Leading Japanese MNC specializing in optics and imaging productswww.nikon.com
MarketsandMarkets™ response
is quick. Their attitude is flexible and positive. Analyst Insights are globally considered and
significant. Client Services quickly respond to our inquiry and demand. Their wide range of global
surveys help us make our strategic plan.
We hope Knowledge Store will be easier to search
for a report.
VP - Marketing & Business Development
Leading Provider of Process Control Solutions
We engaged with MarketsandMarkets on a study to perform an analysis and recommend a Go-To-Market strategy for metrology and process control in the semiconductor market. The study was tailored to our targets and needs with well-defined milestones. Our overall experience with the MarketsandMarkets team was very good throughout the project in all aspects including the analysis methodologies used, the quality and depth of primary and secondary data sets, the professionalism and flexibility of the team and the ability to meet the target schedule and milestones. We want to thank MarketsandMarkets team for a job well done.
- North America Manufacturing Execution System Market
- Europe Manufacturing Execution System Market
- Asia Pacific Manufacturing Execution System Market
- Rest of World Manufacturing Execution System Market
- Middle East Manufacturing Execution System Market
- South America Manufacturing Execution System Market
- US Manufacturing Execution System Market
- Canada Manufacturing Execution System Market
- Mexico Manufacturing Execution System Market
- UK Manufacturing Execution System Market
- Germany Manufacturing Execution System Market
- France Manufacturing Execution System Market
- Italy Manufacturing Execution System Market
- Spain Manufacturing Execution System Market
- Netherlands Manufacturing Execution System Market
- Switzerland Manufacturing Execution System Market
- China Manufacturing Execution System Market
- Japan Manufacturing Execution System Market
- India Manufacturing Execution System Market
- South Korea Manufacturing Execution System Market
- Singapore Manufacturing Execution System Market
- Malaysia Manufacturing Execution System Market
- Indonesia Manufacturing Execution System Market
- Nordics Manufacturing Execution System Market
- Rest Of Europe Manufacturing Execution System Market
- Rest Of Asia Pacific Manufacturing Execution System Market
- Bahrain Manufacturing Execution System Market
- Kuwait Manufacturing Execution System Market
- Oman Manufacturing Execution System Market
- Qatar Manufacturing Execution System Market
- Rest Of Middle East Manufacturing Execution System Market
- Saudi Arabia Manufacturing Execution System Market
- UAE Manufacturing Execution System Market
- Argentina Manufacturing Execution System Market
Growth opportunities and latent adjacency in Manufacturing Execution System Market


Christopher
Apr, 2022
Looking for market reports that include, quantify, and segment Redzone Business Systems. .
Donald
Apr, 2026
Why does the automotive industry dominate MES adoption compared to other sectors?.
Dennis
Apr, 2026
How important is MES in enabling Industry 4.0 and smart factory initiatives?.
Asmaa
Dec, 2025
Looking for market prospects by region?.