Image Intensifier Market by Diameter, (<18 mm, 18 mm, 25 mm, 6 inch, 9 inch, 12 inch, 16 inch), Application (cameras, scopes, googles, x-ray detectors), Vertical (Defense and Surveillance, Medical, Industrial), Geography - Global Forecast to 2025-2034


The global image intensifier market was valued at USD 1.32 billion in 2024 and is projected to reach USD 2.77 billion by 2034, growing at a CAGR of 7.7% between 2025 and 2034.
The market growth is driven by increasing demand for enhanced low-light imaging across defense, medical, industrial, and surveillance applications. Advancements in photocathode sensitivity, microchannel plate technology, and digital integration are improving image resolution, contrast, and operational efficiency in low-visibility environments. Furthermore, the adoption of night vision systems, intensified cameras, and optical instruments in military and law enforcement operations is expanding market opportunities.Overall, the market is becoming increasingly competitive, with manufacturers emphasizing technological innovation, compact form factors, and durability to meet the growing needs of defense modernization, medical diagnostics, and industrial inspection across global markets.

Image intensifiers are advanced optical devices designed to amplify low levels of ambient light, enabling clear imaging in dark or low-visibility environments. They are widely used in defense, surveillance, medical imaging, and industrial inspection applications where enhanced night vision and precision are critical. Image intensifiers operate by converting photons into electrons using a photocathode, multiplying them through a microchannel plate (MCP), and then converting them back into a visible image via a phosphor screen. Key features include high gain, superior signal-to-noise ratio, fast response time, and compact design, ensuring reliable performance in challenging conditions. Modern image intensifiers incorporate digital integration, lightweight materials, and rugged housings, improving durability, energy efficiency, and compatibility with night vision goggles, cameras, and optical systems across military, medical, and commercial applications.
Market by Diameter
18 mm
The 18 mm segment is expected to hold a significant share of the image intensifier market, driven by its widespread use in night vision goggles, handheld devices, and compact imaging systems. The 18 mm image intensifiers offer an optimal balance between size, sensitivity, and performance, making them highly suitable for defense, surveillance, and law enforcement applications where portability and precision are essential. Their compact design enables easy integration into lightweight optical systems without compromising image quality or operational reliability. Additionally, ongoing advancements in photocathode efficiency and microchannel plate technology are enhancing the low-light performance of 18 mm image intensifiers, further reinforcing their dominance over larger-diameter counterparts in both tactical and commercial imaging applications.
<18 mm
The <18 mm segment is projected to grow at a significant CAGR in the image intensifier market, driven by the increasing demand for miniaturized and portable night vision devices. This segment is particularly favored in tactical, wearable, and handheld surveillance applications, where compact size, lightweight design, and high sensitivity are critical. Technological advancements in photocathode efficiency, low-noise amplification, and ruggedized housing are enhancing the performance of sub-18 mm image intensifiers, making them increasingly suitable for both defense and commercial applications. The combination of ease of integration, operational reliability, and cost-effectiveness is expected to fuel the strong growth of this segment over the forecast period.
Market by Vertical
Defense and Surveillance
Defense and Surveillance is expected to hold the largest market share in the image intensifier market, driven by the critical need for enhanced night vision and low-light imaging capabilities in military and security operations. Image intensifiers are widely deployed in night vision goggles, weapon sights, surveillance cameras, and tactical imaging systems, where reliability, precision, and rapid response are essential. Continuous advancements in photocathode sensitivity, microchannel plate technology, and digital integration are improving performance, durability, and operational efficiency, further strengthening the adoption of image intensifiers across defense and law enforcement applications globally.
Medical
Medical is projected to grow at a significant CAGR in the image intensifier market, driven by the increasing adoption of advanced imaging systems in diagnostics, endoscopy, fluoroscopy, and minimally invasive procedures. Image intensifiers enhance image clarity, contrast, and low-light performance, which are critical for accurate diagnosis and surgical precision. Ongoing innovations in high-resolution detectors, digital integration, and compact design are improving efficiency, patient safety, and workflow in medical imaging applications. The growing demand for portable and advanced imaging solutions is expected to fuel the strong growth of this segment over the forecast period.
Market by Geography
Asia Pacific is expected to register the highest CAGR in the image intensifier market, fueled by a combination of strategic defense modernization programs, expanding surveillance networks, and rising adoption of medical imaging solutions. The region’s cost-sensitive markets are driving vendors to develop compact, high-performance, and affordable image intensifier products, enabling wider deployment across military, law enforcement, border security, and healthcare applications. Increasing investments in smart city initiatives, infrastructure security, and industrial monitoring are further supporting market expansion. Additionally, rapid urbanization, technological advancements in low-light imaging, and growing awareness of advanced night vision and imaging capabilities are creating new growth opportunities for manufacturers. The presence of a large pool of emerging economies and government incentives for defense and healthcare modernization is expected to reinforce the region’s dominant growth trajectory over the forecast period.
Market Dynamics
Driver: Increasing military expenditure worldwide
Increasing military expenditure worldwide is a key driver for the image intensifier market, as defense budgets continue to rise across developed and emerging economies. Higher military spending enables armed forces to invest in advanced night vision and low-light imaging systems, including image intensifiers used in night vision goggles, weapon sights, surveillance cameras, and tactical operations. The focus on modernizing defense infrastructure, enhancing situational awareness, and improving operational efficiency is fueling demand for high-performance, reliable, and ruggedized image intensifiers. Additionally, geopolitical tensions and the need for border security and counter-terrorism capabilities are prompting governments to adopt cutting-edge imaging technologies. This sustained investment trend is expected to significantly boost the adoption of image intensifiers globally, driving market growth over the forecast period.
Restraint: Low operational hours of image intensifier devices
Low operational hours of image intensifier devices act as a restraint in the market, as these devices often have a limited lifespan and operational durability under continuous use. Frequent replacement or maintenance of image intensifiers increases operational costs for end users, particularly in defense, surveillance, and industrial applications that require extended usage. The limited operational hours can also affect mission readiness and efficiency, especially in military and law enforcement operations where reliability in low-light conditions is critical. Additionally, the need for periodic recalibration or replacement may discourage adoption among cost-sensitive buyers, thereby slowing market growth. Manufacturers are required to innovate in durability and energy efficiency to mitigate this challenge.
Opportunity: Growing Demand for Portable and Miniaturized Devices
The increasing need for compact, lightweight, and high-performance image intensifiers presents a significant opportunity for market growth. Miniaturized devices are in high demand across tactical, wearable, and medical imaging applications, where portability, ease of integration, and operational efficiency are critical. Advances in digital integration, low-noise amplification, and energy-efficient designs allow manufacturers to develop innovative solutions that cater to evolving end-user requirements, expanding adoption in both defense and commercial segments.
Challenge: High Cost of Advanced Image Intensifiers
The premium pricing of advanced image intensifiers presents a notable challenge, particularly in cost-sensitive markets and among smaller defense or commercial operators. Devices with enhanced resolution, superior low-light sensitivity, and ruggedized designs require sophisticated materials and manufacturing processes, increasing overall costs. This can limit adoption despite strong performance advantages, creating a barrier for wider market penetration. Manufacturers must focus on cost optimization, modular designs, and scalable solutions to make high-performance image intensifiers more accessible, while maintaining quality and reliability to meet the demands of defense, surveillance, and medical applications.
Future Outlook
Between 2025 and 2034, the image intensifier market is expected to expand significantly as demand for enhanced night vision and low-light imaging solutions grows across defense, surveillance, medical, and industrial applications. Advances in photocathode sensitivity, microchannel plate technology, and digital integration will improve image clarity, operational efficiency, and device durability, while miniaturization and portable designs will broaden deployment across handheld and wearable systems. Increasing investments in military modernization, border security, law enforcement, and healthcare imaging infrastructure will further drive adoption. As the market evolves, image intensifiers will play a pivotal role in enhancing situational awareness, operational safety, and diagnostic precision, enabling high-performance imaging solutions across both defense and commercial segments.
Key Market Players
Top image intensifier companies L3Harris Technologies, Inc. (US), Exosens (France), Thales (France), Canon Inc. (Japan) and Teledyne FLIR (US).
Key Questions addressed in this report:
- What are the global trends in demand for the market?
- What are the upcoming technologies/product areas that will have a significant impact on the market in the future?
- What will be the revenue pockets for the market players in the next 6 years?
- What are the prime strategies followed by key players in the market?
 Exclusive indicates content/data unique to MarketsandMarkets and not available with any competitors.
Table of Contents
1 Introduction (Page No. - 16)
1.1 Study Objectives
1.2 Definition
1.3 Study Scope
1.3.1 Markets Covered
1.3.2 Geographic Scope
1.3.3 Years Considered
1.4 Currency
1.5 Limitations
1.6 Stakeholders
2 Research Methodology (Page No. - 19)
2.1 Research Data
2.1.1 Secondary Data
2.1.1.1 Major Secondary Sources
2.1.1.2 Key Data From Secondary Sources
2.1.2 Primary Data
2.1.2.1 Primary Interviews With Experts
2.1.3 Breakdown of Primaries
2.1.3.1 Key Data From Primary Sources
2.1.4 Secondary and Primary Research
2.1.4.1 Key Industry Insights
2.2 Market Size Estimation
2.2.1 Bottom-Up Approach
2.2.1.1 Approach for Capturing Market Share By Bottom-Up Analysis (Demand Side)
2.2.2 Top-Down Approach
2.2.2.1 Approach for Capturing Market Share By Top-Down Analysis (Supply Side)
2.3 Market Breakdown and Data Triangulation
2.4 Research Assumptions
3 Executive Summary (Page No. - 28)
4 Premium Insights (Page No. - 32)
4.1 Image Intensifier Market, 2015–2024 (USD Million)
4.2 Market, By End-Use Application
4.3 Market, By Vertical and Country in APAC
4.4 Market, By Region
4.5 Market, By Vertical
5 Market Overview (Page No. - 35)
5.1 Introduction
5.2 Market Dynamics
5.2.1 Drivers
5.2.1.1 Growing Demand for Medical Diagnostic Systems With Better Visibility
5.2.1.2 Increasing Military Expenditure Worldwide
5.2.2 Restraints
5.2.2.1 Low Operational Hours of Image Intensifier Devices
5.2.2.2 Increasing Use of Refurbished Devices
5.2.3 Opportunities
5.2.3.1 Growing Demand for Night Vision Devices
5.2.3.2 Innovation By Oems in Nondestructive Testing and Machine Vision
5.2.4 Challenges
5.2.4.1 Advantages of Flat-Panel Detectors Over Image Intensifiers
5.3 Value Chain Analysis
6 Image Intensifier Market, By Diameter (Page No. - 40)
6.1 Introduction
6.2 <18 mm
6.2.1 Photonis is Leading <18 mm Diameter Segment With 16mm Diameter Tubes
6.3 18 mm
6.3.1 Image Intensifiers With 18 mm Diameter are Mainly Used in Defense-Related Products
6.4 25 mm
6.4.1 25-mm Image Intensifiers Find Major Applications in Cameras
6.5 >25 mm
6.5.1 Image Intensifiers With >25 mm Diameter Have Major Demand in Scientific Applications
6.6 <6 Inch
6.6.1 Image Intensifiers With <6-Inch Diameter are Used in Fluoroscopy Applications
6.7 6 Inch
6.7.1 6-Inch Image Intensifiers are Mainly Used in Dental Applications
6.8 9 Inch
6.8.1 9-Inch Diameter is Preferred in General Surgery Applications
6.9 12 Inch
6.9.1 12-Inch Image Intensifiers are Preferred in Vascular Procedures
6.1 16 Inch
6.10.1 Image Intensifiers With 16-Inch Diameter Provide Comprehensive Imaging
7 Market, By End-Use Application (Page No. - 49)
7.1 Introduction
7.2 Cameras
7.2.1 as Part of Soldier Modernization Programs, Helmets are Being Integrated With Cameras Worldwide.
7.3 Scopes
7.3.1 Increasing Investments in Defence Sector Boosting the Market for Scopes
7.4 Goggles
7.4.1 Image Intensifier-Integrated Night Vision Goggles Play A Key Role in the Defense Segment.
7.5 X-Ray Detectors
7.5.1 The Image Intensifiers are Widely Used in X-Ray Detectors and are Cheaper Than Advanced Flat Panel Systems
8 Market, By Vertical (Page No. - 54)
8.1 Introduction
8.2 Defense and Surveillance
8.2.1 Law Enforcement
8.2.1.1 Image Intensifier-Integrated Night Devices Play Crucial Role in Law Enforcement
8.2.2 Battlefield
8.2.2.1 Goggles Play Key Role in Battlefield
8.3 Medical
8.3.1 Orthopedic Surgery
8.3.1.1 Mobile C-Arm Integrated With Image Intensifiers Enable Better Control Over Placement of Screws, Plates, and Nails Under Successive X-Rays
8.3.2 Vascular Studies
8.3.2.1 12-Inch Image Intensifiers are Mainly Used in Vascular Surgery and Related Applications
8.4 Industrial
8.4.1 Machine Vision Systems
8.4.1.1 Cameras are Eyes of Machine Vision Systems
8.4.2 Nondestructive Testing Systems
8.4.2.1 X-Ray Image Intensifier Have Major Applications in Radiographic Testing
8.5 Others
8.5.1 Night Vision Scopes Integrated With Image Intensifiers are Popularly Used in Hunting Applications
9 Geographic Analysis (Page No. - 70)
9.1 Introduction
9.2 North America
9.2.1 US
9.2.1.1 Growing Investment on Modernization of Defense Equipment Boosts Market
9.2.2 Canada
9.2.2.1 Increasing Number of Minimally Invasive Procedures Using Image Intensifier C-Arms
9.2.3 Mexico
9.2.3.1 Growing Industrialization is Expected to Boost Market
9.3 Europe
9.3.1 Russia
9.3.1.1 Russia is Third-Largest Defense Spender in World
9.3.2 UK
9.3.2.1 Increasing Prevalence of Lifestyle Diseases in the UK
9.3.3 France
9.3.3.1 Rise in Number of Terrorist Attacks Leads France to Increase Its Defense Budget
9.3.4 Germany
9.3.4.1 Increased Need for Monitoring Borders for Illegal Immigrants From Syria is Fueling Adoption of New Technologies in Defense Sector
9.3.5 Italy
9.3.5.1 Rising Number of Orthopedic Surgeries in Italy
9.3.6 Rest of the Europe
9.3.6.1 Growing Need for Ndt and Machine Vision Systems Fueling Demand for Image Intensifiers
9.4 APAC
9.4.1 China
9.4.1.1 China is Second-Largest Defense Spender in World
9.4.2 India
9.4.2.1 Increasing Year-On-Year Defense Expenditure Likely to Increase Spending on Night Devices
9.4.3 South Korea
9.4.3.1 Growing Spending on Force Improvement Plan (FIP) Supporting Growth of Image Intensifiers
9.4.4 Japan
9.4.4.1 Rapid Growth in Geriatric Population
9.4.5 Rest of APAC
9.4.5.1 Rising Number of Orthopedic and Cardiovascular Disease Interventions in Australia
9.5 RoW
9.5.1 Middle East
9.5.1.1 Rising Incidences of Conflicts, Sectarian Violence, and Unrest in the Middle East Have Severely Affected Defense Spending
9.5.2 Africa
9.5.2.1 Growing Industrialization in Africa Would Increase Demand for X-Ray Image Intensifiers in Ndt Systems
9.5.3 South America
9.5.3.1 Improving Healthcare Infrastructure in South America to Be A Major Growth Enabler
10 Competitive Landscape (Page No. - 93)
10.1 Overview
10.2 Key Players in Market (2018)
10.3 Competitive Leadership Mapping
10.3.1 Visionary Leaders
10.3.2 Dynamic Differentiators
10.3.3 Innovators
10.3.4 Emerging Companies
10.4 Strength of Product Portfolio (25 Companies)
10.5 Business Strategy Excellence (25 Companies)
10.6 Competitive Scenario
10.6.1 Product Launches/Developments
10.6.2 Agreements/Contracts/Partnerships
10.6.3 Mergers/Acquisitions
11 Company Profile (Page No. - 103)
(Business Overview, Products Offered, Recent Developments, SWOT Analysis, and MnM View)*
11.1 Key Players
11.1.1 L3 Technologies
11.1.2 Thales
11.1.3 Flir Systems (Armasight)
11.1.4 Photonis
11.1.5 Harris
11.1.6 Canon Medical Systems
11.1.7 Siemens
11.1.8 Alpha Optics Systems
11.1.9 Katod
11.1.10 Photek
11.1.11 Argus Imaging
11.1.12 Meomed
11.2 Other Key Players
11.2.1 Aselsan
11.2.2 Harder Digital
11.2.3 Dantec Dynamics
11.2.4 Lambert Instruments
11.2.5 Yukon Advanced Optics
11.2.6 Proxivision
11.3 Startup Ecosystem (Key Innovators)
11.3.1 DEP Technologies
11.3.2 TAK Technologies
11.3.3 Optexim JSC
*Details on Business Overview, Products Offered, Recent Developments, SWOT Analysis, and MnM View Might Not Be Captured in Case of Unlisted Companies.
12 Appendix (Page No. - 130)
12.1 Discussion Guide
12.2 Knowledge Store: Marketsandmarkets’ Subscription Portal
12.3 Available Customizations
12.4 Related Reports
12.5 Author Details
List of Tables (69 Tables)
Table 1 Image Intensifier Market, By Diameter, 2015–2024 (USD Million)
Table 2 Market for Image Intensifiers With <18 mm Diameter, By Vertical, 2015–2024 (USD Million)
Table 3 Market for Image Intensifiers With 18 mm Diameter, By Vertical, 2015–2024 (USD Million)
Table 4 Market for Image Intensifiers With 25 mm Diameter, By Vertical, 2015–2024 (USD Million)
Table 5 Market for Image Intensifiers With >25 mm Diameter, By Vertical, 2015–2024 (USD Million)
Table 6 Market for Image Intensifiers With <6-Inch Diameter, By Vertical, 2015–2024 (USD Million)
Table 7 Market for Image Intensifiers With 6-Inch Diameter, By Vertical, 2015–2024 (USD Million)
Table 8 Market for Image Intensifiers With 9-Inch Diameter, By Vertical, 2015–2024 (USD Million)
Table 9 Market for Image Intensifiers With 12-Inch Diameter, By Vertical, 2015–2024 (USD Million)
Table 10 Market for Image Intensifiers With 16-Inch Diameter, By Vertical, 2015–2024 (USD Million)
Table 11 Market, By End-Use Application, 2015–2024 (USD Million)
Table 12 Market for Cameras, By Vertical, 2015–2024 (USD Million)
Table 13 Market for Scopes, By Vertical, 2015–2024 (USD Million)
Table 14 Market for Goggles, By Vertical, 2015–2024 (USD Million)
Table 15 Market for X-Ray Detectors, By Vertical, 2015–2024 (USD Million)
Table 16 Market, By Vertical, 2015–2024 (USD Million)
Table 17 Market for Defense and Surveillance, By End-Use Application, 2015–2024 (USD Million)
Table 18 Market for Defense and Surveillance, By Region, 2015–2024 (USD Million)
Table 19 Market Defense and Surveillance in North America, By Country, 2015–2024 (USD Million)
Table 20 Market for Defense and Surveillance in Europe, By Country, 2015–2024 (USD Million)
Table 21 Market for Defense and Surveillance in APAC, By Country, 2015–2024 (USD Million)
Table 22 Market for Defense and Surveillance in RoW, By Region, 2015–2024 (USD Million)
Table 23 Market for Medical, By Region, 2015–2024 (USD Million)
Table 24 Market for Medical in North America, By Country, 2015–2024 (USD Million)
Table 25 Market for Medical in Europe, By Country, 2015–2024 (USD Million)
Table 26 Market for Medical in APAC, By Country, 2015–2024 (USD Million)
Table 27 Market for Medical in RoW By Country, 2015-2024 (USD Million)
Table 28 Market for Industrial, By End-Use Application, 2015–2024 (USD Million)
Table 29 Market for Industrial, By Region, 2015–2024 (USD Million)
Table 30 Market for Industrial in North America, By Country, 2015-2024 (USD Million)
Table 31 Market for Industrial in Europe, By Country, 2015-2024 (USD Million)
Table 32 Market for Industrial in APAC, By Country, 2015-2024 (USD Million)
Table 33 Industrial: Image Intensifier Market for Industrial in RoW, By Country, 2015-2024 (USD Million)
Table 34 Market for Others, By End-Use Application, 2015–2024 (USD Million)
Table 35 Market for Others, By Region, 2015–2024 (USD Million)
Table 36 Market for Others in North America, By Country, 2015-2024 (USD Million)
Table 37 Market for Others in Europe, By Country, 2015-2024 (USD Million)
Table 38 Market for Others in APAC, By Country, 2015-2024 (USD Million)
Table 39 Market for Others in RoW, By Region, 2015–2024 (USD Million)
Table 40 Market, By Region, 2015–2024 (USD Million)
Table 41 Market in North America, By Country, 2015–2024 (USD Million)
Table 42 Market in North America, By Vertical, 2015–2024 (USD Million)
Table 43 Market in US, By Vertical, 2015–2024 (USD Million)
Table 44 Market in Canada, By Vertical, 2015–2024 (USD Million)
Table 45 Market in Mexico, By Vertical, 2015–2024 (USD Million)
Table 46 Market in Europe, By Country, 2015–2024 (USD Million)
Table 47 Market in Europe, By Vertical, 2015–2024 (USD Million)
Table 48 Market in Russia, By Vertical, 2015–2024 (USD Million)
Table 49 Market in Uk, By Vertical, 2015–2024 (USD Million)
Table 50 Market in France By Vertical, 2015–2024 (USD Million)
Table 51 Market in Germany, By Vertical, 2015–2024 (USD Million)
Table 52 Market in Italy, By Vertical, 2015–2024 (USD Million)
Table 53 Market in Rest of Europe, By Vertical, 2015–2024 (USD Million)
Table 54 Market in APAC, By Country, 2015–2024 (USD Million)
Table 55 Market in APAC, By Vertical, 2015–2024 (USD Million)
Table 56 Market in China, By Vertical, 2015–2024 (USD Million)
Table 57 Market in India, By Vertical, 2015–2024 (USD Million)
Table 58 Market in South Korea, By Vertical, 2015–2024 (USD Million)
Table 59 Market in Japan, By Vertical, 2015–2024 (USD Million)
Table 60 Market in Rest of APAC, By Vertical, 2015–2024 (USD Million)
Table 61 Market in RoW, By Region, 2015–2024 (USD Million)
Table 62 Market in RoW, By Vertical, 2015–2024 (USD Million)
Table 63 Market in Middle East, By Vertical, 2015–2024 (USD Million)
Table 64 Market in Africa, By Vertical, 2015–2024 (USD Million)
Table 65 Market in South America, By Vertical, 2015–2024 (USD Million)
Table 66 Top 5 Players in Market, 2018
Table 67 Product Launches/Developments (2015–2018)
Table 68 Agreements/Contracts/Partnerships (2015–2018)
Table 69 Mergers/Acquisitions (2015–2018)
List of Figures (34 Figures)
Figure 1 Image Intensifier Market: Research Design
Figure 2 Market Size Estimation Methodology: Bottom-Up Approach
Figure 3 Market Size Estimation Methodology: Top-Down Approach
Figure 4 Data Triangulation
Figure 5 Assumptions for Research Study
Figure 6 Defense and Surveillance to Be Best Segment to Invest for Market Players During Forecast Period
Figure 7 Market for Goggles to Grow at Highest CAGR From 2019 to 2024
Figure 8 18-mm Image Intensifiers to Dominate Overall Market, in Terms of Size, During Forecast Period
Figure 9 Market, By Region, 2018
Figure 10 Increasing Demand for Image Intensifiers From Defense Sector Driving Market Growth
Figure 11 Goggles to Witness Highest CAGR in Market During Forecast Period
Figure 12 China Held Largest Share of Market in APAC in 2018
Figure 13 North America to Hold Largest Share of Market in 2019
Figure 14 Market for Defense and Surveillance to Grow at Highest CAGR During Forecast Period
Figure 15 Increasing Military Expenditures Drive Market Growth
Figure 16 Diagnostics Activity in England in Terms of Number of Procedures, 2015 and 2017 (Million)
Figure 17 Defense Expenditure in Nato Members (2015–2017)
Figure 18 Value Chain Analysis: Image Intensifier Market
Figure 19 Market for Image Intensifiers With <8 mm Diameter to Grow at Highest CAGR During Forecast Period
Figure 20 Image Intensifier Shipment Expected to Grow From 2015 to 2024
Figure 21 Market for Goggles to Grow at Highest CAGR During Forecast Period
Figure 22 Defense and Surveillance to Dominate Market During Forecast Period
Figure 23 Geographic Snapshot of Market
Figure 24 North America: Market Snapshot
Figure 25 Europe: Market Snapshot
Figure 26 APAC: Market Snapshot
Figure 27 Companies Adopted Partnerships, Agreements, and Contracts as Key Growth Strategies in Market During 2015–2018
Figure 28 Market (Global) Competitive Leadership Mapping, 2018
Figure 29 Market Evaluation Framework: Contracts, Partnerships, and Agreements Have Been Major Strategies During 2016–2018
Figure 30 L3 Technologies: Company Snapshot
Figure 31 Thales: Company Snapshot
Figure 32 Flir Systems (Armasight): Company Snapshot
Figure 33 Harris Corporation: Company Snapshot
Figure 34 Siemens: Company Snapshot
The study involved 4 major activities to estimate the current size of the image intensifier market. Exhaustive secondary research was done to collect information about the market being studied, along with its peer and parent markets. The next step was to validate these findings, assumptions, and sizing, with industry experts across value chain through primary research. Both, top-down and bottom-up approaches were employed to estimate the complete market size. Thereafter, market breakdown and data triangulation were used to estimate the market size of segments and subsegments.
Secondary Research
In the secondary research process, various secondary sources—such as Hoovers, Bloomberg BusinessWeek, and Dun & Bradstreet—have been referred to for identifying and collecting information for this study. The other secondary sources used during the study included annual reports, press releases and investor presentations of companies, white papers, certified publications, articles by recognized authors, gold standard and silver standard websites, regulatory bodies, trade directories, and databases.
Primary Research
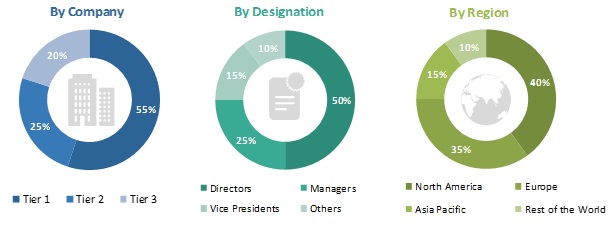
Several stakeholders in the image intensifier market are raw material suppliers, processors, end-product manufacturers, and regulatory organizations in the supply chain. The demand side of this market is characterized by the defense and surveillance, medical, industrial, hunting, navigation segments, among others. The supply side highlights the advancements in technology and diverse use cases. Various primary sources from both supply and demand sides of the market were interviewed to obtain qualitative and quantitative information. The breakdown of primary respondents has been provided below.
To know about the assumptions considered for the study, download the pdf brochure
Market Size Estimation
Both, top-down and bottom-up approaches were implemented to estimate and validate the total size of the image intensifier market. These methods were also used extensively to estimate the size of various subsegments in the market. The research methodology used to estimate the market size has been mentioned in brief below:
- Key players in the industry and markets have been identified through extensive secondary research.
- The industry’s supply chain and market size, in terms of value, have been determined through primary and secondary research processes.
- All percentage shares, splits, and breakdowns have been determined using secondary sources and verified through primary sources.
Data Triangulation
After arriving at the overall market size using the estimation processes as explained above the market was split into several segments and subsegments. To complete the overall market engineering process and arrive at the exact statistics of each market segment and subsegment, the data triangulation and market breakdown procedures were employed, wherever applicable. The data were triangulated by studying various factors and trends from both demand and supply sides; the demand side mainly includes the defense and surveillance, medical, industrial, hunting, and navigation, among others.
Report Objectives
- To define and forecast the image intensifier market, in terms of value, segmented on the basis of diameter, end-use application, vertical, and geography
- To forecast the image intensifier market in terms of volume
- To forecast the market size, in terms of value, for various segments with regard to 4 main regions: North America, Europe, Asia Pacific (APAC), and Rest of the World (RoW)
- To provide detailed information regarding drivers, restraints, opportunities, and challenges, which are the major factors influencing the market growth
- To analyze micromarkets with respect to individual growth trends, prospects, and contributions to the overall market
- To provide a detailed overview of the value chain pertaining to the market
- To analyze opportunities in the market for various stakeholders by identifying high-growth segments of the image intensifier market
- To profile key players and comprehensively analyze their market position in terms of the ranking and core competencies, as well as detail the competitive landscape for market leaders
- To analyze competitive developments such as partnerships, contracts, agreements and acquisitions, product launches and developments, and expansions in the market
Available Customizations
With the given market data, MarketsandMarkets offers customizations according to the company’s specific needs.
The following customization options are available for the report:
Company Information
- Detailed analysis and profiling of additional market players on the basis of various blocks of the value chain
Product Matrix:
- Provides detailed analysis and profiling of additional market players (up to 5)


Growth opportunities and latent adjacency in Image Intensifier Market