2
RESEARCH METHODOLOGY
45
5
MARKET OVERVIEW
In situ hybridization's precision medicine role surges amid high costs and technical complexities.
67
5.2.1.1
TECHNOLOGICAL INNOVATIONS FOR ADVANCED IN SITU HYBRIDIZATION CAPABILITIES
5.2.1.2
INCREASING ADOPTION OF IN SITU HYBRIDIZATION IN PRECISION MEDICINES AND LABORATORY-DEVELOPED TESTS
5.2.1.3
RISING DEMAND FOR SPATIAL TRANSCRIPTOMICS IN CANCER AND NEUROSCIENCE RESEARCH
5.2.2.1
COMPETITION FROM ALTERNATIVE MOLECULAR DIAGNOSTIC TECHNIQUES
5.2.2.2
HIGH COST OF IN SITU HYBRIDIZATION TECHNIQUES IN RESEARCH AND CLINICAL APPLICATIONS
5.2.3.1
ADVANTAGES OF IN SITU HYBRIDIZATION OVER COMPETING TECHNOLOGIES
5.2.3.2
RISING ADOPTION OF COMPANION DIAGNOSTIC SOLUTIONS
5.2.3.3
HIGH GROWTH OPPORTUNITIES IN EMERGING ECONOMIES
5.2.4.1
TECHNICAL COMPLEXITIES ASSOCIATED WITH IN SITU HYBRIDIZATION
5.3
TRENDS/DISRUPTIONS IMPACTING CUSTOMER’S BUSINESS
5.6.1.1
FLUORESCENCE IN SITU HYBRIDIZATION (FISH)
5.6.1.2
CHROMOGENIC IN SITU HYBRIDIZATION (CISH)
5.6.2
COMPLEMENTARY TECHNOLOGIES
5.6.2.1
IMMUNOFLUORESCENCE (IF)
5.6.2.2
NEXT-GENERATION SEQUENCING (NGS)
5.6.3
ADJACENT TECHNOLOGIES
5.6.3.1
IMMUNOHISTOCHEMISTRY (IHC)
5.7.1
TOP APPLICANTS/OWNERS (COMPANIES) FOR IN SITU HYBRIDIZATION PATENTS
5.7.2
LIST OF KEY PATENTS
5.8
KEY CONFERENCES & EVENTS, 2025–2026
5.9
PORTER’S FIVE FORCES ANALYSIS
5.9.1
INTENSITY OF COMPETITIVE RIVALRY
5.9.2
THREAT OF SUBSTITUTES
5.9.3
BARGAINING POWER OF BUYERS
5.9.4
BARGAINING POWER OF SUPPLIERS
5.9.5
THREAT OF NEW ENTRANTS
5.10
KEY STAKEHOLDERS & BUYING CRITERIA
5.10.1
KEY STAKEHOLDERS IN BUYING PROCESS
5.10.2
KEY BUYING CRITERIA
5.11.1
AVERAGE SELLING PRICE TREND OF IN SITU HYBRIDIZATION PRODUCTS, BY KEY PLAYER, 2022–2024
5.11.2
AVERAGE SELLING PRICE TREND OF IN SITU HYBRIDIZATION CONSUMABLES, BY REGION, 2022–2024
5.12
INVESTMENT & FUNDING SCENARIO
5.13
REGULATORY LANDSCAPE
5.13.1
REGULATORY FRAMEWORK
5.13.2
REGULATORY BODIES, GOVERNMENT AGENCIES, AND OTHER ORGANIZATIONS
5.14
IMPACT OF AI/GEN AI ON IN SITU HYBRIDIZATION MARKET
5.14.2
IMPACT OF AI ON IN SITU HYBRIDIZATION ECOSYSTEM
5.14.3
FUTURE OF AI IN IN SITU HYBRIDIZATION ECOSYSTEM
5.15
IMPACT OF 2025 US TARIFF ON IN SITU HYBRIDIZATION MARKET
5.15.3
PRICE IMPACT ANALYSIS
5.15.4
IMPACT ON COUNTRY/REGION
5.15.5
IMPACT ON END-USE INDUSTRIES
5.15.5.1
HOSPITALS & DIAGNOSTIC LABORATORIES
5.15.5.2
ACADEMIC & RESEARCH INSTITUTES
5.15.5.3
PHARMACEUTICAL & BIOTECHNOLOGY COMPANIES
5.15.5.4
CONTRACT RESEARCH ORGANIZATIONS
6
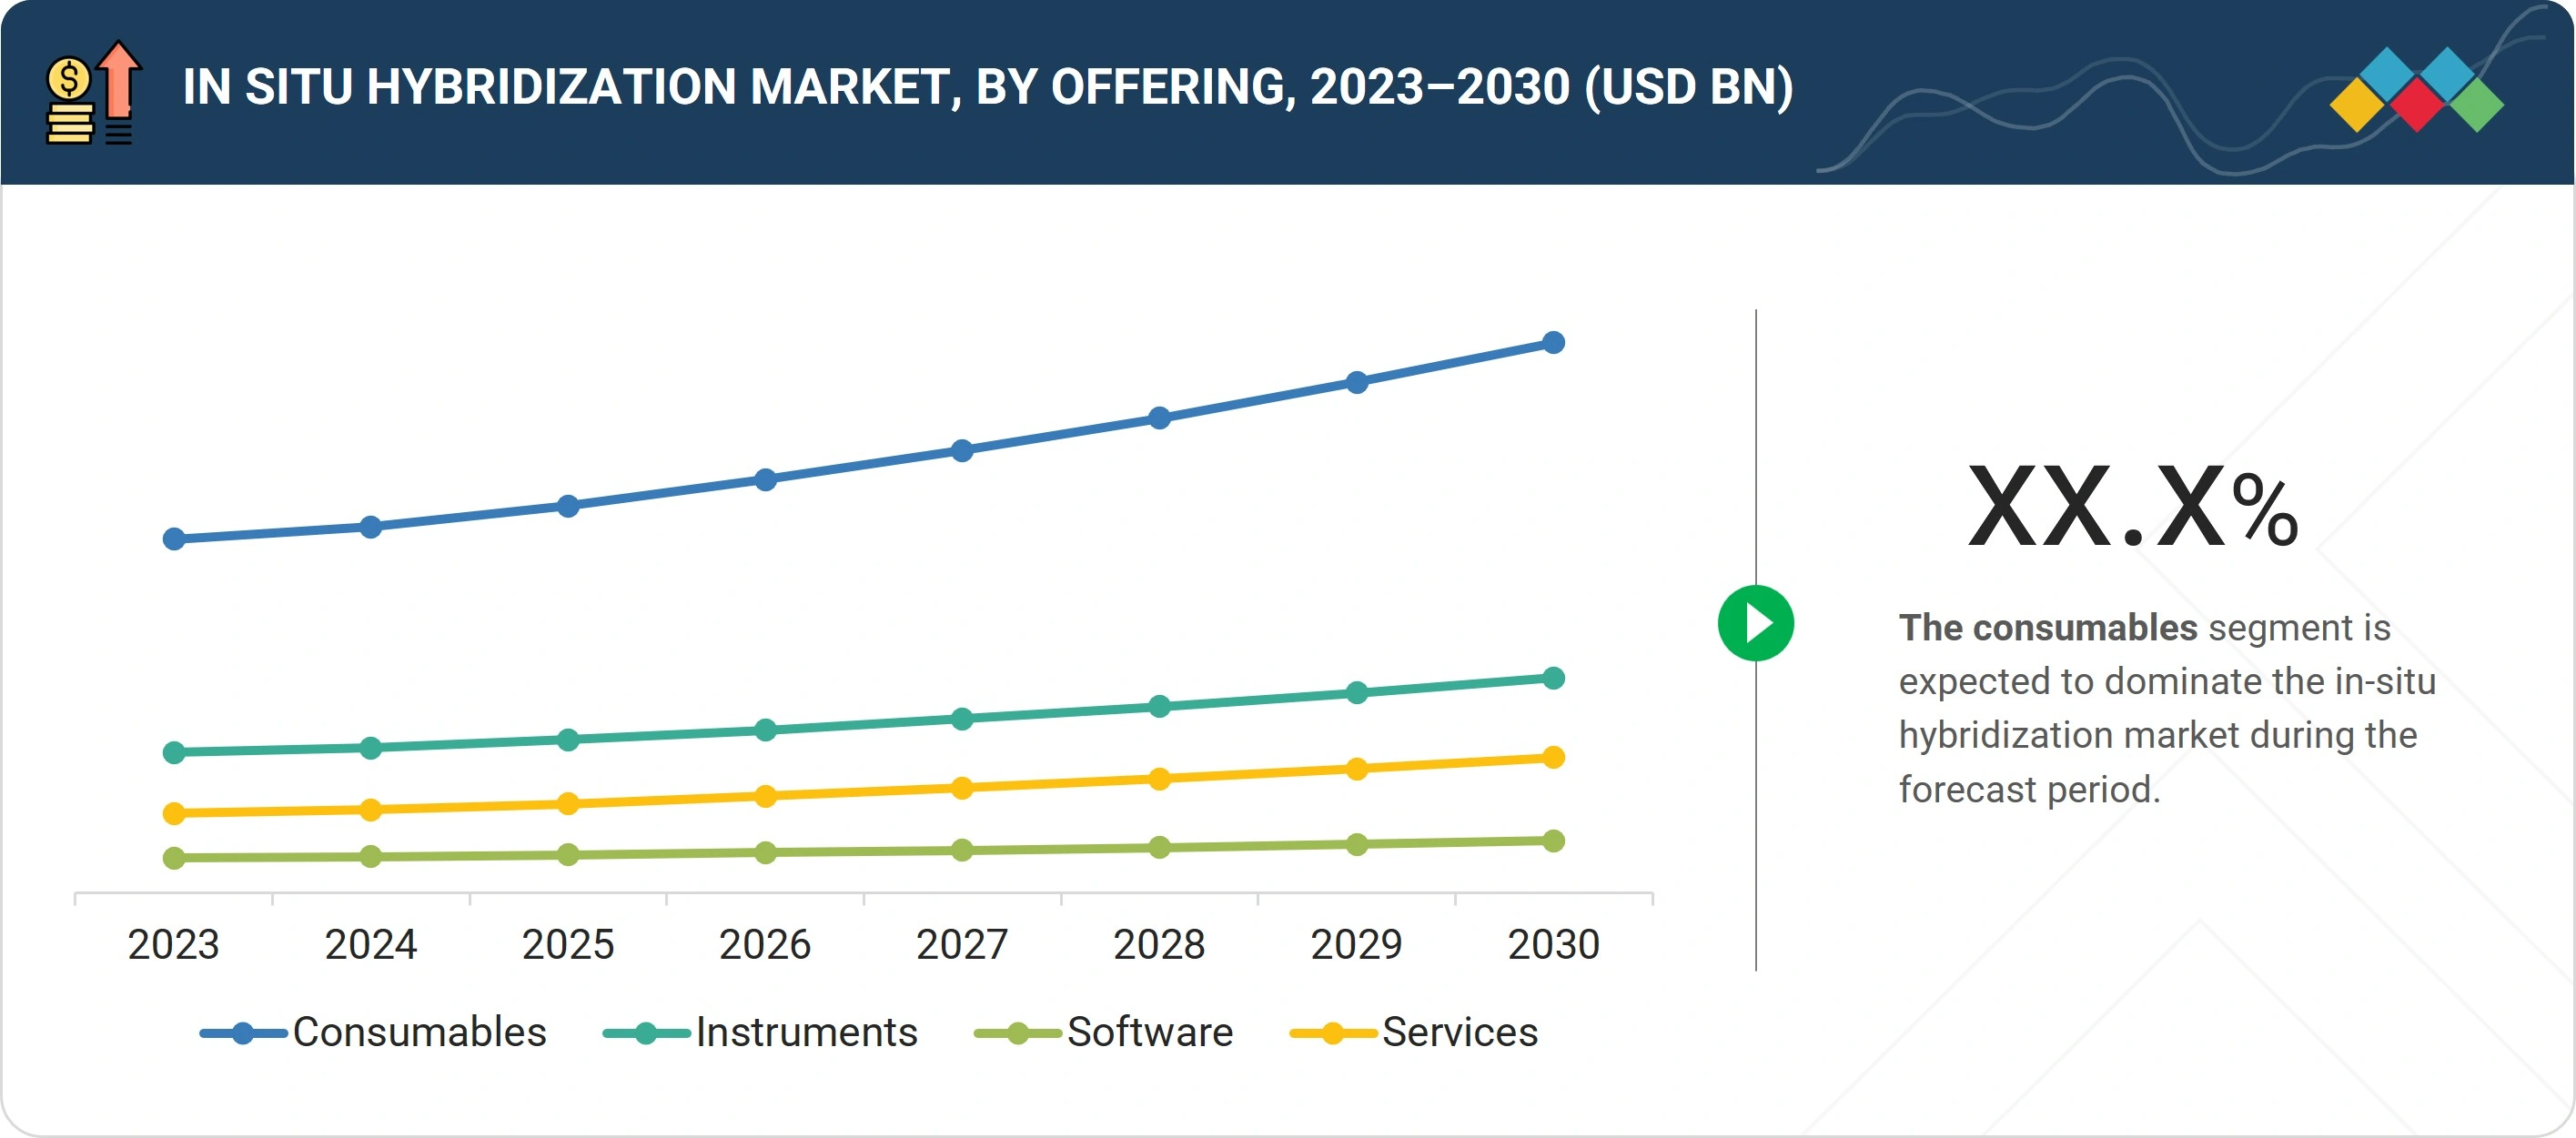
IN SITU HYBRIDIZATION MARKET, BY OFFERING
Market Size & Growth Rate Forecast Analysis to 2030 in USD Million | 81 Data Tables
104
6.2.1.1
INCREASING DEMAND FOR COMPANION DIAGNOSTICS AND PERSONALIZED MEDICINES TO SUPPORT MARKET GROWTH
6.2.2.1
TECHNOLOGICAL ADVANCEMENTS IN PROBE DESIGN AND CHEMISTRY TO PROPEL MARKET GROWTH
6.2.3
ACCESSORIES & OTHER CONSUMABLES
6.2.3.1
GROWING ADOPTION OF IN SITU HYBRIDIZATION IN RESEARCH AND CLINICAL DIAGNOSTICS TO AID MARKET GROWTH
6.3.1
AUTOMATED IN SITU HYBRIDIZATION INSTRUMENTS
6.3.1.1
INCREASED ADOPTION OF FASTER AND MORE RELIABLE AUTOMATED SYSTEMS TO BOOST MARKET GROWTH
6.3.2
MANUAL IN SITU HYBRIDIZATION INSTRUMENTS
6.3.2.1
PERSISTENT DEMAND IN EMERGING ECONOMIES TO MAINTAIN MARKET GROWTH
6.4.1
INTEGRATION OF ARTIFICIAL INTELLIGENCE AND MACHINE LEARNING IN SOFTWARE TO SUPPORT GROWTH
6.5.1
DATA INTERPRETATION SERVICES
6.5.1.1
INCREASING USE OF MULTIPLEX ASSAYS AND SPATIAL BIOLOGY TECHNIQUES TO BOOST SEGMENT GROWTH
6.5.2
CUSTOM PROBE DESIGN SERVICES
6.5.2.1
RISING DEMAND FOR CUSTOMIZED PROBES IN RESEARCH AND DRUG DEVELOPMENT TO FAVOR MARKET GROWTH
7
IN SITU HYBRIDIZATION MARKET, BY TECHNOLOGY
Market Size & Growth Rate Forecast Analysis to 2030 in USD Million | 37 Data Tables
145
7.2
FLUORESCENCE IN SITU HYBRIDIZATION (FISH)
7.2.1
DNA FLUORESCENCE IN SITU HYBRIDIZATION (DNA-FISH)
7.2.1.1
EXTENSIVE USE IN RESEARCH AND COMPANION DIAGNOSTICS TO FUEL SEGMENT GROWTH
7.2.2
RNA FLUORESCENCE IN SITU HYBRIDIZATION (RNA-FISH)
7.2.2.1
RISE IN BIOMEDICAL RESEARCH ACTIVITY TO DRIVE ADOPTION OF RNA-FISH TECHNOLOGY
7.2.3
PNA FLUORESCENCE IN SITU HYBRIDIZATION (PNA-FISH)
7.2.3.1
HIGH SENSITIVITY OFFERED BY PNA FISH TO FUEL PRECISE AND RELIABLE DETECTION AT LOW PROBE CONCENTRATIONS
7.3
CHROMOGENIC IN SITU HYBRIDIZATION (CISH)
7.3.1
COST-EFFECTIVENESS, PRESERVATION OF TISSUE MORPHOLOGY, AND EASE OF INTERPRETATION TO BOOST SEGMENT GROWTH
8
IN SITU HYBRIDIZATION MARKET, BY APPLICATION
Market Size & Growth Rate Forecast Analysis to 2030 in USD Million | 73 Data Tables
165
8.2
CLINICAL DIAGNOSTIC APPLICATIONS
8.2.1.1
RISING NUMBER OF CANCER CASES AND INCREASING FOCUS ON PRECISION MEDICINES TO DRIVE SEGMENT
8.2.2
INFECTIOUS DISEASE DIAGNOSTICS
8.2.2.1
GROWING DEMAND FOR HIGH SENSITIVITY AND SPECIFICITY DIAGNOSTIC METHODS IN RESOURCE-LIMITED SETTINGS TO SPUR MARKET GROWTH
8.2.3
GENETIC DISEASE DIAGNOSTICS
8.2.3.1
RISING ADOPTION OF PRENATAL AND NEONATAL SCREENING TO PROPEL SEGMENT GROWTH
8.2.4
OTHER CLINICAL DIAGNOSTIC APPLICATIONS
8.3
RESEARCH APPLICATIONS
8.3.1
NEUROSCIENCE RESEARCH
8.3.1.1
GROWING FOCUS ON NEUROLOGICAL RESEARCH TO INCREASE R&D IN NEUROSCIENCE-BASED ISH TECHNOLOGIES
8.3.2
IMMUNOLOGY RESEARCH
8.3.2.1
RISING PREVALENCE OF AUTOIMMUNE DISEASES TO SUPPORT MARKET GROWTH
8.3.3
OTHER RESEARCH APPLICATIONS
8.4
DRUG DISCOVERY & DEVELOPMENT
8.4.1
RISING DEMAND FOR NUCLEIC ACID-BASED THERAPIES TO FAVOR MARKET GROWTH
9
IN SITU HYBRIDIZATION MARKET, BY END USER
Market Size & Growth Rate Forecast Analysis to 2030 in USD Million | 29 Data Tables
202
9.2
HOSPITALS & DIAGNOSTIC LABORATORIES
9.2.1
RISING DEMAND FOR MOLECULAR TESTS AND INCREASING NEED FOR ACCURATE DISEASE DIAGNOSIS TO DRIVE MARKET
9.3
ACADEMIC & RESEARCH INSTITUTES
9.3.1
INCREASING GOVERNMENT AND PRIVATE FUNDING FOR LIFE SCIENCE AND BIOMEDICAL RESEARCH TO FUEL MARKET GROWTH
9.4
PHARMACEUTICAL & BIOTECHNOLOGY COMPANIES
9.4.1
INCREASING FOCUS ON DEVELOPING PRECISION TREATMENTS TO PROPEL MARKET GROWTH
9.5
CONTRACT RESEARCH ORGANIZATIONS
9.5.1
INCREASING OUTSOURCING OF RESEARCH ACTIVITIES IN TISSUE DIAGNOSTICS TO SUPPORT MARKET GROWTH
10
IN SITU HYBRIDIZATION MARKET, BY REGION
Comprehensive coverage of 7 Regions with country-level deep-dive of 16 Countries | 293 Data Tables.
217
10.2.1
MACROECONOMIC ANALYSIS FOR NORTH AMERICA
10.2.2.1
US TO DOMINATE NORTH AMERICAN IN SITU HYBRIDIZATION MARKET DURING STUDY PERIOD
10.2.3.1
INCREASING CANCER BURDEN AND EXPANDING IN SITU HYBRIDIZATION APPLICATIONS IN CANCER RESEARCH TO PROPEL MARKET GROWTH
10.3.1
MACROECONOMIC ANALYSIS FOR EUROPE
10.3.2.1
RESEARCH ADVANCEMENTS AND CORPORATE DEVELOPMENTS TO FUEL MARKET GROWTH
10.3.3.1
HIGH GOVERNMENT HEALTHCARE INVESTMENTS IN GENOMIC RESEARCH TO SUPPORT MARKET GROWTH
10.3.4.1
RISING GOVERNMENT INVESTMENT IN PHARMACEUTICAL INDUSTRY TO PROPEL MARKET GROWTH
10.3.5.1
HIGH R&D INVESTMENTS AND ADVANCED PHARMACEUTICAL INDUSTRY TO FAVOR MARKET GROWTH
10.3.6.1
GROWING FOCUS ON CANCER BIOMARKER DEVELOPMENT TO AID MARKET GROWTH
10.4.1
MACROECONOMIC ANALYSIS FOR ASIA PACIFIC
10.4.2.1
INCREASED FOCUS ON PRECISION MEDICINE AND LOCAL MANUFACTURING OF IN SITU HYBRIDIZATION TECHNOLOGIES TO SPUR MARKET GROWTH
10.4.3.1
STRINGENT REGULATORY GUIDELINES AND LARGE GERIATRIC POPULATION TO AUGMENT MARKET GROWTH
10.4.4.1
RISING AWARENESS OF CANCER AND GENETIC DISORDERS TO SUPPORT MARKET GROWTH
10.4.5.1
ROBUST GOVERNMENT SUPPORT AND ACTIVE GENETIC RESEARCH TO PROPEL MARKET GROWTH
10.4.6.1
INCREASED FOCUS ON GENOMIC AND DIAGNOSTIC RESEARCH TO AID MARKET ADOPTION OF IN SITU HYBRIDIZATION PRODUCTS
10.4.7
REST OF ASIA PACIFIC
10.5.1
MACROECONOMIC ANALYSIS FOR LATIN AMERICA
10.5.2.1
GROWING FOCUS ON PRECISION DIAGNOSTICS TO DRIVE MARKET
10.5.3.1
INCREASING COLLABORATION AMONG KEY PLAYERS TO SPUR MARKET GROWTH
10.5.4
REST OF LATIN AMERICA
10.6.1
MACROECONOMIC ANALYSIS FOR MIDDLE EAST
10.6.2.1
KINGDOM OF SAUDI ARABIA
10.6.3
REST OF GCC COUNTRIES
10.6.4
REST OF MIDDLE EAST
10.7.1
GROWING DEMAND FOR GENOMICS INFRASTRUCTURE AND MOLECULAR DIAGNOSTICS TO PROPEL MARKET GROWTH
10.7.2
MACROECONOMIC ANALYSIS FOR AFRICA
11
COMPETITIVE LANDSCAPE
Discover top strategies driving market dominance in in situ hybridization by key players and startups.
361
11.2
KEY PLAYERS STRATEGIES/RIGHT TO WIN
11.2.1
OVERVIEW OF STRATEGIES ADOPTED BY KEY PLAYERS IN IN SITU HYBRIDIZATION MARKET
11.3
REVENUE ANALYSIS, 2020–2024
11.4
MARKET SHARE ANALYSIS, 2024
11.5
COMPANY EVALUATION MATRIX: KEY PLAYERS, 2024
11.5.5
COMPANY FOOTPRINT: KEY PLAYERS, 2024
11.5.5.1
COMPANY FOOTPRINT
11.5.5.2
REGION FOOTPRINT
11.5.5.3
OFFERING FOOTPRINT
11.5.5.4
TECHNOLOGY FOOTPRINT
11.6
COMPANY EVALUATION MATRIX: STARTUPS/SMES, 2024
11.6.1
PROGRESSIVE COMPANIES
11.6.2
RESPONSIVE COMPANIES
11.6.5
COMPETITIVE BENCHMARKING: STARTUPS/SMES, 2024
11.6.5.1
DETAILED LIST OF KEY STARTUPS/SMES
11.6.5.2
COMPETITIVE BENCHMARKING OF KEY STARTUPS/SMES
11.7
COMPANY VALUATION & FINANCIAL METRICS
11.8
BRAND/PRODUCT COMPARISON
11.9
COMPETITIVE SCENARIO
11.9.1
PRODUCT LAUNCHES & APPROVALS
12
COMPANY PROFILES
In-depth Company Profiles of Leading Market Players with detailed Business Overview, Product and Service Portfolio, Recent Developments, and Unique Analyst Perspective (MnM View)
381
12.1.1
F. HOFFMANN-LA ROCHE LTD.
12.1.1.1
BUSINESS OVERVIEW
12.1.1.2
PRODUCTS/SERVICES/SOLUTIONS OFFERED
12.1.1.3
RECENT DEVELOPMENTS
12.1.4
THERMO FISHER SCIENTIFIC INC.
12.1.6
AGILENT TECHNOLOGIES, INC.
12.1.8
BIOCARE MEDICAL, LLC
12.1.10
CREATIVE BIOARRAY
12.1.11
ABNOVA CORPORATION
12.1.13
ENZO BIOCHEM INC.
12.1.15
GENEMED BIOTECHNOLOGIES, INC.
12.2.1
MOLECULAR INSTRUMENTS, INC.
12.2.2
OXFORD GENE TECHNOLOGY IP LIMITED
12.2.3
HISTO-LINE LABORATORIES
12.2.6
LGC BIOSEARCH TECHNOLOGIES
12.2.8
KANEKA EUROGENTEC S.A.
12.2.9
LIFE TECHNOLOGIES (INDIA) PVT. LTD.
12.2.10
GENECOPOEIA, INC.
13.2
KNOWLEDGESTORE: MARKETSANDMARKETS’ SUBSCRIPTION PORTAL
13.3
CUSTOMIZATION OPTIONS
TABLE 1
IN SITU HYBRIDIZATION MARKET: INCLUSIONS & EXCLUSIONS
TABLE 2
IN SITU HYBRIDIZATION MARKET: IMPACT ANALYSIS OF SUPPLY- AND DEMAND-SIDE FACTORS
TABLE 3
IN SITU HYBRIDIZATION MARKET: RISK ANALYSIS
TABLE 4
IN SITU HYBRIDIZATION MARKET: IMPACT ANALYSIS OF DRIVERS, RESTRAINTS, OPPORTUNITIES, AND CHALLENGES
TABLE 5
IN SITU HYBRIDIZATION MARKET: ROLE IN ECOSYSTEM
TABLE 6
IN SITU HYBRIDIZATION MARKET: DETAILED ANALYSIS OF KEY PATENTS, 2024
TABLE 7
IN SITU HYBRIDIZATION MARKET: DETAILED LIST OF KEY CONFERENCES & EVENTS, JANUARY 2025–DECEMBER 2026
TABLE 8
IN SITU HYBRIDIZATION MARKET: PORTER’S FIVE FORCES
TABLE 9
INFLUENCE OF KEY STAKEHOLDERS ON BUYING PROCESS OF IN SITU HYBRIDIZATION-BASED OFFERINGS
TABLE 10
KEY BUYING CRITERIA, BY END USER
TABLE 11
AVERAGE SELLING PRICE TREND OF IN SITU HYBRIDIZATION PRODUCTS, BY KEY PLAYER, 2022–2024 (USD)
TABLE 12
AVERAGE SELLING PRICE TREND OF IN SITU HYBRIDIZATION CONSUMABLES, BY REGION, 2022–2024 (USD)
TABLE 13
NORTH AMERICA: REGULATORY BODIES, GOVERNMENT AGENCIES, AND OTHER ORGANIZATIONS
TABLE 14
EUROPE: REGULATORY BODIES, GOVERNMENT AGENCIES, AND OTHER ORGANIZATIONS
TABLE 15
ASIA PACIFIC: REGULATORY BODIES, GOVERNMENT AGENCIES, AND OTHER ORGANIZATIONS
TABLE 16
REST OF THE WORLD: REGULATORY BODIES, GOVERNMENT AGENCIES, AND OTHER ORGANIZATIONS
TABLE 17
US ADJUSTED RECIPROCAL TARIFF RATES
TABLE 18
IN SITU HYBRIDIZATION PRODUCTS-RELATED TARIFF REVISION
TABLE 19
IMPACT ON END-USE APPLICATIONS OF IN SITU HYBRIDIZATION PRODUCTS
TABLE 20
IN SITU HYBRIDIZATION MARKET, BY OFFERING, 2023–2030 (USD MILLION)
TABLE 21
IN SITU HYBRIDIZATION CONSUMABLES MARKET, BY REGION, 2023–2030 (USD MILLION)
TABLE 22
NORTH AMERICA: IN SITU HYBRIDIZATION CONSUMABLES MARKET, BY COUNTRY, 2023–2030 (USD MILLION)
TABLE 23
EUROPE: IN SITU HYBRIDIZATION CONSUMABLES MARKET, BY COUNTRY, 2023–2030 (USD MILLION)
TABLE 24
ASIA PACIFIC: IN SITU HYBRIDIZATION CONSUMABLES MARKET, BY COUNTRY, 2023–2030 (USD MILLION)
TABLE 25
LATIN AMERICA: IN SITU HYBRIDIZATION CONSUMABLES MARKET, BY COUNTRY, 2023–2030 (USD MILLION)
TABLE 26
MIDDLE EAST: IN SITU HYBRIDIZATION CONSUMABLES MARKET, BY REGION, 2023–2030 (USD MILLION)
TABLE 27
GCC COUNTRIES: IN SITU HYBRIDIZATION CONSUMABLES MARKET, BY COUNTRY, 2023–2030 (USD MILLION)
TABLE 28
IN SITU HYBRIDIZATION CONSUMABLES MARKET, BY TYPE, 2023–2030 (USD MILLION)
TABLE 29
KITS & REAGENTS MARKET, BY REGION, 2023–2030 (USD MILLION)
TABLE 30
NORTH AMERICA: KITS & REAGENTS MARKET, BY COUNTRY, 2023–2030 (USD MILLION)
TABLE 31
EUROPE: KITS & REAGENTS MARKET, BY COUNTRY, 2023–2030 (USD MILLION)
TABLE 32
ASIA PACIFIC: KITS & REAGENTS MARKET, BY COUNTRY, 2023–2030 (USD MILLION)
TABLE 33
LATIN AMERICA: KITS & REAGENTS MARKET, BY COUNTRY, 2023–2030 (USD MILLION)
TABLE 34
MIDDLE EAST: KITS & REAGENTS MARKET, BY REGION, 2023–2030 (USD MILLION)
TABLE 35
GCC COUNTRIES: KITS & REAGENTS MARKET, BY COUNTRY, 2023–2030 (USD MILLION)
TABLE 36
PROBE & PROBE KITS MARKET, BY REGION, 2023–2030 (USD MILLION)
TABLE 37
NORTH AMERICA: PROBE & PROBE KITS MARKET, BY COUNTRY, 2023–2030 (USD MILLION)
TABLE 38
EUROPE: PROBE & PROBE KITS MARKET, BY COUNTRY, 2023–2030 (USD MILLION)
TABLE 39
ASIA PACIFIC: PROBE & PROBE KITS MARKET, BY COUNTRY, 2023–2030 (USD MILLION)
TABLE 40
LATIN AMERICA: PROBE & PROBE KITS MARKET, BY COUNTRY, 2023–2030 (USD MILLION)
TABLE 41
MIDDLE EAST: PROBE & PROBE KITS MARKET, BY REGION, 2023–2030 (USD MILLION)
TABLE 42
GCC COUNTRIES: PROBE & PROBE KITS MARKET, BY COUNTRY, 2023–2030 (USD MILLION)
TABLE 43
ACCESSORIES & OTHER CONSUMABLES MARKET, BY REGION, 2023–2030 (USD MILLION)
TABLE 44
NORTH AMERICA: ACCESSORIES & OTHER CONSUMABLES MARKET, BY COUNTRY, 2023–2030 (USD MILLION)
TABLE 45
EUROPE: ACCESSORIES & OTHER CONSUMABLES MARKET, BY COUNTRY, 2023–2030 (USD MILLION)
TABLE 46
ASIA PACIFIC: ACCESSORIES & OTHER CONSUMABLES MARKET, BY COUNTRY, 2023–2030 (USD MILLION)
TABLE 47
LATIN AMERICA: ACCESSORIES & OTHER CONSUMABLES MARKET, BY COUNTRY, 2023–2030 (USD MILLION)
TABLE 48
MIDDLE EAST: ACCESSORIES & OTHER CONSUMABLES MARKET, BY REGION, 2023–2030 (USD MILLION)
TABLE 49
GCC COUNTRIES: ACCESSORIES & OTHER CONSUMABLES MARKET, BY COUNTRY, 2023–2030 (USD MILLION)
TABLE 50
IN SITU HYBRIDIZATION INSTRUMENTS MARKET, BY REGION, 2023–2030 (USD MILLION)
TABLE 51
NORTH AMERICA: IN SITU HYBRIDIZATION INSTRUMENTS MARKET, BY COUNTRY, 2023–2030 (USD MILLION)
TABLE 52
EUROPE: IN SITU HYBRIDIZATION INSTRUMENTS MARKET, BY COUNTRY, 2023–2030 (USD MILLION)
TABLE 53
ASIA PACIFIC: IN SITU HYBRIDIZATION INSTRUMENTS MARKET, BY COUNTRY, 2023–2030 (USD MILLION)
TABLE 54
LATIN AMERICA: IN SITU HYBRIDIZATION INSTRUMENTS MARKET, BY COUNTRY, 2023–2030 (USD MILLION)
TABLE 55
MIDDLE EAST: IN SITU HYBRIDIZATION INSTRUMENTS MARKET, BY REGION, 2023–2030 (USD MILLION)
TABLE 56
GCC COUNTRIES: IN SITU HYBRIDIZATION INSTRUMENTS MARKET, BY COUNTRY, 2023–2030 (USD MILLION)
TABLE 57
IN SITU HYBRIDIZATION INSTRUMENTS MARKET, BY TYPE, 2023–2030 (USD MILLION)
TABLE 58
AUTOMATED IN SITU HYBRIDIZATION INSTRUMENTS MARKET, BY REGION, 2023–2030 (USD MILLION)
TABLE 59
NORTH AMERICA: AUTOMATED IN SITU HYBRIDIZATION INSTRUMENTS MARKET, BY COUNTRY, 2023–2030 (USD MILLION)
TABLE 60
EUROPE: AUTOMATED IN SITU HYBRIDIZATION INSTRUMENTS MARKET, BY COUNTRY, 2023–2030 (USD MILLION)
TABLE 61
ASIA PACIFIC: AUTOMATED IN SITU HYBRIDIZATION INSTRUMENTS MARKET, BY COUNTRY, 2023–2030 (USD MILLION)
TABLE 62
LATIN AMERICA: AUTOMATED IN SITU HYBRIDIZATION INSTRUMENTS MARKET, BY COUNTRY, 2023–2030 (USD MILLION)
TABLE 63
MIDDLE EAST: AUTOMATED IN SITU HYBRIDIZATION INSTRUMENTS MARKET, BY REGION, 2023–2030 (USD MILLION)
TABLE 64
GCC COUNTRIES: AUTOMATED IN SITU HYBRIDIZATION INSTRUMENTS MARKET, BY COUNTRY, 2023–2030 (USD MILLION)
TABLE 65
MANUAL IN SITU HYBRIDIZATION INSTRUMENTS MARKET, BY REGION, 2023–2030 (USD MILLION)
TABLE 66
NORTH AMERICA: MANUAL IN SITU HYBRIDIZATION INSTRUMENTS MARKET, BY COUNTRY, 2023–2030 (USD MILLION)
TABLE 67
EUROPE: MANUAL IN SITU HYBRIDIZATION INSTRUMENTS MARKET, BY COUNTRY, 2023–2030 (USD MILLION)
TABLE 68
ASIA PACIFIC: MANUAL IN SITU HYBRIDIZATION INSTRUMENTS MARKET, BY COUNTRY, 2023–2030 (USD MILLION)
TABLE 69
LATIN AMERICA: MANUAL IN SITU HYBRIDIZATION INSTRUMENTS MARKET, BY COUNTRY, 2023–2030 (USD MILLION)
TABLE 70
MIDDLE EAST: MANUAL IN SITU HYBRIDIZATION INSTRUMENTS MARKET, BY REGION, 2023–2030 (USD MILLION)
TABLE 71
GCC COUNTRIES: MANUAL IN SITU HYBRIDIZATION INSTRUMENTS MARKET, BY COUNTRY, 2023–2030 (USD MILLION)
TABLE 72
IN SITU HYBRIDIZATION SOFTWARE MARKET, BY REGION, 2023–2030 (USD MILLION)
TABLE 73
NORTH AMERICA: IN SITU HYBRIDIZATION SOFTWARE MARKET, BY COUNTRY, 2023–2030 (USD MILLION)
TABLE 74
EUROPE: IN SITU HYBRIDIZATION SOFTWARE MARKET, BY COUNTRY, 2023–2030 (USD MILLION)
TABLE 75
ASIA PACIFIC: IN SITU HYBRIDIZATION SOFTWARE MARKET, BY COUNTRY, 2023–2030 (USD MILLION)
TABLE 76
LATIN AMERICA: IN SITU HYBRIDIZATION SOFTWARE MARKET, BY COUNTRY, 2023–2030 (USD MILLION)
TABLE 77
MIDDLE EAST: IN SITU HYBRIDIZATION SOFTWARE MARKET, BY REGION, 2023–2030 (USD MILLION)
TABLE 78
GCC COUNTRIES: IN SITU HYBRIDIZATION SOFTWARE MARKET, BY COUNTRY, 2023–2030 (USD MILLION)
TABLE 79
IN SITU HYBRIDIZATION SERVICES MARKET, BY REGION, 2023–2030 (USD MILLION)
TABLE 80
NORTH AMERICA: IN SITU HYBRIDIZATION SERVICES MARKET, BY COUNTRY, 2023–2030 (USD MILLION)
TABLE 81
EUROPE: IN SITU HYBRIDIZATION SERVICES MARKET, BY COUNTRY, 2023–2030 (USD MILLION)
TABLE 82
ASIA PACIFIC: IN SITU HYBRIDIZATION SERVICES MARKET, BY COUNTRY, 2023–2030 (USD MILLION)
TABLE 83
LATIN AMERICA: IN SITU HYBRIDIZATION SERVICES MARKET, BY COUNTRY, 2023–2030 (USD MILLION)
TABLE 84
MIDDLE EAST: IN SITU HYBRIDIZATION SERVICES MARKET, BY REGION, 2023–2030 (USD MILLION)
TABLE 85
GCC COUNTRIES: IN SITU HYBRIDIZATION SERVICES MARKET, BY COUNTRY, 2023–2030 (USD MILLION)
TABLE 86
IN SITU HYBRIDIZATION SERVICES MARKET, BY TYPE, 2023–2030 (USD MILLION)
TABLE 87
DATA INTERPRETATION SERVICES MARKET, BY REGION, 2023–2030 (USD MILLION)
TABLE 88
NORTH AMERICA: DATA INTERPRETATION SERVICES MARKET, BY COUNTRY, 2023–2030 (USD MILLION)
TABLE 89
EUROPE: DATA INTERPRETATION SERVICES MARKET, BY COUNTRY, 2023–2030 (USD MILLION)
TABLE 90
ASIA PACIFIC: DATA INTERPRETATION SERVICES MARKET, BY COUNTRY, 2023–2030 (USD MILLION)
TABLE 91
LATIN AMERICA: DATA INTERPRETATION SERVICES MARKET, BY COUNTRY, 2023–2030 (USD MILLION)
TABLE 92
MIDDLE EAST: DATA INTERPRETATION SERVICES MARKET, BY REGION, 2023–2030 (USD MILLION)
TABLE 93
GCC COUNTRIES: DATA INTERPRETATION SERVICES MARKET, BY COUNTRY, 2023–2030 (USD MILLION)
TABLE 94
CUSTOM PROBE DESIGN SERVICES MARKET, BY REGION, 2023–2030 (USD MILLION)
TABLE 95
NORTH AMERICA: CUSTOM PROBE DESIGN SERVICES MARKET, BY COUNTRY, 2023–2030 (USD MILLION)
TABLE 96
EUROPE: CUSTOM PROBE DESIGN SERVICES MARKET, BY COUNTRY, 2023–2030 (USD MILLION)
TABLE 97
ASIA PACIFIC: CUSTOM PROBE DESIGN SERVICES MARKET, BY COUNTRY, 2023–2030 (USD MILLION)
TABLE 98
LATIN AMERICA: CUSTOM PROBE DESIGN SERVICES MARKET, BY COUNTRY, 2023–2030 (USD MILLION)
TABLE 99
MIDDLE EAST: CUSTOM PROBE DESIGN SERVICES MARKET, BY REGION, 2023–2030 (USD MILLION)
TABLE 100
GCC COUNTRES: CUSTOM PROBE DESIGN SERVICES MARKET, BY COUNTRY, 2023–2030 (USD MILLION)
TABLE 101
IN SITU HYBRIDIZATION MARKET, BY TECHNOLOGY, 2023–2030 (USD MILLION)
TABLE 102
FLUORESCENCE IN SITU HYBRIDIZATION (FISH) MARKET, BY REGION, 2023–2030 (USD MILLION)
TABLE 103
NORTH AMERICA: FLUORESCENCE IN SITU HYBRIDIZATION (FISH) MARKET, BY COUNTRY, 2023–2030 (USD MILLION)
TABLE 104
EUROPE: FLUORESCENCE IN SITU HYBRIDIZATION (FISH) MARKET, BY COUNTRY, 2023–2030 (USD MILLION)
TABLE 105
ASIA PACIFIC: FLUORESCENCE IN SITU HYBRIDIZATION (FISH) MARKET, BY COUNTRY, 2023–2030 (USD MILLION)
TABLE 106
LATIN AMERICA: FLUORESCENCE IN SITU HYBRIDIZATION (FISH) MARKET, BY COUNTRY, 2023–2030 (USD MILLION)
TABLE 107
MIDDLE EAST: FLUORESCENCE IN SITU HYBRIDIZATION (FISH) MARKET, BY REGION, 2023–2030 (USD MILLION)
TABLE 108
GCC COUNTRIES: FLUORESCENCE IN SITU HYBRIDIZATION (FISH) MARKET, BY COUNTRY, 2023–2030 (USD MILLION)
TABLE 109
FLUORESCENCE IN SITU HYBRIDIZATION (FISH) MARKET, BY TYPE, 2023–2030 (USD MILLION)
TABLE 110
DNA FLUORESCENCE IN SITU HYBRIDIZATION (DNA-FISH) MARKET, BY REGION, 2023–2030 (USD MILLION)
TABLE 111
NORTH AMERICA: DNA FLUORESCENCE IN SITU HYBRIDIZATION (DNA-FISH) MARKET, BY COUNTRY, 2023–2030 (USD MILLION)
TABLE 112
EUROPE: DNA FLUORESCENCE IN SITU HYBRIDIZATION (DNA-FISH) MARKET, BY COUNTRY, 2023–2030 (USD MILLION)
TABLE 113
ASIA PACIFIC: DNA FLUORESCENCE IN SITU HYBRIDIZATION (DNA-FISH) MARKET, BY COUNTRY, 2023–2030 (USD MILLION)
TABLE 114
LATIN AMERICA: DNA FLUORESCENCE IN SITU HYBRIDIZATION (DNA-FISH) MARKET, BY COUNTRY, 2023–2030 (USD MILLION)
TABLE 115
MIDDLE EAST: DNA FLUORESCENCE IN SITU HYBRIDIZATION (DNA-FISH) MARKET, BY REGION, 2023–2030 (USD MILLION)
TABLE 116
GCC COUNTRIES: DNA FLUORESCENCE IN SITU HYBRIDIZATION (DNA-FISH) MARKET, BY COUNTRY, 2023–2030 (USD MILLION)
TABLE 117
RNA FLUORESCENCE IN SITU HYBRIDIZATION (RNA-FISH) MARKET, BY REGION, 2023–2030 (USD MILLION)
TABLE 118
NORTH AMERICA: RNA FLUORESCENCE IN SITU HYBRIDIZATION (RNA-FISH) MARKET, BY COUNTRY, 2023–2030 (USD MILLION)
TABLE 119
EUROPE: RNA FLUORESCENCE IN SITU HYBRIDIZATION (RNA-FISH) MARKET, BY COUNTRY, 2023–2030 (USD MILLION)
TABLE 120
ASIA PACIFIC: RNA FLUORESCENCE IN SITU HYBRIDIZATION (RNA-FISH) MARKET, BY COUNTRY, 2023–2030 (USD MILLION)
TABLE 121
LATIN AMERICA: RNA FLUORESCENCE IN SITU HYBRIDIZATION (RNA-FISH) MARKET, BY COUNTRY, 2023–2030 (USD MILLION)
TABLE 122
MIDDLE EAST: RNA FLUORESCENCE IN SITU HYBRIDIZATION (RNA-FISH) MARKET, BY REGION, 2023–2030 (USD MILLION)
TABLE 123
GCC COUNTRIES: RNA FLUORESCENCE IN SITU HYBRIDIZATION (RNA-FISH) MARKET, BY COUNTRY, 2023–2030 (USD MILLION)
TABLE 124
PNA FLUORESCENCE IN SITU HYBRIDIZATION (PNA-FISH) MARKET, BY REGION, 2023–2030 (USD MILLION)
TABLE 125
NORTH AMERICA: PNA FLUORESCENCE IN SITU HYBRIDIZATION (PNA-FISH) MARKET, BY COUNTRY, 2023–2030 (USD MILLION)
TABLE 126
EUROPE: PNA FLUORESCENCE IN SITU HYBRIDIZATION (PNA-FISH) MARKET, BY COUNTRY, 2023–2030 (USD MILLION)
TABLE 127
ASIA PACIFIC: PNA FLUORESCENCE IN SITU HYBRIDIZATION (PNA-FISH) MARKET, BY COUNTRY, 2023–2030 (USD MILLION)
TABLE 128
LATIN AMERICA: PNA FLUORESCENCE IN SITU HYBRIDIZATION (PNA-FISH) MARKET, BY COUNTRY, 2023–2030 (USD MILLION)
TABLE 129
MIDDLE EAST: PNA FLUORESCENCE IN SITU HYBRIDIZATION (PNA-FISH) MARKET, BY REGION, 2023–2030 (USD MILLION)
TABLE 130
GCC COUNTRIES: PNA FLUORESCENCE IN SITU HYBRIDIZATION (PNA-FISH) MARKET, BY COUNTRY, 2023–2030 (USD MILLION)
TABLE 131
CHROMOGENIC IN SITU HYBRIDIZATION (CISH) MARKET, BY REGION, 2023–2030 (USD MILLION)
TABLE 132
NORTH AMERICA: CHROMOGENIC IN SITU HYBRIDIZATION (CISH) MARKET, BY COUNTRY, 2023–2030 (USD MILLION)
TABLE 133
EUROPE: CHROMOGENIC IN SITU HYBRIDIZATION (CISH) MARKET, BY COUNTRY, 2023–2030 (USD MILLION)
TABLE 134
ASIA PACIFIC: CHROMOGENIC IN SITU HYBRIDIZATION (CISH) MARKET, BY COUNTRY, 2023–2030 (USD MILLION)
TABLE 135
LATIN AMERICA: CHROMOGENIC IN SITU HYBRIDIZATION (CISH) MARKET, BY COUNTRY, 2023–2030 (USD MILLION)
TABLE 136
MIDDLE EAST: CHROMOGENIC IN SITU HYBRIDIZATION (CISH) MARKET, BY REGION, 2023–2030 (USD MILLION)
TABLE 137
GCC COUNTRIES: CHROMOGENIC IN SITU HYBRIDIZATION (CISH) MARKET, BY COUNTRY, 2023–2030 (USD MILLION)
TABLE 138
IN SITU HYBRIDIZATION MARKET, BY APPLICATION, 2023–2030 (USD MILLION)
TABLE 139
IN SITU HYBRIDIZATION MARKET FOR CLINICAL DIAGNOSTIC APPLICATIONS, BY REGION, 2023–2030 (USD MILLION)
TABLE 140
NORTH AMERICA: IN SITU HYBRIDIZATION MARKET FOR CLINICAL DIAGNOSTIC APPLICATIONS, BY COUNTRY, 2023–2030 (USD MILLION)
TABLE 141
EUROPE: IN SITU HYBRIDIZATION MARKET FOR CLINICAL DIAGNOSTIC APPLICATIONS, BY COUNTRY, 2023–2030 (USD MILLION)
TABLE 142
ASIA PACIFIC: IN SITU HYBRIDIZATION MARKET FOR CLINICAL DIAGNOSTIC APPLICATIONS, BY COUNTRY, 2023–2030 (USD MILLION)
TABLE 143
LATIN AMERICA: IN SITU HYBRIDIZATION MARKET FOR CLINICAL DIAGNOSTIC APPLICATIONS, BY COUNTRY, 2023–2030 (USD MILLION)
TABLE 144
MIDDLE EAST: IN SITU HYBRIDIZATION MARKET FOR CLINICAL DIAGNOSTIC APPLICATIONS, BY REGION, 2023–2030 (USD MILLION)
TABLE 145
GCC COUNTRIES: IN SITU HYBRIDIZATION MARKET FOR CLINICAL DIAGNOSTIC APPLICATIONS, BY COUNTRY, 2023–2030 (USD MILLION)
TABLE 146
IN SITU HYBRIDIZATION MARKET FOR CLINICAL DIAGNOSTIC APPLICATIONS, BY TYPE, 2023–2030 (USD MILLION)
TABLE 147
CANCER DIAGNOSTICS MARKET, BY REGION, 2023–2030 (USD MILLION)
TABLE 148
NORTH AMERICA: CANCER DIAGNOSTICS MARKET, BY COUNTRY, 2023–2030 (USD MILLION)
TABLE 149
EUROPE: CANCER DIAGNOSTICS MARKET, BY COUNTRY, 2023–2030 (USD MILLION)
TABLE 150
ASIA PACIFIC: CANCER DIAGNOSTICS MARKET, BY COUNTRY, 2023–2030 (USD MILLION)
TABLE 151
LATIN AMERICA: CANCER DIAGNOSTICS MARKET, BY COUNTRY, 2023–2030 (USD MILLION)
TABLE 152
MIDDLE EAST: CANCER DIAGNOSTICS MARKET, BY REGION, 2023–2030 (USD MILLION)
TABLE 153
GCC COUNTRIES: CANCER DIAGNOSTICS MARKET, BY COUNTRY, 2023–2030 (USD MILLION)
TABLE 154
INFECTIOUS DISEASE DIAGNOTICS MARKET, BY REGION, 2023–2030 (USD MILLION)
TABLE 155
NORTH AMERICA: INFECTIOUS DISEASE DIAGNOTICS MARKET, BY COUNTRY, 2023–2030 (USD MILLION)
TABLE 156
EUROPE: INFECTIOUS DISEASE DIAGNOTICS MARKET, BY COUNTRY, 2023–2030 (USD MILLION)
TABLE 157
ASIA PACIFIC: INFECTIOUS DISEASE DIAGNOTICS MARKET, BY COUNTRY, 2023–2030 (USD MILLION)
TABLE 158
LATIN AMERICA: INFECTIOUS DISEASE DIAGNOTICS MARKET, BY COUNTRY, 2023–2030 (USD MILLION)
TABLE 159
MIDDLE EAST: INFECTIOUS DISEASE DIAGNOTICS MARKET, BY REGION, 2023–2030 (USD MILLION)
TABLE 160
GCC COUNTRIES: INFECTIOUS DISEASE DIAGNOTICS MARKET, BY COUNTRY, 2023–2030 (USD MILLION)
TABLE 161
GENETIC DISEASE DIAGNOSTICS MARKET, BY REGION, 2023–2030 (USD MILLION)
TABLE 162
NORTH AMERICA: GENETIC DISEASE DIAGNOSTICS MARKET, BY COUNTRY, 2023–2030 (USD MILLION)
TABLE 163
EUROPE: GENETIC DISEASE DIAGNOSTICS MARKET, BY COUNTRY, 2023–2030 (USD MILLION)
TABLE 164
ASIA PACIFIC: GENETIC DISEASE DIAGNOSTICS MARKET, BY COUNTRY, 2023–2030 (USD MILLION)
TABLE 165
LATIN AMERICA: GENETIC DISEASE DIAGNOSTICS MARKET, BY COUNTRY, 2023–2030 (USD MILLION)
TABLE 166
MIDDLE EAST: GENETIC DISEASE DIAGNOSTICS MARKET, BY REGION, 2023–2030 (USD MILLION)
TABLE 167
GCC COUNTRIES: GENETIC DISEASE DIAGNOSTICS MARKET, BY COUNTRY, 2023–2030 (USD MILLION)
TABLE 168
OTHER CLINCAL DIAGNOSTIC APPLICATIONS MARKET, BY REGION, 2023–2030 (USD MILLION)
TABLE 169
NORTH AMERICA: OTHER CLINCAL DIAGNOSTIC APPLICATIONS MARKET, BY COUNTRY, 2023–2030 (USD MILLION)
TABLE 170
EUROPE: OTHER CLINCAL DIAGNOSTIC APPLICATIONS MARKET, BY COUNTRY, 2023–2030 (USD MILLION)
TABLE 171
ASIA PACIFIC: OTHER CLINCAL DIAGNOSTIC APPLICATIONS MARKET, BY COUNTRY, 2023–2030 (USD MILLION)
TABLE 172
LATIN AMERICA: OTHER CLINCAL DIAGNOSTIC APPLICATIONS MARKET, BY COUNTRY, 2023–2030 (USD MILLION)
TABLE 173
MIDDLE EAST: OTHER CLINCAL DIAGNOSTIC APPLICATIONS MARKET, BY REGION, 2023–2030 (USD MILLION)
TABLE 174
GCC COUNTRIES: OTHER CLINCAL DIAGNOSTIC APPLICATIONS MARKET, BY COUNTRY, 2023–2030 (USD MILLION)
TABLE 175
IN SITU HYBRIDIZATION MARKET FOR RESEARCH APPLICATIONS, BY REGION, 2023–2030 (USD MILLION)
TABLE 176
NORTH AMERICA: IN SITU HYBRIDIZATION MARKET FOR RESEARCH APPLICATIONS, BY COUNTRY, 2023–2030 (USD MILLION)
TABLE 177
EUROPE: IN SITU HYBRIDIZATION MARKET FOR RESEARCH APPLICATIONS, BY COUNTRY, 2023–2030 (USD MILLION)
TABLE 178
ASIA PACIFIC: IN SITU HYBRIDIZATION MARKET FOR RESEARCH APPLICATIONS, BY COUNTRY, 2023–2030 (USD MILLION)
TABLE 179
LATIN AMERICA: IN SITU HYBRIDIZATION MARKET FOR RESEARCH APPLICATIONS, BY COUNTRY, 2023–2030 (USD MILLION)
TABLE 180
MIDDLE EAST: IN SITU HYBRIDIZATION MARKET FOR RESEARCH APPLICATIONS, BY REGION, 2023–2030 (USD MILLION)
TABLE 181
GCC COUNTRIES: IN SITU HYBRIDIZATION MARKET FOR RESEARCH APPLICATIONS, BY COUNTRY, 2023–2030 (USD MILLION)
TABLE 182
IN SITU HYBRIDIZATION MARKET FOR RESEARCH APPLICATIONS, BY TYPE, 2023–2030 (USD MILLION)
TABLE 183
NEUROSCIENCE RESEARCH MARKET, BY REGION, 2023–2030 (USD MILLION)
TABLE 184
NORTH AMERICA: NEUROSCIENCE RESEARCH MARKET, BY COUNTRY, 2023–2030 (USD MILLION)
TABLE 185
EUROPE: NEUROSCIENCE RESEARCH MARKET, BY COUNTRY, 2023–2030 (USD MILLION)
TABLE 186
ASIA PACIFIC: NEUROSCIENCE RESEARCH MARKET, BY COUNTRY, 2023–2030 (USD MILLION)
TABLE 187
LATIN AMERICA: NEUROSCIENCE RESEARCH MARKET, BY COUNTRY, 2023–2030 (USD MILLION)
TABLE 188
MIDDLE EAST: NEUROSCIENCE RESEARCH MARKET, BY REGION, 2023–2030 (USD MILLION)
TABLE 189
GCC COUNTRIES: NEUROSCIENCE RESEARCH MARKET, BY COUNTRY, 2023–2030 (USD MILLION)
TABLE 190
IMMUNOLOGY RESEARCH MARKET, BY REGION, 2023–2030 (USD MILLION)
TABLE 191
NORTH AMERICA: IMMUNOLOGY RESEARCH MARKET, BY COUNTRY, 2023–2030 (USD MILLION)
TABLE 192
EUROPE: IMMUNOLOGY RESEARCH MARKET, BY COUNTRY, 2023–2030 (USD MILLION)
TABLE 193
ASIA PACIFIC: IMMUNOLOGY RESEARCH MARKET, BY COUNTRY, 2023–2030 (USD MILLION)
TABLE 194
LATIN AMERICA: IMMUNOLOGY RESEARCH MARKET, BY COUNTRY, 2023–2030 (USD MILLION)
TABLE 195
MIDDLE EAST: IMMUNOLOGY RESEARCH MARKET, BY REGION, 2023–2030 (USD MILLION)
TABLE 196
GCC COUNTRIES: IMMUNOLOGY RESEARCH MARKET, BY COUNTRY, 2023–2030 (USD MILLION)
TABLE 197
OTHER RESEARCH APPLICATIONS MARKET, BY REGION, 2023–2030 (USD MILLION)
TABLE 198
NORTH AMERICA: OTHER RESEARCH APPLICATIONS MARKET, BY COUNTRY, 2023–2030 (USD MILLION)
TABLE 199
EUROPE: OTHER RESEARCH APPLICATIONS MARKET, BY COUNTRY, 2023–2030 (USD MILLION)
TABLE 200
ASIA PACIFIC: OTHER RESEARCH APPLICATIONS MARKET, BY COUNTRY, 2023–2030 (USD MILLION)
TABLE 201
LATIN AMERICA: OTHER RESEARCH APPLICATIONS MARKET, BY COUNTRY, 2023–2030 (USD MILLION)
TABLE 202
MIDDLE EAST: OTHER RESEARCH APPLICATIONS MARKET, BY REGION, 2023–2030 (USD MILLION)
TABLE 203
GCC COUNTRIES: OTHER RESEARCH APPLICATIONS MARKET, BY COUNTRY, 2023–2030 (USD MILLION)
TABLE 204
IN SITU HYBRIDIZATION MARKET FOR DRUG DISCOVERY & DEVELOPMENT, BY REGION, 2023–2030 (USD MILLION)
TABLE 205
NORTH AMERICA: IN SITU HYBRIDIZATION MARKET FOR DRUG DISCOVERY & DEVELOPMENT, BY COUNTRY, 2023–2030 (USD MILLION)
TABLE 206
EUROPE: IN SITU HYBRIDIZATION MARKET FOR DRUG DISCOVERY & DEVELOPMENT, BY COUNTRY, 2023–2030 (USD MILLION)
TABLE 207
ASIA PACIFIC: IN SITU HYBRIDIZATION MARKET FOR DRUG DISCOVERY & DEVELOPMENT, BY COUNTRY, 2023–2030 (USD MILLION)
TABLE 208
LATIN AMERICA: IN SITU HYBRIDIZATION MARKET FOR DRUG DISCOVERY & DEVELOPMENT, BY COUNTRY, 2023–2030 (USD MILLION)
TABLE 209
MIDDLE EAST: IN SITU HYBRIDIZATION MARKET FOR DRUG DISCOVERY & DEVELOPMENT, BY REGION, 2023–2030 (USD MILLION)
TABLE 210
GCC COUNTRIES: IN SITU HYBRIDIZATION MARKET FOR DRUG DISCOVERY & DEVELOPMENT, BY COUNTRY, 2023–2030 (USD MILLION)
TABLE 211
IN SITU HYBRIDIZATION MARKET, BY END USER, 2023–2030 (USD MILLION)
TABLE 212
IN SITU HYBRIDIZATION MARKET FOR HOSPITALS & DIAGNOSTIC LABORATORIES, BY REGION, 2023–2030 (USD MILLION)
TABLE 213
NORTH AMERICA: IN SITU HYBRIDIZATION MARKET FOR HOSPITALS & DIAGNOSTIC LABORATORIES, BY COUNTRY, 2023–2030 (USD MILLION)
TABLE 214
EUROPE: IN SITU HYBRIDIZATION MARKET FOR HOSPITALS & DIAGNOSTIC LABORATORIES, BY COUNTRY, 2023–2030 (USD MILLION)
TABLE 215
ASIA PACIFIC: IN SITU HYBRIDIZATION MARKET FOR HOSPITALS & DIAGNOSTIC LABORATORIES, BY COUNTRY, 2023–2030 (USD MILLION)
TABLE 216
LATIN AMERICA: IN SITU HYBRIDIZATION MARKET FOR HOSPITALS & DIAGNOSTIC LABORATORIES, BY COUNTRY, 2023–2030 (USD MILLION)
TABLE 217
MIDDLE EAST: IN SITU HYBRIDIZATION MARKET FOR HOSPITALS & DIAGNOSTIC LABORATORIES, BY REGION, 2023–2030 (USD MILLION)
TABLE 218
GCC COUNTRIES: IN SITU HYBRIDIZATION MARKET FOR HOSPITALS & DIAGNOSTIC LABORATORIES, BY COUNTRY, 2023–2030 (USD MILLION)
TABLE 219
IN SITU HYBRIDIZATION MARKET FOR ACADEMIC & RESEARCH INSTITUTES, BY REGION, 2023–2030 (USD MILLION)
TABLE 220
NORTH AMERICA: IN SITU HYBRIDIZATION MARKET FOR ACADEMIC & RESEARCH INSTITUTES, BY COUNTRY, 2023–2030 (USD MILLION)
TABLE 221
EUROPE: IN SITU HYBRIDIZATION MARKET FOR ACADEMIC & RESEARCH INSTITUTES, BY COUNTRY, 2023–2030 (USD MILLION)
TABLE 222
ASIA PACIFIC: IN SITU HYBRIDIZATION MARKET FOR ACADEMIC & RESEARCH INSTITUTES, BY COUNTRY, 2023–2030 (USD MILLION)
TABLE 223
LATIN AMERICA: IN SITU HYBRIDIZATION MARKET FOR ACADEMIC & RESEARCH INSTITUTES, BY COUNTRY, 2023–2030 (USD MILLION)
TABLE 224
MIDDLE EAST: IN SITU HYBRIDIZATION MARKET FOR ACADEMIC & RESEARCH INSTITUTES, BY REGION, 2023–2030 (USD MILLION)
TABLE 225
GCC COUNTRIES: IN SITU HYBRIDIZATION MARKET FOR ACADEMIC & RESEARCH INSTITUTES, BY COUNTRY, 2023–2030 (USD MILLION)
TABLE 226
IN SITU HYBRIDIZATION MARKET FOR PHARMACEUTICAL & BIOTECHNOLOGY COMPANIES, BY REGION, 2023–2030 (USD MILLION)
TABLE 227
NORTH AMERICA: IN SITU HYBRIDIZATION MARKET FOR PHARMACEUTICAL & BIOTECHNOLOGY COMPANIES, BY COUNTRY, 2023–2030 (USD MILLION)
TABLE 228
EUROPE: IN SITU HYBRIDIZATION MARKET FOR PHARMACEUTICAL & BIOTECHNOLOGY COMPANIES, BY COUNTRY, 2023–2030 (USD MILLION)
TABLE 229
ASIA PACIFIC: IN SITU HYBRIDIZATION MARKET FOR PHARMACEUTICAL & BIOTECHNOLOGY COMPANIES, BY COUNTRY, 2023–2030 (USD MILLION)
TABLE 230
LATIN AMERICA: IN SITU HYBRIDIZATION MARKET FOR PHARMACEUTICAL & BIOTECHNOLOGY COMPANIES, BY COUNTRY, 2023–2030 (USD MILLION)
TABLE 231
MIDDLE EAST: IN SITU HYBRIDIZATION MARKET FOR PHARMACEUTICAL & BIOTECHNOLOGY COMPANIES, BY REGION, 2023–2030 (USD MILLION)
TABLE 232
GCC COUNTRIES: IN SITU HYBRIDIZATION MARKET FOR PHARMACEUTICAL & BIOTECHNOLOGY COMPANIES, BY COUNTRY, 2023–2030 (USD MILLION)
TABLE 233
IN SITU HYBRIDIZATION MARKET FOR CONTRACT RESEARCH ORGANIZATIONS, BY REGION, 2023–2030 (USD MILLION)
TABLE 234
NORTH AMERICA: IN SITU HYBRIDIZATION MARKET FOR CONTRACT RESEARCH ORGANIZATIONS, BY COUNTRY, 2023–2030 (USD MILLION)
TABLE 235
EUROPE: IN SITU HYBRIDIZATION MARKET FOR CONTRACT RESEARCH ORGANIZATIONS, BY COUNTRY, 2023–2030 (USD MILLION)
TABLE 236
ASIA PACIFIC: IN SITU HYBRIDIZATION MARKET FOR CONTRACT RESEARCH ORGANIZATIONS, BY COUNTRY, 2023–2030 (USD MILLION)
TABLE 237
LATIN AMERICA: IN SITU HYBRIDIZATION MARKET FOR CONTRACT RESEARCH ORGANIZATIONS, BY COUNTRY, 2023–2030 (USD MILLION)
TABLE 238
MIDDLE EAST: IN SITU HYBRIDIZATION MARKET FOR CONTRACT RESEARCH ORGANIZATIONS, BY REGION, 2023–2030 (USD MILLION)
TABLE 239
GCC COUNTRIES: IN SITU HYBRIDIZATION MARKET FOR CONTRACT RESEARCH ORGANIZATIONS, BY COUNTRY, 2023–2030 (USD MILLION)
TABLE 240
IN SITU HYBRIDIZATION MARKET, BY REGION, 2023–2030 (USD MILLION)
TABLE 241
NORTH AMERICA: KEY MACROINDICATORS
TABLE 242
NORTH AMERICA: IN SITU HYBRIDIZATION MARKET, BY OFFERING, 2023–2030 (USD MILLION)
TABLE 243
NORTH AMERICA: IN SITU HYBRIDIZATION CONSUMABLES MARKET, BY TYPE, 2023–2030 (USD MILLION)
TABLE 244
NORTH AMERICA: IN SITU HYBRIDIZATION INSTRUMENTS MARKET, BY TYPE, 2023–2030 (USD MILLION)
TABLE 245
NORTH AMERICA: IN SITU HYBRIDIZATION SERVICES MARKET, BY TYPE, 2023–2030 (USD MILLION)
TABLE 246
NORTH AMERICA: IN SITU HYBRIDIZATION MARKET, BY TECHNOLOGY, 2023–2030 (USD MILLION)
TABLE 247
NORTH AMERICA: FLUORESCENCE IN SITU HYBRIDIZATION (FISH) MARKET, BY TYPE, 2023–2030 (USD MILLION)
TABLE 248
NORTH AMERICA: IN SITU HYBRIDIZATION MARKET, BY APPLICATION, 2023–2030 (USD MILLION)
TABLE 249
NORTH AMERICA: IN SITU HYBRIDIZATION MARKET FOR CLINICAL DIAGNOSTIC APPLICATIONS, BY TYPE, 2023–2030 (USD MILLION)
TABLE 250
NORTH AMERICA: IN SITU HYBRIDIZATION MARKET FOR RESEARCH APPLICATIONS, BY TYPE, 2023–2030 (USD MILLION)
TABLE 251
NORTH AMERICA: IN SITU HYBRIDIZATION MARKET, BY END USER, 2023–2030 (USD MILLION)
TABLE 252
NORTH AMERICA: IN SITU HYBRIDIZATION MARKET, BY COUNTRY, 2023–2030 (USD MILLION)
TABLE 253
US: IN SITU HYBRIDIZATION MARKET, BY OFFERING, 2023–2030 (USD MILLION)
TABLE 254
US: IN SITU HYBRIDIZATION CONSUMABLES MARKET, BY TYPE, 2023–2030 (USD MILLION)
TABLE 255
US: IN SITU HYBRIDIZATION INSTRUMENTS MARKET, BY TYPE, 2023–2030 (USD MILLION)
TABLE 256
US: IN SITU HYBRIDIZATION SERVICES MARKET, BY TYPE, 2023–2030 (USD MILLION)
TABLE 257
US: IN SITU HYBRIDIZATION MARKET, BY TECHNOLOGY, 2023–2030 (USD MILLION)
TABLE 258
US: FLUORESCENCE IN SITU HYBRIDIZATION (FISH) MARKET, BY TYPE, 2023–2030 (USD MILLION)
TABLE 259
US: IN SITU HYBRIDIZATION MARKET, BY APPLICATION, 2023–2030 (USD MILLION)
TABLE 260
US: IN SITU HYBRIDIZATION MARKET FOR CLINICAL DIAGNOSTIC APPLICATIONS, BY TYPE, 2023–2030 (USD MILLION)
TABLE 261
US: IN SITU HYBRIDIZATION MARKET FOR RESEARCH APPLICATIONS, BY TYPE, 2023–2030 (USD MILLION)
TABLE 262
US: IN SITU HYBRIDIZATION MARKET, BY END USER, 2023–2030 (USD MILLION)
TABLE 263
CANADA: IN SITU HYBRIDIZATION MARKET, BY OFFERING, 2023–2030 (USD MILLION)
TABLE 264
CANADA: IN SITU HYBRIDIZATION CONSUMABLES MARKET, BY TYPE, 2023–2030 (USD MILLION)
TABLE 265
CANADA: IN SITU HYBRIDIZATION INSTRUMENTS MARKET, BY TYPE, 2023–2030 (USD MILLION)
TABLE 266
CANADA: IN SITU HYBRIDIZATION SERVICES MARKET, BY TYPE, 2023–2030 (USD MILLION)
TABLE 267
CANADA: IN SITU HYBRIDIZATION MARKET, BY TECHNOLOGY, 2023–2030 (USD MILLION)
TABLE 268
CANADA: FLUORESCENCE IN SITU HYBRIDIZATION (FISH) MARKET, BY TYPE, 2023–2030 (USD MILLION)
TABLE 269
CANADA: IN SITU HYBRIDIZATION MARKET, BY APPLICATION, 2023–2030 (USD MILLION)
TABLE 270
CANADA: IN SITU HYBRIDIZATION MARKET FOR CLINICAL DIAGNOSTIC APPLICATIONS, BY TYPE, 2023–2030 (USD MILLION)
TABLE 271
CANADA: IN SITU HYBRIDIZATION MARKET FOR RESEARCH APPLICATIONS, BY TYPE, 2023–2030 (USD MILLION)
TABLE 272
CANADA: IN SITU HYBRIDIZATION MARKET, BY END USER, 2023–2030 (USD MILLION)
TABLE 273
EUROPE: KEY MACROINDICATORS
TABLE 274
EUROPE: IN SITU HYBRIDIZATION MARKET, BY OFFERING, 2023–2030 (USD MILLION)
TABLE 275
EUROPE: IN SITU HYBRIDIZATION CONSUMABLES MARKET, BY TYPE, 2023–2030 (USD MILLION)
TABLE 276
EUROPE: IN SITU HYBRIDIZATION INSTRUMENTS MARKET, BY TYPE, 2023–2030 (USD MILLION)
TABLE 277
EUROPE: IN SITU HYBRIDIZATION SERVICES MARKET, BY TYPE, 2023–2030 (USD MILLION)
TABLE 278
EUROPE: IN SITU HYBRIDIZATION MARKET, BY TECHNOLOGY, 2023–2030 (USD MILLION)
TABLE 279
EUROPE: FLUORESCENCE IN SITU HYBRIDIZATION (FISH) MARKET, BY TYPE, 2023–2030 (USD MILLION)
TABLE 280
EUROPE: IN SITU HYBRIDIZATION MARKET, BY APPLICATION, 2023–2030 (USD MILLION)
TABLE 281
EUROPE: IN SITU HYBRIDIZATION MARKET FOR CLINICAL DIAGNOSTIC APPLICATIONS, BY TYPE, 2023–2030 (USD MILLION)
TABLE 282
EUROPE: IN SITU HYBRIDIZATION MARKET FOR RESEARCH APPLICATIONS, BY TYPE, 2023–2030 (USD MILLION)
TABLE 283
EUROPE: IN SITU HYBRIDIZATION MARKET, BY END USER, 2023–2030 (USD MILLION)
TABLE 284
EUROPE: IN SITU HYBRIDIZATION MARKET, BY COUNTRY, 2023–2030 (USD MILLION)
TABLE 285
GERMANY: IN SITU HYBRIDIZATION MARKET, BY OFFERING, 2023–2030 (USD MILLION)
TABLE 286
GERMANY: IN SITU HYBRIDIZATION CONSUMABLES MARKET, BY TYPE, 2023–2030 (USD MILLION)
TABLE 287
GERMANY: IN SITU HYBRIDIZATION INSTRUMENTS MARKET, BY TYPE, 2023–2030 (USD MILLION)
TABLE 288
GERMANY: IN SITU HYBRIDIZATION SERVICES MARKET, BY TYPE, 2023–2030 (USD MILLION)
TABLE 289
GERMANY: IN SITU HYBRIDIZATION MARKET, BY TECHNOLOGY, 2023–2030 (USD MILLION)
TABLE 290
GERMANY: FLUORESCENCE IN SITU HYBRIDIZATION (FISH) MARKET, BY TYPE, 2023–2030 (USD MILLION)
TABLE 291
GERMANY: IN SITU HYBRIDIZATION MARKET, BY APPLICATION, 2023–2030 (USD MILLION)
TABLE 292
GERMANY: IN SITU HYBRIDIZATION MARKET FOR CLINICAL DIAGNOSTIC APPLICATIONS, BY TYPE, 2023–2030 (USD MILLION)
TABLE 293
GERMANY: IN SITU HYBRIDIZATION MARKET FOR RESEARCH APPLICATIONS, BY TYPE, 2023–2030 (USD MILLION)
TABLE 294
GERMANY: IN SITU HYBRIDIZATION MARKET, BY END USER, 2023–2030 (USD MILLION)
TABLE 295
UK: IN SITU HYBRIDIZATION MARKET, BY OFFERING, 2023–2030 (USD MILLION)
TABLE 296
UK: IN SITU HYBRIDIZATION CONSUMABLES MARKET, BY TYPE, 2023–2030 (USD MILLION)
TABLE 297
UK: IN SITU HYBRIDIZATION INSTRUMENTS MARKET, BY TYPE, 2023–2030 (USD MILLION)
TABLE 298
UK: IN SITU HYBRIDIZATION SERVICES MARKET, BY TYPE, 2023–2030 (USD MILLION)
TABLE 299
UK: IN SITU HYBRIDIZATION MARKET, BY TECHNOLOGY, 2023–2030 (USD MILLION)
TABLE 300
UK: FLUORESCENCE IN SITU HYBRIDIZATION (FISH) MARKET, BY TYPE, 2023–2030 (USD MILLION)
TABLE 301
UK: IN SITU HYBRIDIZATION MARKET, BY APPLICATION, 2023–2030 (USD MILLION)
TABLE 302
UK: IN SITU HYBRIDIZATION MARKET FOR CLINICAL DIAGNOSTIC APPLICATIONS, BY TYPE, 2023–2030 (USD MILLION)
TABLE 303
UK: IN SITU HYBRIDIZATION MARKET FOR RESEARCH APPLICATIONS, BY TYPE, 2023–2030 (USD MILLION)
TABLE 304
UK: IN SITU HYBRIDIZATION MARKET, BY END USER, 2023–2030 (USD MILLION)
TABLE 305
FRANCE: IN SITU HYBRIDIZATION MARKET, BY OFFERING, 2023–2030 (USD MILLION)
TABLE 306
FRANCE: IN SITU HYBRIDIZATION CONSUMABLES MARKET, BY TYPE, 2023–2030 (USD MILLION)
TABLE 307
FRANCE: IN SITU HYBRIDIZATION INSTRUMENTS MARKET, BY TYPE, 2023–2030 (USD MILLION)
TABLE 308
FRANCE: IN SITU HYBRIDIZATION SERVICES MARKET, BY TYPE, 2023–2030 (USD MILLION)
TABLE 309
FRANCE: IN SITU HYBRIDIZATION MARKET, BY TECHNOLOGY, 2023–2030 (USD MILLION)
TABLE 310
FRANCE: FLUORESCENCE IN SITU HYBRIDIZATION (FISH) MARKET, BY TYPE, 2023–2030 (USD MILLION)
TABLE 311
FRANCE: IN SITU HYBRIDIZATION MARKET, BY APPLICATION, 2023–2030 (USD MILLION)
TABLE 312
FRANCE: IN SITU HYBRIDIZATION MARKET FOR CLINICAL DIAGNOSTIC APPLICATIONS, BY TYPE, 2023–2030 (USD MILLION)
TABLE 313
FRANCE: IN SITU HYBRIDIZATION MARKET FOR RESEARCH APPLICATIONS, BY TYPE, 2023–2030 (USD MILLION)
TABLE 314
FRANCE: IN SITU HYBRIDIZATION MARKET, BY END USER, 2023–2030 (USD MILLION)
TABLE 315
ITALY: IN SITU HYBRIDIZATION MARKET, BY OFFERING, 2023–2030 (USD MILLION)
TABLE 316
ITALY: IN SITU HYBRIDIZATION CONSUMABLES MARKET, BY TYPE, 2023–2030 (USD MILLION)
TABLE 317
ITALY: IN SITU HYBRIDIZATION INSTRUMENTS MARKET, BY TYPE, 2023–2030 (USD MILLION)
TABLE 318
ITALY: IN SITU HYBRIDIZATION SERVICES MARKET, BY TYPE, 2023–2030 (USD MILLION)
TABLE 319
ITALY: IN SITU HYBRIDIZATION MARKET, BY TECHNOLOGY, 2023–2030 (USD MILLION)
TABLE 320
ITALY: FLUORESCENCE IN SITU HYBRIDIZATION (FISH) MARKET, BY TYPE, 2023–2030 (USD MILLION)
TABLE 321
ITALY: IN SITU HYBRIDIZATION MARKET, BY APPLICATION, 2023–2030 (USD MILLION)
TABLE 322
ITALY: IN SITU HYBRIDIZATION MARKET FOR CLINICAL DIAGNOSTIC APPLICATIONS, BY TYPE, 2023–2030 (USD MILLION)
TABLE 323
ITALY: IN SITU HYBRIDIZATION MARKET FOR RESEARCH APPLICATIONS, BY TYPE, 2023–2030 (USD MILLION)
TABLE 324
ITALY: IN SITU HYBRIDIZATION MARKET, BY END USER, 2023–2030 (USD MILLION)
TABLE 325
SPAIN: IN SITU HYBRIDIZATION MARKET, BY OFFERING, 2023–2030 (USD MILLION)
TABLE 326
SPAIN: IN SITU HYBRIDIZATION CONSUMABLES MARKET, BY TYPE, 2023–2030 (USD MILLION)
TABLE 327
SPAIN: IN SITU HYBRIDIZATION INSTRUMENTS MARKET, BY TYPE, 2023–2030 (USD MILLION)
TABLE 328
SPAIN: IN SITU HYBRIDIZATION SERVICES MARKET, BY TYPE, 2023–2030 (USD MILLION)
TABLE 329
SPAIN: IN SITU HYBRIDIZATION MARKET, BY TECHNOLOGY, 2023–2030 (USD MILLION)
TABLE 330
SPAIN: FLUORESCENCE IN SITU HYBRIDIZATION (FISH) MARKET, BY TYPE, 2023–2030 (USD MILLION)
TABLE 331
SPAIN: IN SITU HYBRIDIZATION MARKET, BY APPLICATION, 2023–2030 (USD MILLION)
TABLE 332
SPAIN: IN SITU HYBRIDIZATION MARKET FOR CLINICAL DIAGNOSTIC APPLICATIONS, BY TYPE, 2023–2030 (USD MILLION)
TABLE 333
SPAIN: IN SITU HYBRIDIZATION MARKET FOR RESEARCH APPLICATIONS, BY TYPE, 2023–2030 (USD MILLION)
TABLE 334
SPAIN: IN SITU HYBRIDIZATION MARKET, BY END USER, 2023–2030 (USD MILLION)
TABLE 335
REST OF EUROPE: IN SITU HYBRIDIZATION MARKET, BY OFFERING, 2023–2030 (USD MILLION)
TABLE 336
REST OF EUROPE: IN SITU HYBRIDIZATION CONSUMABLES MARKET, BY TYPE, 2023–2030 (USD MILLION)
TABLE 337
REST OF EUROPE: IN SITU HYBRIDIZATION INSTRUMENTS MARKET, BY TYPE, 2023–2030 (USD MILLION)
TABLE 338
REST OF EUROPE: IN SITU HYBRIDIZATION SERVICES MARKET, BY TYPE, 2023–2030 (USD MILLION)
TABLE 339
REST OF EUROPE: IN SITU HYBRIDIZATION MARKET, BY TECHNOLOGY, 2023–2030 (USD MILLION)
TABLE 340
REST OF EUROPE: FLUORESCENCE IN SITU HYBRIDIZATION (FISH) MARKET, BY TYPE, 2023–2030 (USD MILLION)
TABLE 341
REST OF EUROPE: IN SITU HYBRIDIZATION MARKET, BY APPLICATION, 2023–2030 (USD MILLION)
TABLE 342
REST OF EUROPE: IN SITU HYBRIDIZATION MARKET FOR CLINICAL DIAGNOSTIC APPLICATIONS, BY TYPE, 2023–2030 (USD MILLION)
TABLE 343
REST OF EUROPE: IN SITU HYBRIDIZATION MARKET FOR RESEARCH APPLICATIONS, BY TYPE, 2023–2030 (USD MILLION)
TABLE 344
REST OF EUROPE: IN SITU HYBRIDIZATION MARKET, BY END USER, 2023–2030 (USD MILLION)
TABLE 345
ASIA PACIFIC: KEY MACROINDICATORS
TABLE 346
ASIA PACIFIC: IN SITU HYBRIDIZATION MARKET, BY OFFERING, 2023–2030 (USD MILLION)
TABLE 347
ASIA PACIFIC: IN SITU HYBRIDIZATION CONSUMABLES MARKET, BY TYPE, 2023–2030 (USD MILLION)
TABLE 348
ASIA PACIFIC: IN SITU HYBRIDIZATION INSTRUMENTS MARKET, BY TYPE, 2023–2030 (USD MILLION)
TABLE 349
ASIA PACIFIC: IN SITU HYBRIDIZATION SERVICES MARKET, BY TYPE, 2023–2030 (USD MILLION)
TABLE 350
ASIA PACIFIC: IN SITU HYBRIDIZATION MARKET, BY TECHNOLOGY, 2023–2030 (USD MILLION)
TABLE 351
ASIA PACIFIC: FLUORESCENCE IN SITU HYBRIDIZATION (FISH) MARKET, BY TYPE, 2023–2030 (USD MILLION)
TABLE 352
ASIA PACIFIC: IN SITU HYBRIDIZATION MARKET, BY APPLICATION, 2023–2030 (USD MILLION)
TABLE 353
ASIA PACIFIC: IN SITU HYBRIDIZATION MARKET FOR CLINICAL DIAGNOSTIC APPLICATIONS, BY TYPE, 2023–2030 (USD MILLION)
TABLE 354
ASIA PACIFIC: IN SITU HYBRIDIZATION MARKET FOR RESEARCH APPLICATIONS, BY TYPE, 2023–2030 (USD MILLION)
TABLE 355
ASIA PACIFIC: IN SITU HYBRIDIZATION MARKET, BY END USER, 2023–2030 (USD MILLION)
TABLE 356
ASIA PACIFIC: IN SITU HYBRIDIZATION MARKET, BY COUNTRY, 2023–2030 (USD MILLION)
TABLE 357
CHINA: IN SITU HYBRIDIZATION MARKET, BY OFFERING, 2023–2030 (USD MILLION)
TABLE 358
CHINA: IN SITU HYBRIDIZATION CONSUMABLES MARKET, BY TYPE, 2023–2030 (USD MILLION)
TABLE 359
CHINA: IN SITU HYBRIDIZATION INSTRUMENTS MARKET, BY TYPE, 2023–2030 (USD MILLION)
TABLE 360
CHINA: IN SITU HYBRIDIZATION SERVICES MARKET, BY TYPE, 2023–2030 (USD MILLION)
TABLE 361
CHINA: IN SITU HYBRIDIZATION MARKET, BY TECHNOLOGY, 2023–2030 (USD MILLION)
TABLE 362
CHINA: FLUORESCENCE IN SITU HYBRIDIZATION (FISH) MARKET, BY TYPE, 2023–2030 (USD MILLION)
TABLE 363
CHINA: IN SITU HYBRIDIZATION MARKET, BY APPLICATION, 2023–2030 (USD MILLION)
TABLE 364
CHINA: IN SITU HYBRIDIZATION MARKET FOR CLINICAL DIAGNOSTIC APPLICATIONS, BY TYPE, 2023–2030 (USD MILLION)
TABLE 365
CHINA: IN SITU HYBRIDIZATION MARKET FOR RESEARCH APPLICATIONS, BY TYPE, 2023–2030 (USD MILLION)
TABLE 366
CHINA: IN SITU HYBRIDIZATION MARKET, BY END USER, 2023–2030 (USD MILLION)
TABLE 367
JAPAN: IN SITU HYBRIDIZATION MARKET, BY OFFERING, 2023–2030 (USD MILLION)
TABLE 368
JAPAN: IN SITU HYBRIDIZATION CONSUMABLES MARKET, BY TYPE, 2023–2030 (USD MILLION)
TABLE 369
JAPAN: IN SITU HYBRIDIZATION INSTRUMENTS MARKET, BY TYPE, 2023–2030 (USD MILLION)
TABLE 370
JAPAN: IN SITU HYBRIDIZATION SERVICES MARKET, BY TYPE, 2023–2030 (USD MILLION)
TABLE 371
JAPAN: IN SITU HYBRIDIZATION MARKET, BY TECHNOLOGY, 2023–2030 (USD MILLION)
TABLE 372
JAPAN: FLUORESCENCE IN SITU HYBRIDIZATION (FISH) MARKET, BY TYPE, 2023–2030 (USD MILLION)
TABLE 373
JAPAN: IN SITU HYBRIDIZATION MARKET, BY APPLICATION, 2023–2030 (USD MILLION)
TABLE 374
JAPAN: IN SITU HYBRIDIZATION MARKET FOR CLINICAL DIAGNOSTIC APPLICATIONS, BY TYPE, 2023–2030 (USD MILLION)
TABLE 375
JAPAN: IN SITU HYBRIDIZATION MARKET FOR RESEARCH APPLICATIONS, BY TYPE, 2023–2030 (USD MILLION)
TABLE 376
JAPAN: IN SITU HYBRIDIZATION MARKET, BY END USER, 2023–2030 (USD MILLION)
TABLE 377
INDIA: IN SITU HYBRIDIZATION MARKET, BY OFFERING, 2023–2030 (USD MILLION)
TABLE 378
INDIA: IN SITU HYBRIDIZATION CONSUMABLES MARKET, BY TYPE, 2023–2030 (USD MILLION)
TABLE 379
INDIA: IN SITU HYBRIDIZATION INSTRUMENTS MARKET, BY TYPE, 2023–2030 (USD MILLION)
TABLE 380
INDIA: IN SITU HYBRIDIZATION SERVICES MARKET, BY TYPE, 2023–2030 (USD MILLION)
TABLE 381
INDIA: IN SITU HYBRIDIZATION MARKET, BY TECHNOLOGY, 2023–2030 (USD MILLION)
TABLE 382
INDIA: FLUORESCENCE IN SITU HYBRIDIZATION (FISH) MARKET, BY TYPE, 2023–2030 (USD MILLION)
TABLE 383
INDIA: IN SITU HYBRIDIZATION MARKET, BY APPLICATION, 2023–2030 (USD MILLION)
TABLE 384
INDIA: IN SITU HYBRIDIZATION MARKET FOR CLINICAL DIAGNOSTIC APPLICATIONS, BY TYPE, 2023–2030 (USD MILLION)
TABLE 385
INDIA: IN SITU HYBRIDIZATION MARKET FOR RESEARCH APPLICATIONS, BY TYPE, 2023–2030 (USD MILLION)
TABLE 386
INDIA: IN SITU HYBRIDIZATION MARKET, BY END USER, 2023–2030 (USD MILLION)
TABLE 387
AUSTRALIA: IN SITU HYBRIDIZATION MARKET, BY OFFERING, 2023–2030 (USD MILLION)
TABLE 388
AUSTRALIA: IN SITU HYBRIDIZATION CONSUMABLES MARKET, BY TYPE, 2023–2030 (USD MILLION)
TABLE 389
AUSTRALIA: IN SITU HYBRIDIZATION INSTRUMENTS MARKET, BY TYPE, 2023–2030 (USD MILLION)
TABLE 390
AUSTRALIA: IN SITU HYBRIDIZATION SERVICES MARKET, BY TYPE, 2023–2030 (USD MILLION)
TABLE 391
AUSTRALIA: IN SITU HYBRIDIZATION MARKET, BY TECHNOLOGY, 2023–2030 (USD MILLION)
TABLE 392
AUSTRALIA: FLUORESCENCE IN SITU HYBRIDIZATION (FISH) MARKET, BY TYPE, 2023–2030 (USD MILLION)
TABLE 393
AUSTRALIA: IN SITU HYBRIDIZATION MARKET, BY APPLICATION, 2023–2030 (USD MILLION)
TABLE 394
AUSTRALIA: IN SITU HYBRIDIZATION MARKET FOR CLINICAL DIAGNOSTIC APPLICATIONS, BY TYPE, 2023–2030 (USD MILLION)
TABLE 395
AUSTRALIA: IN SITU HYBRIDIZATION MARKET FOR RESEARCH APPLICATIONS, BY TYPE, 2023–2030 (USD MILLION)
TABLE 396
AUSTRALIA: IN SITU HYBRIDIZATION MARKET, BY END USER, 2023–2030 (USD MILLION)
TABLE 397
SOUTH KOREA: IN SITU HYBRIDIZATION MARKET, BY OFFERING, 2023–2030 (USD MILLION)
TABLE 398
SOUTH KOREA: IN SITU HYBRIDIZATION CONSUMABLES MARKET, BY TYPE, 2023–2030 (USD MILLION)
TABLE 399
SOUTH KOREA: IN SITU HYBRIDIZATION INSTRUMENTS MARKET, BY TYPE, 2023–2030 (USD MILLION)
TABLE 400
SOUTH KOREA: IN SITU HYBRIDIZATION SERVICES MARKET, BY TYPE, 2023–2030 (USD MILLION)
TABLE 401
SOUTH KOREA: IN SITU HYBRIDIZATION MARKET, BY TECHNOLOGY, 2023–2030 (USD MILLION)
TABLE 402
SOUTH KOREA: FLUORESCENCE IN SITU HYBRIDIZATION (FISH) MARKET, BY TYPE, 2023–2030 (USD MILLION)
TABLE 403
SOUTH KOREA: IN SITU HYBRIDIZATION MARKET, BY APPLICATION, 2023–2030 (USD MILLION)
TABLE 404
SOUTH KOREA: IN SITU HYBRIDIZATION MARKET FOR CLINICAL DIAGNOSTIC APPLICATIONS, BY TYPE, 2023–2030 (USD MILLION)
TABLE 405
SOUTH KOREA: IN SITU HYBRIDIZATION MARKET FOR RESEARCH APPLICATIONS, BY TYPE, 2023–2030 (USD MILLION)
TABLE 406
SOUTH KOREA: IN SITU HYBRIDIZATION MARKET, BY END USER, 2023–2030 (USD MILLION)
TABLE 407
REST OF ASIA PACIFIC: IN SITU HYBRIDIZATION MARKET, BY OFFERING, 2023–2030 (USD MILLION)
TABLE 408
REST OF ASIA PACIFIC: IN SITU HYBRIDIZATION CONSUMABLES MARKET, BY TYPE, 2023–2030 (USD MILLION)
TABLE 409
REST OF ASIA PACIFIC: IN SITU HYBRIDIZATION INSTRUMENTS MARKET, BY TYPE, 2023–2030 (USD MILLION)
TABLE 410
REST OF ASIA PACIFIC: IN SITU HYBRIDIZATION SERVICES MARKET, BY TYPE, 2023–2030 (USD MILLION)
TABLE 411
REST OF ASIA PACIFIC: IN SITU HYBRIDIZATION MARKET, BY TECHNOLOGY, 2023–2030 (USD MILLION)
TABLE 412
REST OF ASIA PACIFIC: FLUORESCENCE IN SITU HYBRIDIZATION (FISH) MARKET, BY TYPE, 2023–2030 (USD MILLION)
TABLE 413
REST OF ASIA PACIFIC: IN SITU HYBRIDIZATION MARKET, BY APPLICATION, 2023–2030 (USD MILLION)
TABLE 414
REST OF ASIA PACIFIC: IN SITU HYBRIDIZATION MARKET FOR CLINICAL DIAGNOSTIC APPLICATIONS, BY TYPE, 2023–2030 (USD MILLION)
TABLE 415
REST OF ASIA PACIFIC: IN SITU HYBRIDIZATION MARKET FOR RESEARCH APPLICATIONS, BY TYPE, 2023–2030 (USD MILLION)
TABLE 416
REST OF ASIA PACIFIC: IN SITU HYBRIDIZATION MARKET, BY END USER, 2023–2030 (USD MILLION)
TABLE 417
LATIN AMERICA: KEY MACROINDICATORS
TABLE 418
LATIN AMERICA: IN SITU HYBRIDIZATION MARKET, BY OFFERING, 2023–2030 (USD MILLION)
TABLE 419
LATIN AMERICA: IN SITU HYBRIDIZATION CONSUMABLES MARKET, BY TYPE, 2023–2030 (USD MILLION)
TABLE 420
LATIN AMERICA: IN SITU HYBRIDIZATION INSTRUMENTS MARKET, BY TYPE, 2023–2030 (USD MILLION)
TABLE 421
LATIN AMERICA: IN SITU HYBRIDIZATION SERVICES MARKET, BY TYPE, 2023–2030 (USD MILLION)
TABLE 422
LATIN AMERICA: IN SITU HYBRIDIZATION MARKET, BY TECHNOLOGY, 2023–2030 (USD MILLION)
TABLE 423
LATIN AMERICA: FLUORESCENCE IN SITU HYBRIDIZATION (FISH) MARKET, BY TYPE, 2023–2030 (USD MILLION)
TABLE 424
LATIN AMERICA: IN SITU HYBRIDIZATION MARKET, BY APPLICATION, 2023–2030 (USD MILLION)
TABLE 425
LATIN AMERICA: IN SITU HYBRIDIZATION MARKET FOR CLINICAL DIAGNOSTIC APPLICATIONS, BY TYPE, 2023–2030 (USD MILLION)
TABLE 426
LATIN AMERICA: IN SITU HYBRIDIZATION MARKET FOR RESEARCH APPLICATIONS, BY TYPE, 2023–2030 (USD MILLION)
TABLE 427
LATIN AMERICA: IN SITU HYBRIDIZATION MARKET, BY END USER, 2023–2030 (USD MILLION)
TABLE 428
LATIN AMERICA: IN SITU HYBRIDIZATION MARKET, BY COUNTRY, 2023–2030 (USD MILLION)
TABLE 429
BRAZIL: IN SITU HYBRIDIZATION MARKET, BY OFFERING, 2023–2030 (USD MILLION)
TABLE 430
BRAZIL: IN SITU HYBRIDIZATION CONSUMABLES MARKET, BY TYPE, 2023–2030 (USD MILLION)
TABLE 431
BRAZIL: IN SITU HYBRIDIZATION INSTRUMENTS MARKET, BY TYPE, 2023–2030 (USD MILLION)
TABLE 432
BRAZIL: IN SITU HYBRIDIZATION SERVICES MARKET, BY TYPE, 2023–2030 (USD MILLION)
TABLE 433
BRAZIL: IN SITU HYBRIDIZATION MARKET, BY TECHNOLOGY, 2023–2030 (USD MILLION)
TABLE 434
BRAZIL: FLUORESCENCE IN SITU HYBRIDIZATION (FISH) MARKET, BY TYPE, 2023–2030 (USD MILLION)
TABLE 435
BRAZIL: IN SITU HYBRIDIZATION MARKET, BY APPLICATION, 2023–2030 (USD MILLION)
TABLE 436
BRAZIL: IN SITU HYBRIDIZATION MARKET FOR CLINICAL DIAGNOSTIC APPLICATIONS, BY TYPE, 2023–2030 (USD MILLION)
TABLE 437
BRAZIL: IN SITU HYBRIDIZATION MARKET FOR RESEARCH APPLICATIONS, BY TYPE, 2023–2030 (USD MILLION)
TABLE 438
BRAZIL: IN SITU HYBRIDIZATION MARKET, BY END USER, 2023–2030 (USD MILLION)
TABLE 439
MEXICO: IN SITU HYBRIDIZATION MARKET, BY OFFERING, 2023–2030 (USD MILLION)
TABLE 440
MEXICO: IN SITU HYBRIDIZATION CONSUMABLES MARKET, BY TYPE, 2023–2030 (USD MILLION)
TABLE 441
MEXICO: IN SITU HYBRIDIZATION INSTRUMENTS MARKET, BY TYPE, 2023–2030 (USD MILLION)
TABLE 442
MEXICO: IN SITU HYBRIDIZATION SERVICES MARKET, BY TYPE, 2023–2030 (USD MILLION)
TABLE 443
MEXICO: IN SITU HYBRIDIZATION MARKET, BY TECHNOLOGY, 2023–2030 (USD MILLION)
TABLE 444
MEXICO: FLUORESCENCE IN SITU HYBRIDIZATION (FISH) MARKET, BY TYPE, 2023–2030 (USD MILLION)
TABLE 445
MEXICO: IN SITU HYBRIDIZATION MARKET, BY APPLICATION, 2023–2030 (USD MILLION)
TABLE 446
MEXICO: IN SITU HYBRIDIZATION MARKET FOR CLINICAL DIAGNOSTIC APPLICATIONS, BY TYPE, 2023–2030 (USD MILLION)
TABLE 447
MEXICO: IN SITU HYBRIDIZATION MARKET FOR RESEARCH APPLICATIONS, BY TYPE, 2023–2030 (USD MILLION)
TABLE 448
MEXICO: IN SITU HYBRIDIZATION MARKET, BY END USER, 2023–2030 (USD MILLION)
TABLE 449
REST OF LATIN AMERICA: IN SITU HYBRIDIZATION MARKET, BY OFFERING, 2023–2030 (USD MILLION)
TABLE 450
REST OF LATIN AMERICA: IN SITU HYBRIDIZATION CONSUMABLES MARKET, BY TYPE, 2023–2030 (USD MILLION)
TABLE 451
REST OF LATIN AMERICA: IN SITU HYBRIDIZATION INSTRUMENTS MARKET, BY TYPE, 2023–2030 (USD MILLION)
TABLE 452
REST OF LATIN AMERICA: IN SITU HYBRIDIZATION SERVICES MARKET, BY TYPE, 2023–2030 (USD MILLION)
TABLE 453
REST OF LATIN AMERICA: IN SITU HYBRIDIZATION MARKET, BY TECHNOLOGY, 2023–2030 (USD MILLION)
TABLE 454
REST OF LATIN AMERICA: FLUORESCENCE IN SITU HYBRIDIZATION (FISH) MARKET, BY TYPE, 2023–2030 (USD MILLION)
TABLE 455
REST OF LATIN AMERICA: IN SITU HYBRIDIZATION MARKET, BY APPLICATION, 2023–2030 (USD MILLION)
TABLE 456
REST OF LATIN AMERICA: IN SITU HYBRIDIZATION MARKET FOR CLINICAL DIAGNOSTIC APPLICATIONS, BY TYPE, 2023–2030 (USD MILLION)
TABLE 457
REST OF LATIN AMERICA: IN SITU HYBRIDIZATION MARKET FOR RESEARCH APPLICATIONS, BY TYPE, 2023–2030 (USD MILLION)
TABLE 458
REST OF LATIN AMERICA: IN SITU HYBRIDIZATION MARKET, BY END USER, 2023–2030 (USD MILLION)
TABLE 459
MIDDLE EAST: KEY MACROINDICATORS
TABLE 460
MIDDLE EAST: IN SITU HYBRIDIZATION MARKET, BY OFFERING, 2023–2030 (USD MILLION)
TABLE 461
MIDDLE EAST: IN SITU HYBRIDIZATION CONSUMABLES MARKET, BY TYPE, 2023–2030 (USD MILLION)
TABLE 462
MIDDLE EAST: IN SITU HYBRIDIZATION INSTRUMENTS MARKET, BY TYPE, 2023–2030 (USD MILLION)
TABLE 463
MIDDLE EAST: IN SITU HYBRIDIZATION SERVICES MARKET, BY TYPE, 2023–2030 (USD MILLION)
TABLE 464
MIDDLE EAST: IN SITU HYBRIDIZATION MARKET, BY TECHNOLOGY, 2023–2030 (USD MILLION)
TABLE 465
MIDDLE EAST: FLUORESCENCE IN SITU HYBRIDIZATION (FISH) MARKET, BY TYPE, 2023–2030 (USD MILLION)
TABLE 466
MIDDLE EAST: IN SITU HYBRIDIZATION MARKET, BY APPLICATION, 2023–2030 (USD MILLION)
TABLE 467
MIDDLE EAST: IN SITU HYBRIDIZATION MARKET FOR CLINICAL DIAGNOSTIC APPLICATIONS, BY TYPE, 2023–2030 (USD MILLION)
TABLE 468
MIDDLE EAST: IN SITU HYBRIDIZATION MARKET FOR RESEARCH APPLICATIONS, BY TYPE, 2023–2030 (USD MILLION)
TABLE 469
MIDDLE EAST: IN SITU HYBRIDIZATION MARKET, BY END USER, 2023–2030 (USD MILLION)
TABLE 470
MIDDLE EAST: IN SITU HYBRIDIZATION MARKET, BY REGION, 2023–2030 (USD MILLION)
TABLE 471
GCC COUNTRIES: IN SITU HYBRIDIZATION MARKET, BY OFFERING, 2023–2030 (USD MILLION)
TABLE 472
GCC COUNTRIES: IN SITU HYBRIDIZATION CONSUMABLES MARKET, BY TYPE, 2023–2030 (USD MILLION)
TABLE 473
GCC COUNTRIES: IN SITU HYBRIDIZATION INSTRUMENTS MARKET, BY TYPE, 2023–2030 (USD MILLION)
TABLE 474
GCC COUNTRIES: IN SITU HYBRIDIZATION SERVICES MARKET, BY TYPE, 2023–2030 (USD MILLION)
TABLE 475
GCC COUNTRIES: IN SITU HYBRIDIZATION MARKET, BY TECHNOLOGY, 2023–2030 (USD MILLION)
TABLE 476
GCC COUNTRIES: FLUORESCENCE IN SITU HYBRIDIZATION (FISH) MARKET, BY TYPE, 2023–2030 (USD MILLION)
TABLE 477
GCC COUNTRIES: IN SITU HYBRIDIZATION MARKET, BY APPLICATION, 2023–2030 (USD MILLION)
TABLE 478
GCC COUNTRIES: IN SITU HYBRIDIZATION MARKET FOR CLINICAL DIAGNOSTIC APPLICATIONS, BY TYPE, 2023–2030 (USD MILLION)
TABLE 479
GCC COUNTRIES: IN SITU HYBRIDIZATION MARKET FOR RESEARCH APPLICATIONS, BY TYPE, 2023–2030 (USD MILLION)
TABLE 480
GCC COUNTRIES: IN SITU HYBRIDIZATION MARKET, BY END USER, 2023–2030 (USD MILLION)
TABLE 481
GCC: IN SITU HYBRIDIZATION MARKET, BY COUNTRY, 2023–2030 (USD MILLION)
TABLE 482
KINGDOM OF SAUDI ARABIA: IN SITU HYBRIDIZATION MARKET, BY OFFERING, 2023–2030 (USD MILLION)
TABLE 483
KINGDOM OF SAUDI ARABIA: IN SITU HYBRIDIZATION CONSUMABLES MARKET, BY TYPE, 2023–2030 (USD MILLION)
TABLE 484
KINGDOM OF SAUDI ARABIA: IN SITU HYBRIDIZATION INSTRUMENTS MARKET, BY TYPE, 2023–2030 (USD MILLION)
TABLE 485
KINGDOM OF SAUDI ARABIA: IN SITU HYBRIDIZATION SERVICES MARKET, BY TYPE, 2023–2030 (USD MILLION)
TABLE 486
KINGDOM OF SAUDI ARABIA: IN SITU HYBRIDIZATION MARKET, BY TECHNOLOGY, 2023–2030 (USD MILLION)
TABLE 487
KINGDOM OF SAUDI ARABIA: FLUORESCENCE IN SITU HYBRIDIZATION (FISH) MARKET, BY TYPE, 2023–2030 (USD MILLION)
TABLE 488
KINGDOM OF SAUDI ARABIA: IN SITU HYBRIDIZATION MARKET, BY APPLICATION, 2023–2030 (USD MILLION)
TABLE 489
KINGDOM OF SAUDI ARABIA: IN SITU HYBRIDIZATION MARKET FOR CLINICAL DIAGNOSTIC APPLICATIONS, BY TYPE, 2023–2030 (USD MILLION)
TABLE 490
KINGDOM OF SAUDI ARABIA: IN SITU HYBRIDIZATION MARKET FOR RESEARCH APPLICATIONS, BY TYPE, 2023–2030 (USD MILLION)
TABLE 491
KINGDOM OF SAUDI ARABIA: IN SITU HYBRIDIZATION MARKET, BY END USER, 2023–2030 (USD MILLION)
TABLE 492
UAE: IN SITU HYBRIDIZATION MARKET, BY OFFERING, 2023–2030 (USD MILLION)
TABLE 493
UAE: IN SITU HYBRIDIZATION CONSUMABLES MARKET, BY TYPE, 2023–2030 (USD MILLION)
TABLE 494
UAE: IN SITU HYBRIDIZATION INSTRUMENTS MARKET, BY TYPE, 2023–2030 (USD MILLION)
TABLE 495
UAE: IN SITU HYBRIDIZATION SERVICES MARKET, BY TYPE, 2023–2030 (USD MILLION)
TABLE 496
UAE: IN SITU HYBRIDIZATION MARKET, BY TECHNOLOGY, 2023–2030 (USD MILLION)
TABLE 497
UAE: FLUORESCENCE IN SITU HYBRIDIZATION (FISH) MARKET, BY TYPE, 2023–2030 (USD MILLION)
TABLE 498
UAE: IN SITU HYBRIDIZATION MARKET, BY APPLICATION, 2023–2030 (USD MILLION)
TABLE 499
UAE: IN SITU HYBRIDIZATION MARKET FOR CLINICAL DIAGNOSTIC APPLICATIONS, BY TYPE, 2023–2030 (USD MILLION)
TABLE 500
UAE: IN SITU HYBRIDIZATION MARKET FOR RESEARCH APPLICATIONS, BY TYPE, 2023–2030 (USD MILLION)
TABLE 501
UAE: IN SITU HYBRIDIZATION MARKET, BY END USER, 2023–2030 (USD MILLION)
TABLE 502
REST OF GCC COUNTRIES: IN SITU HYBRIDIZATION MARKET, BY OFFERING, 2023–2030 (USD MILLION)
TABLE 503
REST OF GCC COUNTRIES: IN SITU HYBRIDIZATION CONSUMABLES MARKET, BY TYPE, 2023–2030 (USD MILLION)
TABLE 504
REST OF GCC COUNTRIES: IN SITU HYBRIDIZATION INSTRUMENTS MARKET, BY TYPE, 2023–2030 (USD MILLION)
TABLE 505
REST OF GCC COUNTRIES: IN SITU HYBRIDIZATION SERVICES MARKET, BY TYPE, 2023–2030 (USD MILLION)
TABLE 506
REST OF GCC COUNTRIES: IN SITU HYBRIDIZATION MARKET, BY TECHNOLOGY, 2023–2030 (USD MILLION)
TABLE 507
REST OF GCC COUNTRIES: FLUORESCENCE IN SITU HYBRIDIZATION (FISH) MARKET, BY TYPE, 2023–2030 (USD MILLION)
TABLE 508
REST OF GCC COUNTRIES: IN SITU HYBRIDIZATION MARKET, BY APPLICATION, 2023–2030 (USD MILLION)
TABLE 509
REST OF GCC COUNTRIES: IN SITU HYBRIDIZATION MARKET FOR CLINICAL DIAGNOSTIC APPLICATIONS, BY TYPE, 2023–2030 (USD MILLION)
TABLE 510
REST OF GCC COUNTRIES: IN SITU HYBRIDIZATION MARKET FOR RESEARCH APPLICATIONS, BY TYPE, 2023–2030 (USD MILLION)
TABLE 511
REST OF GCC COUNTRIES: IN SITU HYBRIDIZATION MARKET, BY END USER, 2023–2030 (USD MILLION)
TABLE 512
REST OF MIDDLE EAST: IN SITU HYBRIDIZATION MARKET, BY OFFERING, 2023–2030 (USD MILLION)
TABLE 513
REST OF MIDDLE EAST: IN SITU HYBRIDIZATION CONSUMABLES MARKET, BY TYPE, 2023–2030 (USD MILLION)
TABLE 514
REST OF MIDDLE EAST: IN SITU HYBRIDIZATION INSTRUMENTS MARKET, BY TYPE, 2023–2030 (USD MILLION)
TABLE 515
REST OF MIDDLE EAST: IN SITU HYBRIDIZATION SERVICES MARKET, BY TYPE, 2023–2030 (USD MILLION)
TABLE 516
REST OF MIDDLE EAST: IN SITU HYBRIDIZATION MARKET, BY TECHNOLOGY, 2023–2030 (USD MILLION)
TABLE 517
REST OF MIDDLE EAST: FLUORESCENCE IN SITU HYBRIDIZATION (FISH) MARKET, BY TYPE, 2023–2030 (USD MILLION)
TABLE 518
REST OF MIDDLE EAST: IN SITU HYBRIDIZATION MARKET, BY APPLICATION, 2023–2030 (USD MILLION)
TABLE 519
REST OF MIDDLE EAST: IN SITU HYBRIDIZATION MARKET FOR CLINICAL DIAGNOSTIC APPLICATIONS, BY TYPE, 2023–2030 (USD MILLION)
TABLE 520
REST OF MIDDLE EAST: IN SITU HYBRIDIZATION MARKET FOR RESEARCH APPLICATIONS, BY TYPE, 2023–2030 (USD MILLION)
TABLE 521
REST OF MIDDLE EAST: IN SITU HYBRIDIZATION MARKET, BY END USER, 2023–2030 (USD MILLION)
TABLE 522
AFRICA: KEY MACROINDICATORS
TABLE 523
AFRICA: IN SITU HYBRIDIZATION MARKET, BY OFFERING, 2023–2030 (USD MILLION)
TABLE 524
AFRICA: IN SITU HYBRIDIZATION CONSUMABLES MARKET, BY TYPE, 2023–2030 (USD MILLION)
TABLE 525
AFRICA: IN SITU HYBRIDIZATION INSTRUMENTS MARKET, BY TYPE, 2023–2030 (USD MILLION)
TABLE 526
AFRICA: IN SITU HYBRIDIZATION SERVICES MARKET, BY TYPE, 2023–2030 (USD MILLION)
TABLE 527
AFRICA: IN SITU HYBRIDIZATION MARKET, BY TECHNOLOGY, 2023–2030 (USD MILLION)
TABLE 528
AFRICA: FLUORESCENCE IN SITU HYBRIDIZATION (FISH) MARKET, BY TYPE, 2023–2030 (USD MILLION)
TABLE 529
AFRICA: IN SITU HYBRIDIZATION MARKET, BY APPLICATION, 2023–2030 (USD MILLION)
TABLE 530
AFRICA: IN SITU HYBRIDIZATION MARKET FOR CLINICAL DIAGNOSTIC APPLICATIONS, BY TYPE, 2023–2030 (USD MILLION)
TABLE 531
AFRICA: IN SITU HYBRIDIZATION MARKET FOR RESEARCH APPLICATIONS, BY TYPE, 2023–2030 (USD MILLION)
TABLE 532
AFRICA: IN SITU HYBRIDIZATION MARKET, BY END USER, 2023–2030 (USD MILLION)
TABLE 533
OVERVIEW OF STRATEGIES DEPLOYED BY KEY PLAYERS IN IN SITU HYBRIDIZATION MARKET
TABLE 534
IN SITU HYBRIDIZATION MARKET: DEGREE OF COMPETITION
TABLE 535
IN SITU HYBRIDIZATION MARKET: REGION FOOTPRINT
TABLE 536
IN SITU HYBRIDIZATION MARKET: OFFERING FOOTPRINT
TABLE 537
IN SITU HYBRIDIZATION MARKET: TECHNOLOGY FOOTPRINT
TABLE 538
IN SITU HYBRIDIZATION MARKET: DETAILED LIST OF KEY STARTUPS/SME PLAYERS
TABLE 539
IN SITU HYBRIDIZATIONN MARKET: COMPETITIVE BENCHMARKING OF KEY STARTUPS/SME PLAYERS, BY OFFERING AND REGION
TABLE 540
IN SITU HYBRIDIZATION MARKET: PRODUCT LAUNCHES & APPROVALS, JANUARY 2022–JUNE 2025
TABLE 541
IN SITU HYBRIDIZATION MARKET: DEALS, JANUARY 2022–JUNE 2025
TABLE 542
F. HOFFMANN-LA ROCHE LTD.: COMPANY OVERVIEW
TABLE 543
F. HOFFMANN-LA ROCHE LTD.: PRODUCTS/SERVICES/SOLUTIONS OFFERED
TABLE 544
F. HOFFMANN-LA ROCHE LTD.: PRODUCT LAUNCHES & APPROVALS, JANUARY 2022–JUNE 2025
TABLE 545
DANAHER: COMPANY OVERVIEW
TABLE 546
DANAHER: PRODUCTS/SERVICES/SOLUTIONS OFFERED
TABLE 547
DANAHER: PRODUCT LAUNCHES, JANUARY 2022–JUNE 2025
TABLE 548
DANAHER: DEALS, JANUARY 2022–JUNE 2025
TABLE 549
ABBOTT: COMPANY OVERVIEW
TABLE 550
ABBOTT: PRODUCTS/SERVICES/SOLUTIONS OFFERED
TABLE 551
THERMO FISHER SCIENTIFIC INC.: COMPANY OVERVIEW
TABLE 552
THERMO FISHER SCIENTIFIC INC.: PRODUCTS/SERVICES/SOLUTIONS OFFERED
TABLE 553
BIO-TECHNE: COMPANY OVERVIEW
TABLE 554
BIO-TECHNE: PRODUCTS/SERVICES/SOLUTIONS OFFERED
TABLE 555
BIO-TECHNE: PRODUCT LAUNCHES, JANUARY 2022–JUNE 2025
TABLE 556
BIO-TECHNE: DEALS, JANUARY 2022–JUNE 2025
TABLE 557
AGILENT TECHNOLOGIES, INC.: COMPANY OVERVIEW
TABLE 558
AGILENT TECHNOLOGIES, INC.: PRODUCTS/SERVICES/SOLUTIONS OFFERED
TABLE 559
QIAGEN: COMPANY OVERVIEW
TABLE 560
QIAGEN: PRODUCTS/SERVICES/SOLUTIONS OFFERED
TABLE 561
BIOCARE MEDICAL, LLC: COMPANY OVERVIEW
TABLE 562
BIOCARE MEDICAL, LLC: PRODUCTS/SERVICES/SOLUTIONS OFFERED
TABLE 563
BIOCARE MEDICAL, LLC: DEALS, JANUARY 2022–JUNE 2025
TABLE 564
BIOVIEW: COMPANY OVERVIEW
TABLE 565
BIOVIEW: PRODUCTS/SERVICES/SOLUTIONS OFFERED
TABLE 566
CREATIVE BIOARRAY: COMPANY OVERVIEW
TABLE 567
CREATIVE BIOARRAY: PRODUCTS/SERVICES/SOLUTIONS OFFERED
TABLE 568
ABNOVA CORPORATION: COMPANY OVERVIEW
TABLE 569
ABNOVA CORPORATION: PRODUCTS/SERVICES/SOLUTIONS OFFERED
TABLE 570
ZYTOMICS: COMPANY OVERVIEW
TABLE 571
ZYTOMICS: PRODUCTS/SERVICES/SOLUTIONS OFFERED
TABLE 572
ENZO BIOCHEM INC.: COMPANY OVERVIEW
TABLE 573
ENZO BIOCHEM INC.: PRODUCTS/SERVICES/SOLUTIONS OFFERED
TABLE 574
ENZO BIOCHEM INC.: PRODUCT LAUNCHES, JANUARY 2022–JUNE 2025
TABLE 575
CYTOTEST INC.: COMPANY OVERVIEW
TABLE 576
CYTOTEST INC.: PRODUCTS/SERVICES/SOLUTIONS OFFERED
TABLE 577
GENEMED BIOTECHNOLOGIES, INC.: COMPANY OVERVIEW
TABLE 578
GENEMED BIOTECHNOLOGIES, INC.: PRODUCTS/SERVICES/SOLUTIONS OFFERED
TABLE 579
MOLECULAR INSTRUMENTS, INC.: COMPANY OVERVIEW
TABLE 580
OXFORD GENE TECHNOLOGY IP LIMITED: COMPANY OVERVIEW
TABLE 581
HISTO-LINE LABORATORIES: COMPANY OVERVIEW
TABLE 582
METASYSTEMS: COMPANY OVERVIEW
TABLE 583
BIOGENEX: COMPANY OVERVIEW
TABLE 584
LGC BIORESEARCH TECHNOLOGIES: COMPANY OVERVIEW
TABLE 585
BIODISCOVERY LLC: COMPANY OVERVIEW
TABLE 586
KANEKA EUROGENTEC S.A.: COMPANY OVERVIEW
TABLE 587
LIFE TECHNOLOGIES (INDIA) PVT. LTD.: COMPANY OVERVIEW
TABLE 588
GENECOPOEIA, INC.: COMPANY OVERVIEW
FIGURE 1
IN SITU HYBRIDIZATION MARKET SEGMENTATION & REGIONAL SCOPE
FIGURE 2
IN SITU HYBRIDIZATION MARKET: YEARS CONSIDERED
FIGURE 3
IN SITU HYBRIDIZATION MARKET: RESEARCH DESIGN
FIGURE 4
IN SITU HYBRIDIZATION MARKET: BREAKDOWN OF PRIMARIES (SUPPLY- AND DEMAND-SIDE PARTICIPANTS)
FIGURE 5
IN SITU HYBRIDIZATION MARKET SIZE ESTIMATION (SUPPLY-SIDE ANALYSIS), 2024
FIGURE 6
GLOBAL MARKET SIZE ESTIMATION: COMPANY REVENUE ANALYSIS (BOTTOM-UP APPROACH), 2024
FIGURE 7
IN SITU HYBRIDIZATION MARKET: REVENUE ANALYSIS OF HOFFMANN-LA ROCHE LTD. (2024)
FIGURE 8
IN SITU HYBRIDIZATION MARKET SIZE VALIDATION FROM PRIMARY SOURCES
FIGURE 9
SEGMENTAL MARKET SIZE ESTIMATION: TOP-DOWN APPROACH
FIGURE 10
IN SITU HYBRIDIZATION MARKET: CAGR PROJECTIONS (2025–2030)
FIGURE 11
IN SITU HYBRIDIZATION MARKET: GROWTH ANALYSIS OF MARKET DYNAMICS
FIGURE 12
IN SITU HYBRIDIZATION MARKET: DATA TRIANGULATION METHODOLOGY
FIGURE 13
IN SITU HYBRIDIZATION MARKET, BY OFFERING, 2025 VS. 2030 (USD MILLION)
FIGURE 14
IN SITU HYBRIDIZATION MARKET, BY TECHNOLOGY, 2025 VS. 2030 (USD MILLION)
FIGURE 15
IN SITU HYBRIDIZATION MARKET, BY APPLICATION, 2025 VS. 2030 (USD MILLION)
FIGURE 16
IN SITU HYBRIDIZATION MARKET, BY END USER, 2025 VS. 2030 (USD MILLION)
FIGURE 17
REGIONAL ANALYSIS OF IN SITU HYBRIDIZATION MARKET
FIGURE 18
INCREASING ADOPTION OF IN SITU HYBRIDIZATION TECHNOLOGIES IN LABORATOY-DEVELOPED TESTS TO DRIVE MARKET
FIGURE 19
US AND CONSUMABLES ACCOUNTED FOR LARGEST NORTH AMERICAN MARKET SHARE IN 2024
FIGURE 20
HOSPITALS & DIAGNOSTIC LABORATORIES TO COMMAND LARGEST END USER MARKET SHARE IN 2024
FIGURE 21
CHINA TO REGISTER HIGHEST GROWTH RATE DURING STUDY PERIOD
FIGURE 22
IN SITU HYBRIDIZATION MARKET: DRIVERS, RESTRAINTS, OPPORTUNITIES, AND CHALLENGES
FIGURE 23
IN SITU HYBRIDIZATION MARKET: TRENDS/DISRUPTIONS IMPACTING CUSTOMER’S BUSINESS
FIGURE 24
IN SITU HYBRIDIZATION PRODUCTS MARKET: VALUE CHAIN ANALYSIS
FIGURE 25
IN SITU HYBRIDIZATION MARKET: ECOSYSTEM ANALYSIS
FIGURE 26
TOP APPLICANTS/OWNERS (COMPANIES) FOR IN SITU HYBRIDIZATION PATENTS
FIGURE 27
IN SITU HYBRIDIZATION MARKET: PORTER’S FIVE FORCES ANALYSIS
FIGURE 28
INFLUENCE OF KEY STAKEHOLDERS ON BUYING PROCESS OF IN SITU HYBRIDIZATION-BASED OFFERINGS
FIGURE 29
KEY BUYING CRITERIA, BY END USER
FIGURE 30
IMPACT OF AI ON IN SITU HYBRIDIZATION ECOSYSTEM
FIGURE 31
NORTH AMERICA: IN SITU HYBRIDIZATION MARKET SNAPSHOT
FIGURE 32
ASIA PACIFIC: IN SITU HYBRIDIZATION MARKET SNAPSHOT
FIGURE 33
REVENUE ANALYSIS OF KEY PLAYERS IN IN SITU HYBRIDIZATION MARKET, 2020–2024 (USD MILLION)
FIGURE 34
MARKET SHARE ANALYSIS OF KEY PLAYERS IN IN SITU HYBRIDIZATION MARKET (2024)
FIGURE 35
IN SITU HYBRIDIZATION MARKET: COMPANY EVALUATION MATRIX (KEY PLAYERS), 2024
FIGURE 36
IN SITU HYBRIDIZATION MARKET: COMPANY FOOTPRINT
FIGURE 37
IN SITU HYBRIDIZATION MARKET: COMPANY EVALUATION MATRIX (STARTUPS/SMES), 2024
FIGURE 38
EV/EBITDA OF KEY VENDORS
FIGURE 39
YEAR-TO-DATE (YTD) PRICE TOTAL RETURN AND 5-YEAR STOCK BETA OF KEY VENDORS
FIGURE 40
BRAND/PRODUCT COMPARATIVE ANALYSIS OF IN SITU HYBRIDIZATION-BASED ASSAYS
FIGURE 41
F. HOFFMANN-LA ROCHE LTD.: COMPANY SNAPSHOT
FIGURE 42
DANAHER: COMPANY SNAPSHOT
FIGURE 43
ABBOTT: COMPANY SNAPSHOT
FIGURE 44
THERMO FISHER SCIENTIFIC INC.: COMPANY SNAPSHOT
FIGURE 45
BIO-TECHNE: COMPANY SNAPSHOT
FIGURE 46
AGILENT TECHNOLOGIES, INC.: COMPANY SNAPSHOT
FIGURE 47
QIAGEN: COMPANY SNAPSHOT
FIGURE 48
ENZO BIOCHEM INC.: COMPANY SNAPSHOT


 Exclusive indicates content/data unique to MarketsandMarkets and not available with any competitors.


Growth opportunities and latent adjacency in In Situ Hybridization Market