Influencer Marketing Platform Market

Influencer Marketing Platform Market by Component, Application (Search and Discovery, Campaign Management, Influencer Relationship Management, and Analytics and Reporting), Organization Size, End User, and Region - Global Forecast to 2025

Report Code: TC 7191 Dec, 2020, by marketsandmarkets.com

Influencer Marketing Platform Market Share, Forecast & Growth Report

[207 Pages Report] The Influencer Marketing Platform Market size worth approximately $6.0 billion in 2020. It is expected to grow at an effective Compound Annual Growth Rate (CAGR) of 32.0% from 2020 to 2025. The revenue projections for 2025 is poised to rise over $24.1 billion. The base year considered for estimation is 2020 and the historical data span ranges from 2020 to 2025.

Various factors such as the customers’ shift toward video-based content across the OTT space and an increase in the adoption of ad-blocking software are expected to drive the adoption of the influencer marketing platform market.

Influencer Marketing Platform Market

To know about the assumptions considered for the study, Request for Free Sample Report

COVID-19 impact

COVID-19 has shocked the entire world. Many businesses are fighting to survive and are using different marketing strategies to recover the loss. As per the Global Web Index survey, over 80% of consumers in the US and UK say they’ve consumed more content during COVID-19. This has posed a good opportunity for brands and influencers to engage with their audiences with impactful messaging. The importance of influencer marketing as a core marketing strategy has grown during the COVID-19 crisis. Companies must continue to depend on influencers to act as their spokespeople and execute their messaging in a trustworthy and human way. TikTok has been identified as one of the most popular mediums for video content consumption so brands and influencers alike must look for ways to increase their exposure in this fairly new avenue. Through the personal views and support of followers, influencers will continue to shape the conversations occurring in the post-lockdown world. The effects of COVID-19 will be long-term, and as a result, marketing strategies must be revised to suit the new environment in which smaller and larger companies are surviving currently.

Influencer Marketing Platform Market Growth Dynamics

Driver:  Customers’ shift toward video-based content across the OTT space

With the increasing use of smartphones and 3G and 4G networks, video consumption has grown tremendously in the last few years. Therefore, organizations are designing marketing strategies for video-based content streaming across digital channels. In the last three years, television viewership has rapidly decreased and shifted toward social media channels, such as Facebook, YouTube, and Instagram. As per a Google study in 2017, YouTube is the second-most used search engine across the world. Moreover, as the television viewership reduced by 50% among the age group of 18–26 in 2017, video-based marketing increased from 63% in 2017 to 81% in 2018, according to Wyzowl‘s statistics. Similarly, according to the Cisco Visual Networking Index: Global Mobile Data Traffic Forecast Update, 2017–2022, the world’s mobile video traffic increased by 59% in 2017. These statistics show the continuous shift of consumers toward OTT and social media. However, owing to a decentralized consumer base, organizations are unable to target their potential consumers through traditional marketing techniques. Therefore, they are moving toward the influencer marketing technique that enables them to target potential buyers. According to the analysis from Twitter and Annalect, 40% of Twitter users make purchase decisions with the help of tweets.

Restraint: Lack of capabilities to measure campaign effectiveness

The influencer marketing technique effectively reaches buyers and enhances customer engagement throughout campaigns. However, it lacks in measuring campaign effectiveness due to improper planning. Mostly, brands conduct campaigns without planning their key aspects, such as clarity of end goals, geographic areas, and type of influencers. Campaigns are failing or producing limited results due to the lack of planning. Moreover, campaigns’ effectiveness needs to be analyzed through various channels. In some scenarios, people make buying decisions through offline conversation. For instance, if people are sharing product details through their personal emails and LinkedIn, or other private accounts, then their buying decisions are not counted during measuring campaigns. Brands are, therefore, finding it difficult to measure campaign effectiveness.

Opportunity: Influencer marketing platform to gain customer trust and create new brand image

Consumer demand is based on product authenticity and reliable products and services. Traditional marketing and advertising techniques are continuously forcing customers to buy products. The traditional techniques can create a poor brand image. Moreover, consumers’ shift toward the OTT space and various social media channels has decentralized the consumer base across channels, which has led to high marketing expenses with zero Return on Investment (ROI). Therefore, organizations are increasingly adopting effective marketing techniques that reach to end users without annoying them. The influencer marketing technique is one of the effective marketing strategies that reach direct customers through macro and micro influencers and builds a strong bond among customers and brands. Brands endorsed by celebrities, bloggers, vloggers, and well-known personalities through social media channels create trust in the minds of customers. According to ClickZ, 22% of users in the age group of 18–34 make their buying decisions after watching celebrity endorsements. The statistics above show that brand image may be hampered if companies breach the trust of their consumers. Organizations have huge opportunities to gain consumer trust and acquire new customers by providing quality and transparency.

Challenge: Increase in the number of fake followers

The influencer marketing technique has been immensely growing since 2016, as consumers have shifted from TV to social media and other OTT channels. Therefore, organizations are competing with each other to engage with authentic and effective influencers for promoting their products and enhancing sales. The growing competition has increased the demand for micro and macro-influencers. However, with the growing competition, identifying authentic influencers with a large number of followers has become the biggest challenge for brands and organizations. There are many influencers who use fake followers through bots to show their popularity and attract big brands. According to Mediakix’s survey, an influencer marketing agency, big brands have come across 50% of influencers who have bought fake followers. Similarly, according to the 2017 statistics of Sway Ops, an anti-fraud company, one day’s Instagram posts had 50% fake followers. The stats show that the growing use of fake followers would waste the money invested in influencers. According to White Ops/ANA, the global losses due to bot frauds were estimated to be USD 7.2 billion in 2016. To tackle the issues, organizations are adopting auditing tools that identify fake accounts by scanning influencers’ account, and show the data of authentic and fake followers. The tools might help brands identify authentic influencers in the coming years.

Search and discovery application segment to have the largest market size during the forecast period

The influencer marketing platform market by application has been segmented into search and discovery, campaign management, influencer relationship management, analytics and reporting, and compliance management and fraud detection. The other applications comprise workflow automation and time management, and third-party integration. The market size of the search and discovery application segment is estimated to be higher in 2020. The search and discovery application provides advanced search options to find relevant and valuable influencers for marketing campaigns. Organizations are increasingly adopting the influencer marketing platform to find potential influencers who can promote their brands, enhance brand exposure, and create a higher level of customer engagement. The search and discovery tool provides influencers’ comprehensive information, such as personal, geographic, and professional details, interest areas, audience demographics, social media channels, traffic history, and engagement rates.

Asia Pacific to grow at the highest CAGR during the forecast period

North America is expected to hold the largest market size in the global influencer marketing platform market. In contrast, Asia Pacific (APAC) is expected to grow at the highest CAGR during the forecast period due to the increasing adoption of advanced technologies across countries, such as China, Japan, and India. The rising number of social media users is expected to boost the adoption of influencer marketing platforms in APAC. The growing implementation of ad-blocking solutions by users across Europe and APAC is further driving the growth of the market.

Influencer Marketing Platform Market  by Region

Key Market Players

The influencer marketing platform vendors have implemented various types of organic and inorganic growth strategies, such as new product launches, product upgradations, partnerships and agreements, business expansions, and mergers and acquisitions to strengthen their offerings in the market. The major vendors in the global influencer marketing platform market include IZEA Worldwide (US), Quotient Technology Inc. (US), Launchmetrics> (US), JuliusWorks, Inc.(US), Traackr, Inc.(US), Upfluence Inc. (US), Klear (US), AspireIQ (US), CreatorIQ (US), Mavrck (US), Impact Tech, Inc. (US), Brandwatch (UK), Linqia, Inc. (US), Onalytica (UK), Social Beat Digital Marketing LLP (India), ExpertVoice Inc. (US), Lefty (France), Lumanu Inc. (US), InfluencerDB (Germany), Taggermedia (US), Heepsy (Spain), Fourstarzz Media LLC (US), Juulr B.V. (The Netherlands), Intellifluence (US), Insense Ads, Inc. (US), Talent Village Ltd. (UK), The Room (UK), Blogmint (India), Zine Ltd. (UK), and Captiv8 Inc. (US). The study includes an in-depth competitive analysis of these key players in the Influencer marketing platform market with their company profiles, recent developments, and key market strategies.

Influencer Marketing Platform Market Report Scope

Report Metric

Details

Market size value in 2020

USD 6.0 Billion

Revenue forecast by 2025

USD 24.1 Billion

Market Growth Rate

32.0% CAGR

By Organization Size:

Large Enterprises, Small and Medium-sized Enterprises (SMEs)

Market size available for years

2016–2025

Base year considered

2019

Forecast period

2020–2025

Forecast units

USD Billion

Segments covered

Component, application, organization size, end user, and region

Geographies covered

North America, Europe, APAC, Latin America, and MEA

Companies covered

IZEA Worldwide (US), Quotient Technology Inc. (US), Launchmetrics (US), JuliusWorks, Inc. (US), Traackr, Inc. (US), Upfluence Inc. (US), Klear (US), AspireIQ (US), CreatorIQ (US), Mavrck (US), Impact Tech, Inc. (US), Brandwatch (UK), Linqia, Inc. (US), Onalytica (UK), Social Beat Digital Marketing LLP (India), ExpertVoice Inc. (US), Lefty (France), Lumanu Inc. (US), InfluencerDB (Germany), Taggermedia (US), Heepsy (Spain), Fourstarzz Media LLC (US), Juulr B.V. (The Netherlands), Intellifluence (US), Insense Ads, Inc. (US), Talent Village Ltd. (UK), The Room (UK), Blogmint (India), Zine Ltd. (UK), and Captiv8 Inc. (US)

This research report categorizes the influencer marketing platform market based on components, solution, organization size, end user, and regions.

By Component:

  • Solutions
  • Services
    • Consulting
    • Deployment and Integration
    • Support and maintenance

By Application:

  • Search and discovery
  • Campaign management
  • Influencer relationship management
  • Analytics and reporting
  • Compliance management and fraud detection
  • Others (workflow automation and time management, and third-party integration)

By End User:

  • Fashion and lifestyle
  • Agencies and PR
  • Retail and consumer goods
  • Health and wellness
  • Ad-tech
  • Banking and finance
  • Travel and tourism
  • Other end users (gaming and pet care)

By Region:

  • North America
    • US
    • Canada
  • Europe
    • UK
    • Germany
    • France
    • Rest of Europe                 
  • APAC
    • China
    • India
    • ANZ
    • Rest of APAC
  • MEA
    • Middle East
    • Africa
  • Latin America
    • Brazil
    • Mexico
    • Rest of Latin America

Recent Developments:

  • In November 2020, Launchmetrics acquired Parklu, a Chinese influencer analytics platform. The acquisition will help Launchmetrics develop a foothold in China as the country cements its dominance in the global luxury market.
  • In October 2020, Upfluence integrated its software with the Klaviyo marketing platform. It boosts eCommerce marketing processes by improving insight and targeting.
  • In March 2020,  IZEA Worldwide launched BrandGraph. BrandGraph is a social intelligence platform for social media marketers. The engine currently processes over 400 million pieces of content across over 4.5 million influencers globally.
  • In September 2019, Ahalogy, a Quotient brand, announced the launch of Rising Keywords, a new feature for its Muse platform. The feature will help predict future trends on social platforms.
  • In September 2019, Mavrck added a new content marketing specialty as a new capability to its influencer marketing platform to conduct Pinterest-based marketing programs.

Frequently Asked Questions (FAQ):


To speak to our analyst for a discussion on the above findings, click Speak to Analyst


TABLE OF CONTENTS

1 INTRODUCTION (Page No. - 22)
    1.1 INTRODUCTION TO COVID-19
    1.2 COVID-19 HEALTH ASSESSMENT
           FIGURE 1 COVID-19: GLOBAL PROPAGATION
           FIGURE 2 COVID-19 PROPAGATION: SELECT COUNTRIES
    1.3 COVID-19 ECONOMIC ASSESSMENT
           FIGURE 3 REVISED GROSS DOMESTIC PRODUCT FORECASTS FOR SELECT G20 COUNTRIES IN 2020
           1.3.1 COVID-19 ECONOMIC IMPACT—SCENARIO ASSESSMENT
           FIGURE 4 FACTORS IMPACTING GLOBAL ECONOMY
           FIGURE 5 SCENARIOS IN TERMS OF RECOVERY OF GLOBAL ECONOMY
    1.4 OBJECTIVES OF THE STUDY
    1.5 MARKET DEFINITION
           1.5.1 INCLUSIONS AND EXCLUSIONS
    1.6 MARKET SCOPE
           1.6.1 MARKET SEGMENTATION
           1.6.2 REGIONS COVERED
           1.6.3 YEARS CONSIDERED FOR THE STUDY
    1.7 CURRENCY CONSIDERED
    1.8 STAKEHOLDERS
    1.9 SUMMARY OF CHANGES

2 RESEARCH METHODOLOGY (Page No. - 32)
    2.1 RESEARCH DATA
           FIGURE 6 GLOBAL INFLUENCER MARKETING PLATFORM MARKET: RESEARCH DESIGN
           2.1.1 SECONDARY DATA
           2.1.2 PRIMARY DATA
                    2.1.2.1 Breakup of primary profiles
                    2.1.2.2 Key industry insights
           TABLE 1 PRIMARY INTERVIEWS
    2.2 MARKET BREAKUP AND DATA TRIANGULATION
           FIGURE 7 DATA TRIANGULATION
    2.3 MARKET SIZE ESTIMATION
           FIGURE 8 INFLUENCER MARKETING PLATFORM MARKET: MARKET ESTIMATION AND FORECAST METHODOLOGY
    2.4 MARKET FORECAST
           TABLE 2 FACTOR ANALYSIS
    2.5 COMPANY EVALUATION MATRIX RESEARCH METHODOLOGY
           TABLE 3 EVALUATION CRITERIA
           2.5.1 VENDOR INCLUSION CRITERIA
    2.6 ASSUMPTIONS FOR THE STUDY
    2.7 LIMITATIONS OF THE STUDY

3 EXECUTIVE SUMMARY (Page No. - 40)
           TABLE 4 GLOBAL INFLUENCER MARKETING PLATFORM MARKET SIZE AND GROWTH RATE, 2016–2019 (USD MILLION, Y-O-Y%)
           TABLE 5 GLOBAL MARKET SIZE AND GROWTH RATE, 2019–2025 (USD MILLION, Y-O-Y%)
           FIGURE 9 SOLUTION SEGMENT TO HOLD LARGER MARKET SIZE IN 2020
           FIGURE 10 SEARCH AND DISCOVERY SEGMENT TO HOLD LARGEST MARKET SIZE IN 2020
           FIGURE 11 CONSULTING SERVICES SEGMENT TO HOLD LARGEST MARKET SHARE IN 2020
           FIGURE 12 LARGE ENTERPRISES SEGMENT TO HOLD LARGER MARKET SHARE IN 2020
           FIGURE 13 FASHION AND LIFESTYLE END SEGMENT TO HOLD LARGEST MARKET SIZE IN 2020
           FIGURE 14 NORTH AMERICA TO HOLD LARGEST MARKET SHARE IN 2020

4 PREMIUM INSIGHTS (Page No. - 45)
    4.1 ATTRACTIVE OPPORTUNITIES IN INFLUENCER MARKETING PLATFORM MARKET
           FIGURE 15 INCREASING PENETRATION OF 5G TECHNOLOGY TO BOOST MARKET GROWTH
    4.2 MARKET, BY APPLICATION
           FIGURE 16 SEARCH AND DISCOVERY SEGMENT TO HOLD LARGEST MARKET SIZE DURING FORECAST PERIOD
    4.3 MARKET, BY REGION
           FIGURE 17 NORTH AMERICA TO HOLD LARGEST MARKET SHARE IN 2020
    4.4 MARKET, TOP THREE APPLICATIONS AND END USERS
           FIGURE 18 SEARCH AND DISCOVERY SEGMENT AND FASHION AND LIFESTYLE END USER TO HOLD LARGEST MARKET SHARES IN 2020

5 MARKET OVERVIEW AND INDUSTRY TRENDS (Page No. - 48)
    5.1 INTRODUCTION
    5.2 MARKET DYNAMICS
           FIGURE 19 DRIVERS, RESTRAINTS, OPPORTUNITIES, AND CHALLENGES: INFLUENCER MARKETING PLATFORM MARKET
           5.2.1 DRIVERS
                    5.2.1.1 Customers’ shift toward video-based content across the OTT space
                    5.2.1.2 Increase in adoption of ad-blocking software
           5.2.2 RESTRAINTS
                    5.2.2.1 Lack of capabilities to measure campaign effectiveness
           5.2.3 OPPORTUNITIES
                    5.2.3.1 Influencer marketing platform to gain customer trust and create new brand image
                    5.2.3.2 Influencer marketing to increase demand for big data analytics, AI, and ML
           5.2.4 CHALLENGES
                    5.2.4.1 Increase in the number of fake followers
           5.2.5 CUMULATIVE GROWTH ANALYSIS
    5.3 INDUSTRY TRENDS
           5.3.1 EVOLUTION
           FIGURE 20 EVOLUTION OF INFLUENCER MARKETING PLATFORM
    5.4 ECOSYSTEM
           FIGURE 21 ECOSYSTEM OF INFLUENCER MARKETING PLATFORM
    5.5 INFLUENCER MARKETING PLATFORM MARKET: COVID-19 IMPACT
           FIGURE 22 MARKET TO DECLINE BETWEEN 2020 AND 2021
    5.6 CASE STUDY ANALYSIS
           5.6.1 USE CASE 1: MICHELIN USED TRAACKR TO LAUNCH BRAND AWARENESS CAMPAIGN WITH INFLUENCERS DURING COVID-19
           5.6.2 USE CASE 2: KLEAR HELPED NUUN TO SAVE SIX HOURS OF WEEKLY INFLUENCER MANAGEMENT WORK
           5.6.3 USE CASE 3: LOVESAC USED ASPIREIQ’S CONNECT TOOL TO BUILD ORGANIC INFLUENCER RELATIONSHIPS
           5.6.4 USE CASE 4: WALMART USED LINQIA INFLUENCER MARKETING PLATFORM TO EXPAND ITS SUBSCRIPTION BASE
           5.6.5 USE CASE 5: ONEPLUS USED BRANDWATCH TO ADD CONTEXT TO THEIR BRAND TRACKING
           5.6.6 USE CASE 6: ABU DHABI’S DEPARTMENT OF CULTURE AND TOURISM PARTNERED WITH HOOTSUITE AND BRANDWATCH TO BOOST ITS TOURISM USING SOCIAL MEDIA
    5.7 VALUE CHAIN ANALYSIS
           FIGURE 23 VALUE CHAIN ANALYSIS
    5.8 TECHNOLOGY ANALYSIS
           5.8.1 ARTIFICIAL INTELLIGENCE/MACHINE LEARNING AND INFLUENCER MARKETING PLATFORM
           5.8.2 5G AND INFLUENCER MARKETING PLATFORM
           5.8.3 NATURAL LANGUAGE PROCESSING AND INFLUENCER MARKETING PLATFORM
           5.8.4 BLOCKCHAIN AND INFLUENCER MARKETING PLATFORM
    5.9 PATENT ANALYSIS
           5.9.1 PATENTS FILED: INFLUENCER MARKETING PLATFORM, BY END USER, 2019–2020
    5.1 REGULATORY IMPLICATIONS
           5.10.1 FEDERAL TRADE COMMISSION
           5.10.2 GENERAL DATA PROTECTION REGULATION
           5.10.3 GOVERNANCE, RISK, AND COMPLIANCE STANDARDS
           5.10.4 HEALTH INFORMATION TECHNOLOGY FOR ECONOMIC AND CLINICAL HEALTH
           5.10.5 HEALTH INSURANCE PORTABILITY AND ACCOUNTABILITY ACT

6 INFLUENCER MARKETING PLATFORM MARKET, BY COMPONENT (Page No. - 62)
    6.1 INTRODUCTION
           6.1.1 COMPONENTS: MARKET DRIVERS
           6.1.2 COMPONENTS: COVID-19 IMPACT
           FIGURE 24 SERVICES SEGMENT TO REGISTER HIGHER CAGR DURING FORECAST PERIOD
           TABLE 6 MARKET SIZE, BY COMPONENT, 2016–2019 (USD MILLION)
           TABLE 7 MARKET SIZE, BY COMPONENT, 2019–2025 (USD MILLION)
    6.2 SOLUTION
           TABLE 8 SOLUTION: MARKET SIZE, BY REGION, 2016–2019 (USD MILLION)
           TABLE 9 SOLUTION: MARKET SIZE, BY REGION, 2019–2025 (USD MILLION)
    6.3 SERVICES
           FIGURE 25 SUPPORT AND MAINTENANCE SEGMENT TO GROW AT HIGHEST CAGR DURING FORECAST PERIOD
           TABLE 10 SERVICES: MARKET SIZE, BY REGION, 2016–2019 (USD MILLION)
           TABLE 11 SERVICES: MARKET SIZE, BY REGION, 2019–2025 (USD MILLION)
           TABLE 12 INFLUENCER MARKETING PLATFORM MARKET SIZE, BY SERVICE, 2016–2019 (USD MILLION)
           TABLE 13 MARKET SIZE, BY SERVICE, 2019–2025 (USD MILLION)
           6.3.1 CONSULTING
           TABLE 14 CONSULTING: MARKET SIZE, BY REGION, 2016–2019 (USD MILLION)
           TABLE 15 CONSULTING: MARKET SIZE, BY REGION, 2019–2025 (USD MILLION)
           6.3.2 DEPLOYMENT AND INTEGRATION
           TABLE 16 DEPLOYMENT AND INTEGRATION: MARKET SIZE, BY REGION, 2016–2019 (USD MILLION)
           TABLE 17 DEPLOYMENT AND INTEGRATION: MARKET SIZE, BY REGION, 2019–2025 (USD MILLION)
           6.3.3 SUPPORT AND MAINTENANCE
           TABLE 18 SUPPORT AND MAINTENANCE: MARKET SIZE, BY REGION, 2016–2019 (USD MILLION)
           TABLE 19 SUPPORT AND MAINTENANCE: MARKET SIZE, BY REGION, 2019–2025 (USD MILLION)

7 INFLUENCER MARKETING PLATFORM MARKET, BY APPLICATION (Page No. - 72)
    7.1 INTRODUCTION
           7.1.1 APPLICATIONS: MARKET DRIVERS
           7.1.2 APPLICATIONS: COVID-19 IMPACT
           FIGURE 26 INFLUENCER RELATIONSHIP MANAGEMENT SEGMENT TO REGISTER HIGHEST CAGR DURING FORECAST PERIOD
           TABLE 20 MARKET SIZE, BY APPLICATION,2016–2019 (USD MILLION)
           TABLE 21 MARKET SIZE, BY APPLICATION, 2019–2025 (USD MILLION)
    7.2 SEARCH AND DISCOVERY
           TABLE 22 SEARCH AND DISCOVERY: MARKET SIZE, BY REGION, 2016–2019 (USD MILLION)
           TABLE 23 SEARCH AND DISCOVERY: MARKET SIZE, BY REGION, 2019–2025 (USD MILLION)
    7.3 CAMPAIGN MANAGEMENT
           TABLE 24 CAMPAIGN MANAGEMENT: MARKET SIZE, BY REGION, 2016–2019 (USD MILLION)
           TABLE 25 CAMPAIGN MANAGEMENT: MARKET SIZE, BY REGION, 2019–2025 (USD MILLION)
    7.4 INFLUENCER RELATIONSHIP MANAGEMENT
           TABLE 26 INFLUENCER RELATIONSHIP MANAGEMENT: MARKET SIZE, BY REGION, 2016–2019 (USD MILLION)
           TABLE 27 INFLUENCER RELATIONSHIP MANAGEMENT: INFLUENCER MARKETING PLATFORM MARKET SIZE, BY REGION, 2019–2025 (USD MILLION)
    7.5 ANALYTICS AND REPORTING
           TABLE 28 ANALYTICS AND REPORTING: MARKET SIZE, BY REGION, 2016–2019 (USD MILLION)
           TABLE 29 ANALYTICS AND REPORTING: MARKET SIZE, BY REGION, 2019–2025 (USD MILLION)
    7.6 COMPLIANCE MANAGEMENT AND FRAUD DETECTION
           TABLE 30 COMPLIANCE MANAGEMENT AND FRAUD DETECTION: MARKET SIZE, BY REGION, 2016–2019 (USD MILLION)
           TABLE 31 COMPLIANCE MANAGEMENT AND FRAUD DETECTION: MARKET SIZE, BY REGION, 2019–2025 (USD MILLION)
    7.7 OTHERS
           TABLE 32 OTHER APPLICATIONS: MARKET SIZE, BY REGION, 2016–2019 (USD MILLION)
           TABLE 33 OTHER APPLICATIONS: MARKET SIZE, BY REGION, 2019–2025 (USD MILLION)

8 MARKETING PLATFORM MARKET, BY ORGANIZATION SIZE (Page No. - 82)
    8.1 INTRODUCTION
           8.1.1 ORGANIZATION SIZE: INFLUENCER MARKETING PLATFORM MARKET DRIVERS
           8.1.2 ORGANIZATION SIZE: COVID-19 IMPACT
           FIGURE 27 LARGE ENTERPRISES SEGMENT TO REGISTER HIGHER CAGR DURING FORECAST PERIOD
           TABLE 34 MARKET SIZE, BY ORGANIZATION SIZE, 2016–2019 (USD MILLION)
           TABLE 35 MARKET SIZE, BY ORGANIZATION SIZE, 2019–2025 (USD MILLION)
    8.2 LARGE ENTERPRISES
           TABLE 36 LARGE ENTERPRISES: MARKET SIZE, BY REGION, 2016–2019 (USD MILLION)
           TABLE 37 LARGE ENTERPRISES: MARKET SIZE, BY REGION, 2019–2025 (USD MILLION)
    8.3 SMALL AND MEDIUM-SIZED ENTERPRISES
           TABLE 38 SMALL AND MEDIUM-SIZED ENTERPRISES: MARKET SIZE, BY REGION, 2016–2019 (USD MILLION)
           TABLE 39 SMALL AND MEDIUM-SIZED ENTERPRISES: MARKET SIZE, BY REGION, 2019–2025 (USD MILLION)

9 INFLUENCER MARKETING PLATFORM MARKET, BY END USER (Page No. - 87)
    9.1 INTRODUCTION
           9.1.1 END USERS: MARKET DRIVERS
           9.1.2 END USERS: COVID-19 IMPACT
           9.1.3 INFLUENCER MARKETING PLATFORM: ENTERPRISE USE CASES
           FIGURE 28 HEALTH AND WELLNESS SEGMENT TO GROW AT HIGHEST CAGR DURING FORECAST PERIOD
           TABLE 40 MARKET SIZE, BY END USER, 2016–2019 (USD MILLION)
           TABLE 41 MARKET SIZE, BY END USER, 2019–2025 (USD MILLION)
    9.2 FASHION AND LIFESTYLE
           TABLE 42 FASHION AND LIFESTYLE: USE CASES
           TABLE 43 FASHION AND LIFESTYLE: MARKET SIZE, BY REGION, 2016–2019 (USD MILLION)
           TABLE 44 FASHION AND LIFESTYLE: MARKET SIZE, BY REGION, 2019–2025 (USD MILLION)
    9.3 AGENCIES AND PUBLIC RELATIONS
           TABLE 45 AGENCIES AND PR: USE CASES
           TABLE 46 AGENCIES AND PR: MARKET SIZE, BY REGION, 2016–2019 (USD MILLION)
           TABLE 47 AGENCIES AND PR: MARKET SIZE, BY REGION, 2019–2025 (USD MILLION)
    9.4 RETAIL AND CONSUMER GOODS
           TABLE 48 RETAIL AND CONSUMER GOODS: USE CASES
           TABLE 49 RETAIL AND CONSUMER GOODS: INFLUENCER MARKETING PLATFORM MARKET SIZE, BY REGION, 2016–2019 (USD MILLION)
           TABLE 50 RETAIL AND CONSUMER GOODS: MARKET SIZE, BY REGION, 2019–2025 (USD MILLION)
    9.5 HEALTH AND WELLNESS
           TABLE 51 HEALTH AND WELLNESS: USE CASES
           TABLE 52 HEALTH AND WELLNESS: MARKET SIZE, BY REGION, 2016–2019 (USD MILLION)
           TABLE 53 HEALTH AND WELLNESS: MARKET SIZE, BY REGION, 2019–2025 (USD MILLION)
    9.6 AD-TECH
           TABLE 54 AD-TECH: USE CASES
           TABLE 55 AD-TECH: MARKET SIZE, BY REGION, 2016–2019 (USD MILLION)
           TABLE 56 AD-TECH: MARKET SIZE, BY REGION, 2019–2025 (USD MILLION)
    9.7 BANKING AND FINANCE
           TABLE 57 BANKING AND FINANCE: USE CASES
           TABLE 58 BANKING AND FINANCE: MARKET SIZE, BY REGION, 2016–2019 (USD MILLION)
           TABLE 59 BANKING AND FINANCE: MARKET SIZE, BY REGION, 2019–2025 (USD MILLION)
    9.8 TRAVEL AND TOURISM
           TABLE 60 TRAVEL AND TOURISM: USE CASES
           TABLE 61 TRAVEL AND TOURISM: INFLUENCER MARKETING PLATFORM MARKET SIZE, BY REGION, 2016–2019 (USD MILLION)
           TABLE 62 TRAVEL AND TOURISM: MARKET SIZE, BY REGION, 2019–2025 (USD MILLION)
    9.9 OTHERS
           TABLE 63 OTHERS: USE CASES
           TABLE 64 OTHERS: MARKET SIZE, BY REGION, 2016–2019 (USD MILLION)
           TABLE 65 OTHERS: MARKET SIZE, BY REGION, 2019–2025 (USD MILLION)

10 INFLUENCER MARKETING PLATFORM MARKET, BY REGION (Page No. - 103)
     10.1 INTRODUCTION
           FIGURE 29 GERMANY TO ACCOUNT FOR HIGHEST CAGR DURING FORECAST PERIOD
           FIGURE 30 ASIA PACIFIC TO ACCOUNT FOR HIGHEST CAGR DURING FORECAST PERIOD
           TABLE 66 MARKET SIZE, BY REGION, 2016–2019 (USD MILLION)
           TABLE 67 MARKET SIZE, BY REGION, 2019–2025 (USD MILLION)
     10.2 NORTH AMERICA
             10.2.1 NORTH AMERICA: MARKET DRIVERS
             10.2.2 NORTH AMERICA: COVID-19 IMPACT
             10.2.3 NORTH AMERICA: REGULATIONS
                        10.2.3.1 Federal Trade Commission
                        10.2.3.2 Advertising Standards Canada
                        10.2.3.3 The Competition Act
           FIGURE 31 NORTH AMERICA: MARKET SNAPSHOT
           TABLE 68 NORTH AMERICA: INFLUENCER MARKETING PLATFORM MARKET SIZE, BY COMPONENT, 2016–2019 (USD MILLION)
           TABLE 69 NORTH AMERICA: MARKET SIZE, BY COMPONENT, 2019–2025 (USD MILLION)
           TABLE 70 NORTH AMERICA: MARKET SIZE, BY SERVICE, 2016–2019 (USD MILLION)
           TABLE 71 NORTH AMERICA: MARKET SIZE, BY SERVICE, 2019–2025 (USD MILLION)
           TABLE 72 NORTH AMERICA: MARKET SIZE, BY APPLICATION, 2016–2019 (USD MILLION)
           TABLE 73 NORTH AMERICA: MARKET SIZE, BY APPLICATION, 2019–2025 (USD MILLION)
           TABLE 74 NORTH AMERICA: MARKET SIZE,BY ORGANIZATION SIZE, 2016–2019 (USD MILLION)
           TABLE 75 NORTH AMERICA: MARKET SIZE, BY ORGANIZATION SIZE, 2019–2025 (USD MILLION)
           TABLE 76 NORTH AMERICA: MARKET SIZE, BY END USER, 2016–2019 (USD MILLION)
           TABLE 77 NORTH AMERICA: MARKET SIZE, BY END USER, 2019–2025 (USD MILLION)
           TABLE 78 NORTH AMERICA: MARKET SIZE, BY COUNTRY, 2016–2019 (USD MILLION)
           TABLE 79 NORTH AMERICA: MARKET SIZE, BY COUNTRY, 2019–2025 (USD MILLION)
             10.2.4 UNITED STATES
             10.2.5 CANADA
     10.3 EUROPE
             10.3.1 EUROPE: INFLUENCER MARKETING PLATFORM MARKET DRIVERS
             10.3.2 EUROPE: COVID-19 IMPACT
             10.3.3 EUROPE: REGULATIONS
                        10.3.3.1 Competition and Markets Authority
                        10.3.3.2 Advertising Standards Authority
                        10.3.3.3 Dutch Advertising Code
           TABLE 80 EUROPE: MARKET SIZE, BY COMPONENT, 2016–2019 (USD MILLION)
           TABLE 81 EUROPE: MARKET SIZE, BY COMPONENT, 2019–2025 (USD MILLION)
           TABLE 82 EUROPE: MARKET SIZE, BY SERVICE, 2016–2019 (USD MILLION)
           TABLE 83 EUROPE: MARKET SIZE, BY SERVICE, 2019–2025 (USD MILLION)
           TABLE 84 EUROPE: MARKET SIZE, BY APPLICATION, 2016–2019 (USD MILLION)
           TABLE 85 EUROPE: MARKET SIZE, BY APPLICATION, 2019–2025 (USD MILLION)
           TABLE 86 EUROPE: MARKET SIZE, BY ORGANIZATION SIZE, 2016–2019 (USD MILLION)
           TABLE 87 EUROPE: MARKET SIZE, BY ORGANIZATION SIZE, 2019–2025 (USD MILLION)
           TABLE 88 EUROPE: MARKET SIZE, BY END USER, 2016–2019 (USD MILLION)
           TABLE 89 EUROPE: MARKET SIZE, BY END USER, 2019–2025 (USD MILLION)
           TABLE 90 EUROPE: MARKET SIZE, BY COUNTRY, 2016–2019 (USD MILLION)
           TABLE 91 EUROPE: MARKET SIZE, BY COUNTRY, 2019–2025 (USD MILLION)
             10.3.4 UNITED KINGDOM
             10.3.5 GERMANY
             10.3.6 FRANCE
             10.3.7 REST OF EUROPE
     10.4 ASIA PACIFIC
             10.4.1 ASIA PACIFIC: INFLUENCER MARKETING PLATFORM MARKET DRIVERS
             10.4.2 ASIA PACIFIC: COVID-19 IMPACT
             10.4.3 ASIA PACIFIC: REGULATIONS
                        10.4.3.1 Advertising Standards Council of India
                        10.4.3.2 Advertisement Law of the People’s Republic of China
                        10.4.3.3 Consumers Association of Singapore
                        10.4.3.4 Australian Influencer Marketing Council
           FIGURE 32 ASIA PACIFIC: MARKET SNAPSHOT
           TABLE 92 ASIA PACIFIC: MARKET SIZE, BY COMPONENT, 2016–2019 (USD MILLION)
           TABLE 93 ASIA PACIFIC: MARKET SIZE, BY COMPONENT, 2019–2025 (USD MILLION)
           TABLE 94 ASIA PACIFIC: MARKET SIZE, BY SERVICE, 2016–2019 (USD MILLION)
           TABLE 95 ASIA PACIFIC: MARKET SIZE, BY SERVICE, 2019–2025 (USD MILLION)
           TABLE 96 ASIA PACIFIC: MARKET SIZE, BY APPLICATION, 2016–2019 (USD MILLION)
           TABLE 97 ASIA PACIFIC: MARKET SIZE, BY APPLICATION, 2019–2025 (USD MILLION)
           TABLE 98 ASIA PACIFIC: MARKET SIZE, BY ORGANIZATION SIZE, 2016–2019 (USD MILLION)
           TABLE 99 ASIA PACIFIC: MARKET SIZE, BY ORGANIZATION SIZE, 2019–2025 (USD MILLION)
           TABLE 100 ASIA PACIFIC: MARKET SIZE, BY END USER, 2016–2019 (USD MILLION)
           TABLE 101 ASIA PACIFIC: MARKET SIZE, BY END USER, 2019–2025 (USD MILLION)
           TABLE 102 ASIA PACIFIC: MARKET SIZE, BY COUNTRY, 2016–2019 (USD MILLION)
           TABLE 103 ASIA PACIFIC: MARKET SIZE, BY COUNTRY, 2019–2025 (USD MILLION)
             10.4.4 CHINA
             10.4.5 AUSTRALIA AND NEW ZEALAND
             10.4.6 INDIA
             10.4.7 REST OF ASIA PACIFIC
     10.5 MIDDLE EAST AND AFRICA
             10.5.1 MIDDLE EAST AND AFRICA: INFLUENCER MARKETING PLATFORM MARKET DRIVERS
             10.5.2 MIDDLE EAST AND AFRICA: COVID-19 IMPACT
             10.5.3 MIDDLE EAST AND AFRICA: REGULATIONS
                        10.5.3.1 National Media Council
                        10.5.3.2 Advertising Regulatory Board of South Africa
           TABLE 104 MIDDLE EAST AND AFRICA: MARKET SIZE, BY COMPONENT, 2016–2019 (USD MILLION)
           TABLE 105 MIDDLE EAST AND AFRICA: MARKET SIZE, BY COMPONENT, 2020–2025 (USD MILLION)
           TABLE 106 MIDDLE EAST AND AFRICA: MARKET SIZE, BY SERVICE, 2016–2019 (USD MILLION)
           TABLE 107 MIDDLE EAST AND AFRICA: MARKET SIZE, BY SERVICE, 2019–2025 (USD MILLION)
           TABLE 108 MIDDLE EAST AND AFRICA: MARKET SIZE, BY APPLICATION, 2016–2019 (USD MILLION)
           TABLE 109 MIDDLE EAST AND AFRICA: MARKET SIZE, BY APPLICATION, 2019–2025 (USD MILLION)
           TABLE 110 MIDDLE EAST AND AFRICA: MARKET SIZE, BY ORGANIZATION SIZE, 2016–2019 (USD MILLION)
           TABLE 111 MIDDLE EAST AND AFRICA: MARKET SIZE, BY ORGANIZATION SIZE, 2020–2025 (USD MILLION)
           TABLE 112 MIDDLE EAST AND AFRICA: MARKET SIZE, BY END USER, 2016–2019 (USD MILLION)
           TABLE 113 MIDDLE EAST AND AFRICA: MARKET SIZE, BY END USER, 2020–2025 (USD MILLION)
           TABLE 114 MIDDLE EAST AND AFRICA: MARKET SIZE, BY COUNTRY, 2016–2019 (USD MILLION)
           TABLE 115 MIDDLE EAST AND AFRICA: MARKET SIZE, BY COUNTRY, 2020–2025 (USD MILLION)
             10.5.4 MIDDLE EAST
             10.5.5 AFRICA
     10.6 LATIN AMERICA
             10.6.1 LATIN AMERICA: INFLUENCER MARKETING PLATFORM MARKET DRIVERS
             10.6.2 LATIN AMERICA: COVID-19 IMPACT
             10.6.3 LATIN AMERICA: REGULATIONS
                        10.6.3.1 Brazilian Advertising Self-Regulation Council
                        10.6.3.2 Brazilian Consumer Protection Code
           TABLE 116 LATIN AMERICA: MARKET SIZE, BY COMPONENT, 2016–2019 (USD MILLION)
           TABLE 117 LATIN AMERICA: MARKET SIZE, BY COMPONENT, 2020–2025 (USD MILLION)
           TABLE 118 LATIN AMERICA: MARKET SIZE, BY SERVICE, 2016–2019 (USD MILLION)
           TABLE 119 LATIN AMERICA: MARKET SIZE, BY SERVICE, 2019–2025 (USD MILLION)
           TABLE 120 LATIN AMERICA: MARKET SIZE, BY APPLICATION, 2016–2019 (USD MILLION)
           TABLE 121 LATIN AMERICA: MARKET SIZE, BY APPLICATION, 2019–2025 (USD MILLION)
           TABLE 122 LATIN AMERICA: MARKET SIZE, BY ORGANIZATION SIZE, 2016–2019 (USD MILLION)
           TABLE 123 LATIN AMERICA: MARKET SIZE, BY ORGANIZATION SIZE, 2020–2025 (USD MILLION)
           TABLE 124 LATIN AMERICA: MARKET SIZE, BY END USER, 2016–2019 (USD MILLION)
           TABLE 125 LATIN AMERICA: MARKET SIZE, BY END USER, 2020–2025 (USD MILLION)
           TABLE 126 LATIN AMERICA: MARKET SIZE, BY COUNTRY, 2016–2019 (USD MILLION)
           TABLE 127 LATIN AMERICA: MARKET SIZE, BY COUNTRY, 2020–2025 (USD MILLION)
             10.6.4 BRAZIL
             10.6.5 MEXICO
             10.6.6 REST OF LATIN AMERICA

11 COMPETITIVE LANDSCAPE (Page No. - 142)
     11.1 OVERVIEW
     11.2 MARKET EVALUATION FRAMEWORK
           FIGURE 33 MARKET EVALUATION FRAMEWORK
     11.3 MARKET SHARE, 2020
           FIGURE 34 IZEA WORLDWIDE TO LEAD INFLUENCER MARKETING PLATFORM MARKET IN 2020
     11.4 KEY MARKET DEVELOPMENTS
             11.4.1 NEW PRODUCT LAUNCHES AND PRODUCT ENHANCEMENTS
           TABLE 128 NEW PRODUCT LAUNCHES AND PRODUCT ENHANCEMENTS, 2019–2020
             11.4.2 BUSINESS EXPANSIONS
           TABLE 129 BUSINESS EXPANSIONS, 2018–2020
             11.4.3 MERGERS AND ACQUISITIONS
           TABLE 130 MERGERS AND ACQUISITIONS, 2019–2020
             11.4.4 PARTNERSHIPS, AGREEMENTS, CONTRACTS, AND COLLABORATIONS
           TABLE 131 PARTNERSHIPS, AGREEMENTS, CONTRACTS, AND COLLABORATIONS, 2019–2020
     11.5 COMPANY EVALUATION MATRIX
             11.5.1 COMPANY EVALUATION MATRIX DEFINITIONS AND METHODOLOGY
             11.5.2 MARKET RANKING ANALYSIS, BY COMPANY
           FIGURE 35 RANKING OF KEY PLAYERS, 2020
             11.5.3 STAR
             11.5.4 EMERGING LEADER
             11.5.5 PERVASIVE
             11.5.6 PARTICIPANT
           FIGURE 36 INFLUENCER MARKETING PLATFORM MARKET (GLOBAL), COMPANY EVALUATION MATRIX, 2020
     11.6 STARTUP/SME EVALUATION MATRIX, 2020
             11.6.1 PROGRESSIVE COMPANIES
             11.6.2 RESPONSIVE COMPANIES
             11.6.3 DYNAMIC COMPANIES
             11.6.4 STARTING BLOCKS
           FIGURE 37 INFLUENCER MARKETING PLATFORM MARKET (GLOBAL), STARTUP/SME EVALUATION MATRIX, 2020

12 COMPANY PROFILES (Page No. - 151)
     12.1 INTRODUCTION
(Business Overview, Solutions & Services, Key Insights, Recent Developments,, MnM View)* 
     12.2 IZEA WORLDWIDE
           FIGURE 38 IZEA WORLDWIDE: COMPANY SNAPSHOT
     12.3 QUOTIENT TECHNOLOGY
           FIGURE 39 QUOTIENT TECHNOLOGY: COMPANY SNAPSHOT
     12.4 LAUNCHMETRICS
     12.5 JULIUS
     12.6 TRAACKR
     12.7 UPFLUENCE
     12.8 KLEAR
     12.9 ASPIREIQ
     12.10 CREATORIQ
     12.11 MAVRCK
     12.12 IMPACT
     12.13 BRANDWATCH
     12.14 LINQIA
     12.15 ONALYTICA
     12.16 SOCIAL BEAT
     12.17 EXPERTVOICE
*Details on Business Overview, Solutions & Services, Key Insights, Recent Developments,  MnM View might not be captured in case of unlisted companies. 
     12.18 STARTUP/SME PROFILES
             12.18.1 LEFTY
             12.18.2 LUMANU
             12.18.3 INFLUENCERDB
             12.18.4 TAGGER
             12.18.5 HEEPSY
             12.18.6 FOURSTARZZ MEDIA
             12.18.7 JUULR
             12.18.8 INTELLIFLUENCE
             12.18.9 INSENSE
             12.18.10 TALENT VILLAGE
             12.18.11 THE ROOM
             12.18.12 BLOGMINT
             12.18.13 ZINE
             12.18.14 CAPTIV8

13 ADJACENT AND RELATED MARKETS (Page No. - 189)
     13.1 INTRODUCTION
     13.2 DIGITAL MARKETING SOFTWARE MARKET— GLOBAL FORECAST TO 2022
             13.2.1 MARKET DEFINITION
             13.2.2 MARKET OVERVIEW
           TABLE 132 DIGITAL MARKETING SOFTWARE MARKET SIZE AND GROWTH RATE, 2015–2022 (USD MILLION, Y-O-Y %)
                        13.2.2.1 Digital marketing software market, by component
           TABLE 133 DIGITAL MARKETING SOFTWARE MARKET SIZE, BY COMPONENT, 2015–2022 (USD MILLION)
           TABLE 134 SOFTWARE: DIGITAL MARKETING SOFTWARE MARKET SIZE, BY REGION, 2015–2022 (USD MILLION)
           TABLE 135 SERVICES: DIGITAL MARKETING SOFTWARE MARKET SIZE, BY REGION, 2015–2022 (USD MILLION)
                        13.2.2.2 Digital marketing software market, by software
           TABLE 136 DIGITAL MARKETING SOFTWARE MARKET SIZE, BY SOFTWARE, 2015–2022 (USD MILLION)
                        13.2.2.3 Digital marketing software market, by service
           TABLE 137 DIGITAL MARKETING SOFTWARE MARKET SIZE, BY SERVICE, 2015–2022 (USD MILLION)
           TABLE 138 PROFESSIONAL SERVICES: DIGITAL MARKETING SOFTWARE MARKET SIZE, BY TYPE, 2015–2022 (USD MILLION)
                        13.2.2.4 Digital marketing software market, by deployment type
           TABLE 139 DIGITAL MARKETING SOFTWARE MARKET SIZE, BY DEPLOYMENT TYPE, 2015–2022 (USD MILLION)
                        13.2.2.5 Digital marketing software market, by organization size
           TABLE 140 DIGITAL MARKETING SOFTWARE MARKET SIZE, BY ORGANIZATION SIZE, 2015–2022 (USD MILLION)
                        13.2.2.6 Digital marketing software market, by end user
           TABLE 141 DIGITAL MARKETING SOFTWARE MARKET SIZE, BY END USER, 2015–2022 (USD MILLION)
                        13.2.2.7 Digital marketing software market, by region
           TABLE 142 DIGITAL MARKETING SOFTWARE MARKET SIZE, BY REGION,2015–2022 (USD MILLION)
     13.3 CONTENT MARKETING SOFTWARE MARKET– GLOBAL FORECAST TO 2023
             13.3.1 MARKET DEFINITION
             13.3.2 MARKET OVERVIEW
           TABLE 143 CONTENT MARKETING SOFTWARE MARKET SIZE AND GROWTH RATE, 2016–2023 (USD MILLION, Y-O-Y %)
                        13.3.2.1 Content marketing software market, by component
           TABLE 144 CONTENT MARKETING SOFTWARE MARKET SIZE, BY COMPONENT, 2016–2023 (USD MILLION)
           TABLE 145 SOFTWARE: CONTENT MARKETING SOFTWARE MARKET SIZE, BY REGION, 2016–2023 (USD MILLION)
           TABLE 146 SERVICES: CONTENT MARKETING SOFTWARE MARKET SIZE, BY TYPE, 2016–2023 (USD MILLION)
                        13.3.2.2 Content marketing software market, by organization size
           TABLE 147 CONTENT MARKETING SOFTWARE MARKET SIZE, BY ORGANIZATION SIZE, 2016–2023 (USD MILLION)
                        13.3.2.3 Content marketing software market, by content type
           TABLE 148 CONTENT MARKETING SOFTWARE MARKET SIZE, BY CONTENT TYPE, 2016–2023 (USD MILLION)
                        13.3.2.4 Content marketing software market, by end user
           TABLE 149 CONTENT MARKETING SOFTWARE MARKET SIZE, BY END USER, 2016–2023 (USD MILLION)
                        13.3.2.5 Content marketing software market, by region
           TABLE 150 CONTENT MARKETING SOFTWARE MARKET SIZE, BY REGION, 2016–2023 (USD MILLION)

14 APPENDIX (Page No. - 200)
     14.1 DISCUSSION GUIDE
     14.2 KNOWLEDGE STORE: MARKETSANDMARKETS’ SUBSCRIPTION PORTAL
     14.3 AVAILABLE CUSTOMIZATIONS
     14.4 RELATED REPORTS
     14.5 AUTHOR DETAILS


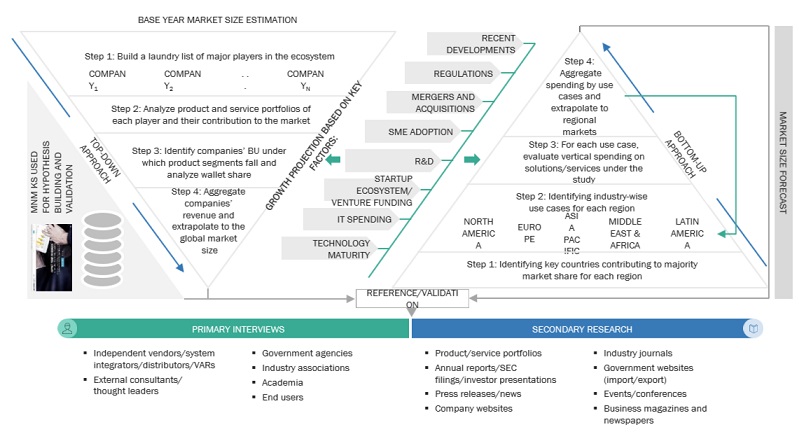
The study involved four major activities in estimating the current market size of the influencer marketing platform market. Extensive secondary research was done to collect information on the market, peer market, and parent market. The next step was to validate these findings, assumptions, and sizing with industry experts across the value chain through primary research. Both top-down and bottom-up approaches were used to estimate the total market size. After that, the market breakup and data triangulation procedures were used to estimate the market size of the segments and subsegments of the influencer marketing platform market.

Secondary Research

In the secondary research process, various sources were referred to for identifying and collecting information for the study. The secondary sources included annual reports, press releases, investor presentations of companies; white papers; journals; and certified publications and articles from recognized authors, directories, and databases.

Primary Research

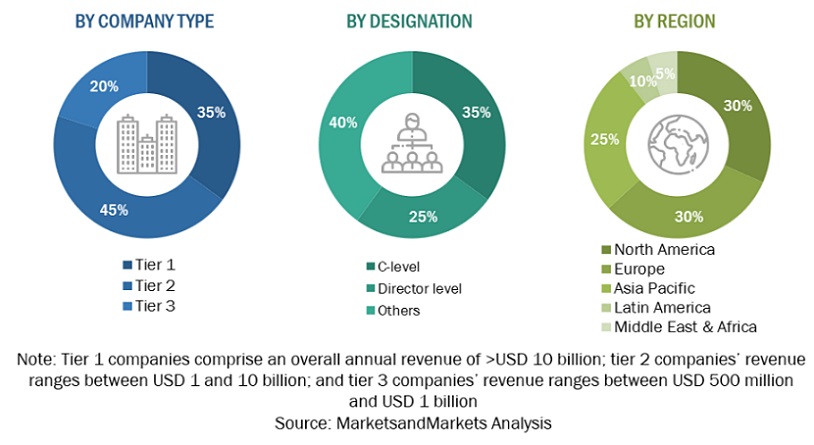
Various primary sources from both supply and demand sides were interviewed to obtain qualitative and quantitative information on the market. The primary sources from the supply side included various industry experts, including Chief X Officers (CXOs); Vice Presidents (VPs); directors from business development, marketing, and product development/innovation teams; related key executives from Influencer marketing platform solution vendors, system integrators, professional service providers, industry associations, and consultants; and key opinion leaders. All possible parameters that affect the market covered in this research study have been accounted for, viewed in extensive detail, verified through primary research, and analyzed to get the final quantitative and qualitative data.

The following is the breakup of primary profiles:
Influencer Marketing Platform Market  Size, and Share

To know about the assumptions considered for the study, download the pdf brochure

Market Size Estimation

Both top-down and bottom-up approaches were used to estimate and validate the total size of the Influencer marketing platform market. The top-down approach was used to derive the revenue contribution of top vendors and their offerings in the market. The bottom-up approach was used to arrive at the overall market size of the global influencer marketing platform market using key companies’ revenue and their offerings in the market. The research methodology used to estimate the market size includes the following:  

  • The key players in the market were identified through extensive secondary research.
  • The market size, in terms of value, was determined through primary and secondary research processes.
  • All percentages, shares, and breakups were determined using secondary sources and verified through primary sources.

Data Triangulation

After arriving at the overall market size using the market size estimation processes as explained above, the market was split into several segments and subsegments. To complete the overall market engineering process and arrive at the exact statistics of each market segment and subsegment, data triangulation, and market breakup procedures were employed, wherever applicable. The overall market size was then used in the top-down procedure to estimate the size of other individual markets via percentage splits of the market segmentation.

Report Objectives

  • To define, describe, and forecast the influencer marketing platform market by component (solution and services), application, end user, organization size, and region
  • To provide detailed information about the major factors (drivers, opportunities, restraints, and challenges) influencing the growth of the market
  • To analyze micromarkets1 with respect to individual growth trends, prospects, and contributions to the total market
  • To analyze the opportunities in the market for stakeholders by identifying the high-growth segments of the market
  • To forecast the market size of the segments with respect to five main regions: North America, Europe, Middle East and Africa (MEA), Asia Pacific (APAC), and Latin America
  • To profile the key players of the influencer marketing platform market and comprehensively analyze their market size and core competencies2 in the market
  • To track and analyze the competitive developments, such as new product launches and product upgradations; acquisitions, expansions, and partnerships, agreements, and collaborations, in the global market
  • To analyze the impact of the COVID-19 pandemic on the influencer marketing platform market

Available customizations

With the given market data, MarketsandMarkets offers customizations as per the company’s specific needs. The following customization options are available for the report:

Product analysis

  • Product matrix provides a detailed comparison of the product portfolio of each company

Geographic analysis

  • Further breakup of the North American Influencer marketing platform market
  • Further breakup of the European market
  • Further breakup of the APAC market
  • Further breakup of the Latin American market
  • Further breakup of the MEA market

Company information

  • Detailed analysis and profiling of additional market players up to 5
Custom Market Research Services

We will customize the research for you, in case the report listed above does not meet with your exact requirements. Our custom research will comprehensively cover the business information you require to help you arrive at strategic and profitable business decisions.

Request Customization
Report Code
TC 7191
Published ON
Dec, 2020
Choose License Type
BUY NOW
  • SHARE
X
Request Customization
Speak to Analyst
Speak to Analyst
OR FACE-TO-FACE MEETING
PERSONALIZE THIS RESEARCH
  • Triangulate with your Own Data
  • Get Data as per your Format and Definition
  • Gain a Deeper Dive on a Specific Application, Geography, Customer or Competitor
  • Any level of Personalization
REQUEST A FREE CUSTOMIZATION
LET US HELP YOU!
  • What are the Known and Unknown Adjacencies Impacting the Influencer Marketing Platform Market
  • What will your New Revenue Sources be?
  • Who will be your Top Customer; what will make them switch?
  • Defend your Market Share or Win Competitors
  • Get a Scorecard for Target Partners
CUSTOMIZED WORKSHOP REQUEST
+1-888-600-6441
  • Call Us
  • +1-888-600-6441 (Corporate office hours)
  • +1-888-600-6441 (US/Can toll free)
  • +44-800-368-9399 (UK office hours)
CONNECT WITH US
ABOUT TRUST ONLINE
©2023 MarketsandMarkets Research Private Ltd. All rights reserved
DMCA.com Protection Status Website Feedback