The study involved four major activities in estimating the market size of the ion exchange resins market. Exhaustive secondary research was done to collect information on the market, the peer market, and the parent market. The next step was to validate these findings, assumptions, and sizing with industry experts across the value chain through primary research. Both top-down and bottom-up approaches were employed to estimate the complete market size. Thereafter, the market breakdown and data triangulation procedures were used to estimate the market size of the segments and subsegments.
Secondary Research
In the secondary research process, various secondary sources have been referred to for identifying and collecting information for this study. These secondary sources include annual reports, press releases, investor presentations of companies, corporate documents, white papers, certified publications, trade directories, certified publications, articles from recognized authors, associations, gold standard and silver standard websites, and databases.
Secondary research has been used to obtain key information about the value chain of the industry, monetary chain of the market, the total pool of key players, market classification and segmentation according to industry trends to the bottom-most level, and regional markets. It was also used to obtain information about the key developments from a market-oriented perspective.
Primary Research
The ion exchange resins market comprises several stakeholders in the value chain, which include raw material suppliers, component manufacturers, manufacturers and end consumers. Various primary sources from the supply and demand sides of the ion exchange resins market have been interviewed to obtain qualitative and quantitative information. The primary interviewees from the demand side include key opinion leaders in end-use sectors. The primary sources from the supply side include manufacturers, associations, and institutions involved in the ion exchange resins industry.
Primary interviews were conducted to gather insights such as market statistics, data of revenue collected from the products and services, market breakdowns, market size estimations, market forecasting, and data triangulation. Primary research also helped in understanding the various trends related to type, application, end use industry and region. Stakeholders from the demand side, such as CIOs, CTOs, and CSOs were interviewed to understand the buyer’s perspective on the suppliers, products, component providers, and their current usage of ion exchange resins and future outlook of their business which will affect the overall market.
The breakdown of profiles of the primary interviewees is illustrated in the figure below:
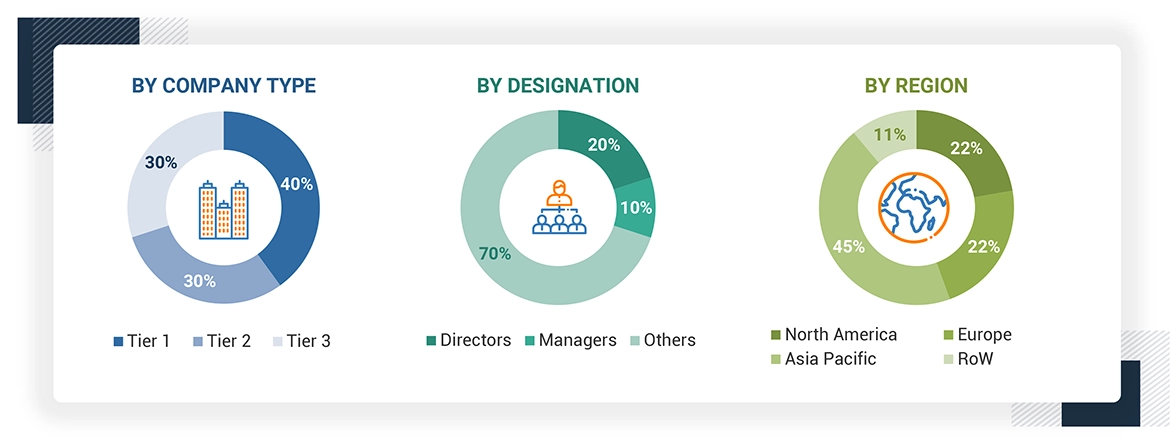
Note: Tier 1, Tier 2, and Tier 3 companies are classified based on their market revenue in 2023 available in the public domain, product portfolios, and geographical presence.
Other designations include sales representatives, production heads, and technicians.
To know about the assumptions considered for the study, download the pdf brochure
Market Size Estimation
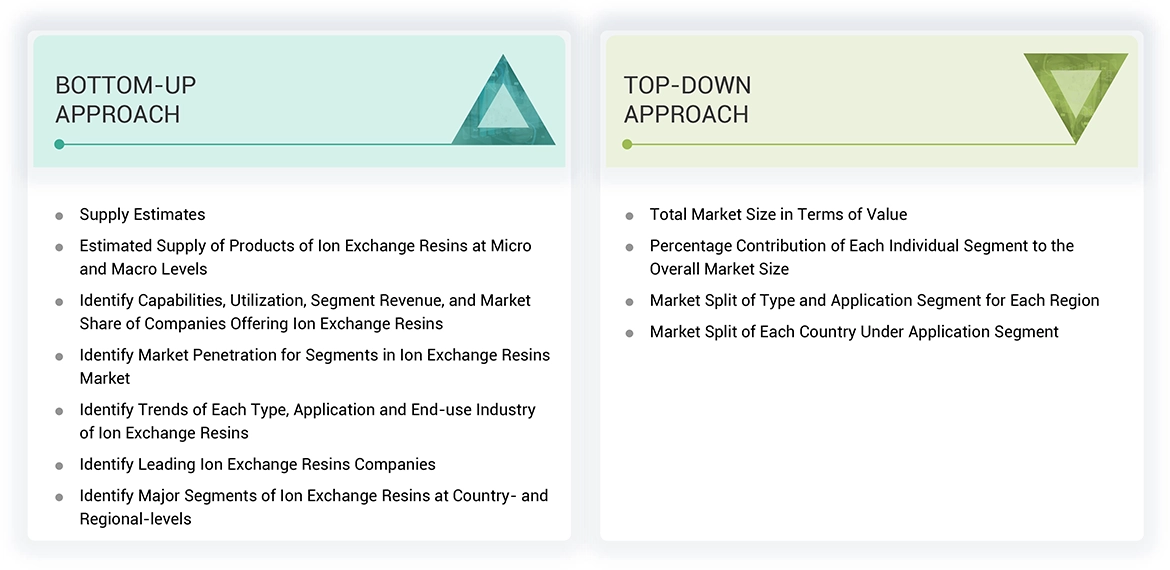
The top-down approach was used to estimate and validate the size of various submarkets for ion exchange resins for each region. The research methodology used to estimate the market size included the following steps:
-
The key players in the industry have been identified through extensive secondary research.
-
The supply chain of the industry has been determined through primary and secondary research.
-
The global market was then segmented into five major regions and validated by industry experts.
-
All percentage shares, splits, and breakdowns based on type, application, end use industry and region were determined using secondary sources and verified through primary sources.
-
All possible parameters that affect the markets covered in this research study were accounted for, viewed in extensive detail, verified through primary research, and analyzed to get the final quantitative and qualitative data. This data was consolidated and added with detailed inputs and analysis and presented in this report.
Source: Secondary Research, Interviews with Experts, and MarketsandMarkets Analysis
Data Triangulation
After arriving at the total market size from the estimation process of ion exchange resins above, the overall market has been split into several segments and sub-segments. To complete the overall market engineering process and arrive at the exact statistics for all the segments and sub-segments, the data triangulation and market breakdown procedures have been employed, wherever applicable. The data has been triangulated by studying various factors and trends from both the demand and supply sides. Along with this, the market size has been validated by using both the top-down and bottom-up approaches and primary interviews. Hence, for every data segment, there have been three sources—top-down approach, bottom-up approach, and expert interviews. The data was assumed correct when the values arrived from the three sources matched.
Market Definition
Ion exchange resins are insoluble polymers and are prepared by cross-linking polystyrenes that contain various functional groups. It acts as a medium for ion exchange reactions, consisting of a polymer matrix to which ion exchange sites are attached. Charged functional groups participate in these sites, attracting and facilitating ion-exchange with other ions carrying a different charge. Ion-exchange resins are usually used in the form of white or yellow porous microbead, membrane, or granular material, though other forms such as sheets are also used. Ion-exchange resins are of two major types, namely cation exchange resins, which attract positive ions, and anion exchange resins, which attract negative ions. Ion exchange resins find applications in various end use industries like power, chemical & petrochemical, food & beverage, pharmaceutical, electrical & electronics, metal & mining, among other industrial operations aimed at system efficiency, reduction of energy consumption, and extension of equipment life.
Stakeholders
-
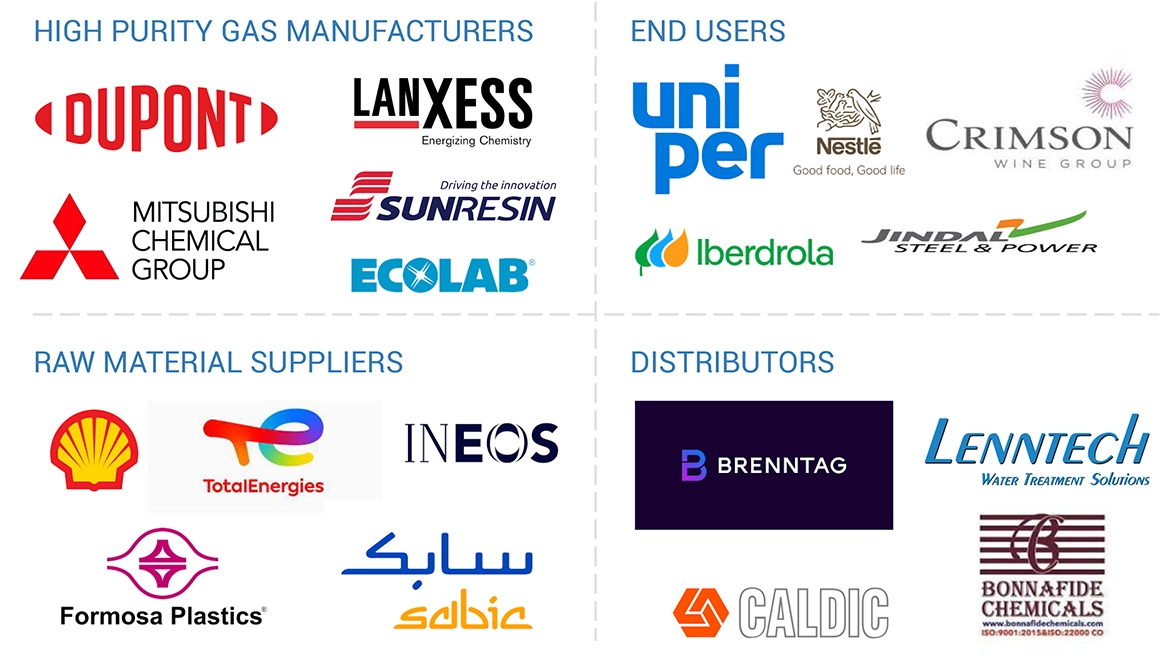
Ion exchange resins Manufacturers
-
Raw Material Suppliers
-
Manufacturing Technology Providers
-
Industry Associations
-
Manufacturers in End-Use Industries
Report Objectives
-
To define, describe, and forecast the size of the ion exchange resins market, in terms of value and volume.
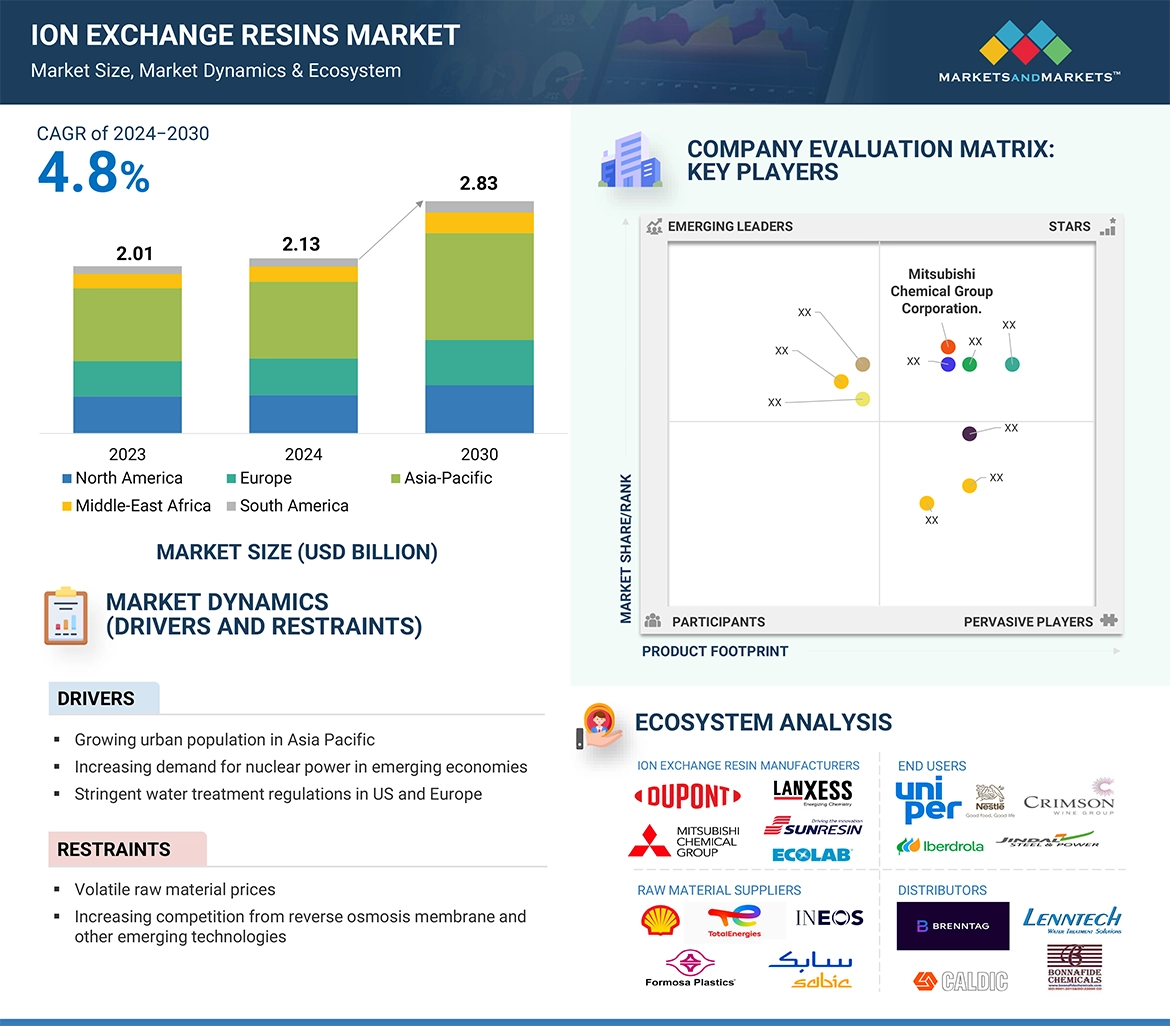
-
To provide detailed information regarding the major factors (drivers, opportunities, restraints, and challenges) influencing the growth of the market.
-
To estimate and forecast the market size based on type, application, end use industry, and region.
-
To forecast the size of the market with respect to major regions, namely, Europe, North America, Asia Pacific, Middle East & Africa, and South America, along with their key countries.
-
To strategically analyze micromarkets1 with respect to individual growth trends, prospects, and their contribution to the overall market.
-
To analyze opportunities in the market for stakeholders and provide a competitive landscape of market leaders.
-
To track and analyze recent developments such as expansions, new product launches, partnerships & agreements, and acquisitions in the market.
-
To strategically profile key market players and comprehensively analyze their core competencies.


 HIGHEST CAGR MARKET IN 2023
 INDIA FASTEST GROWING MARKET IN THE REGION
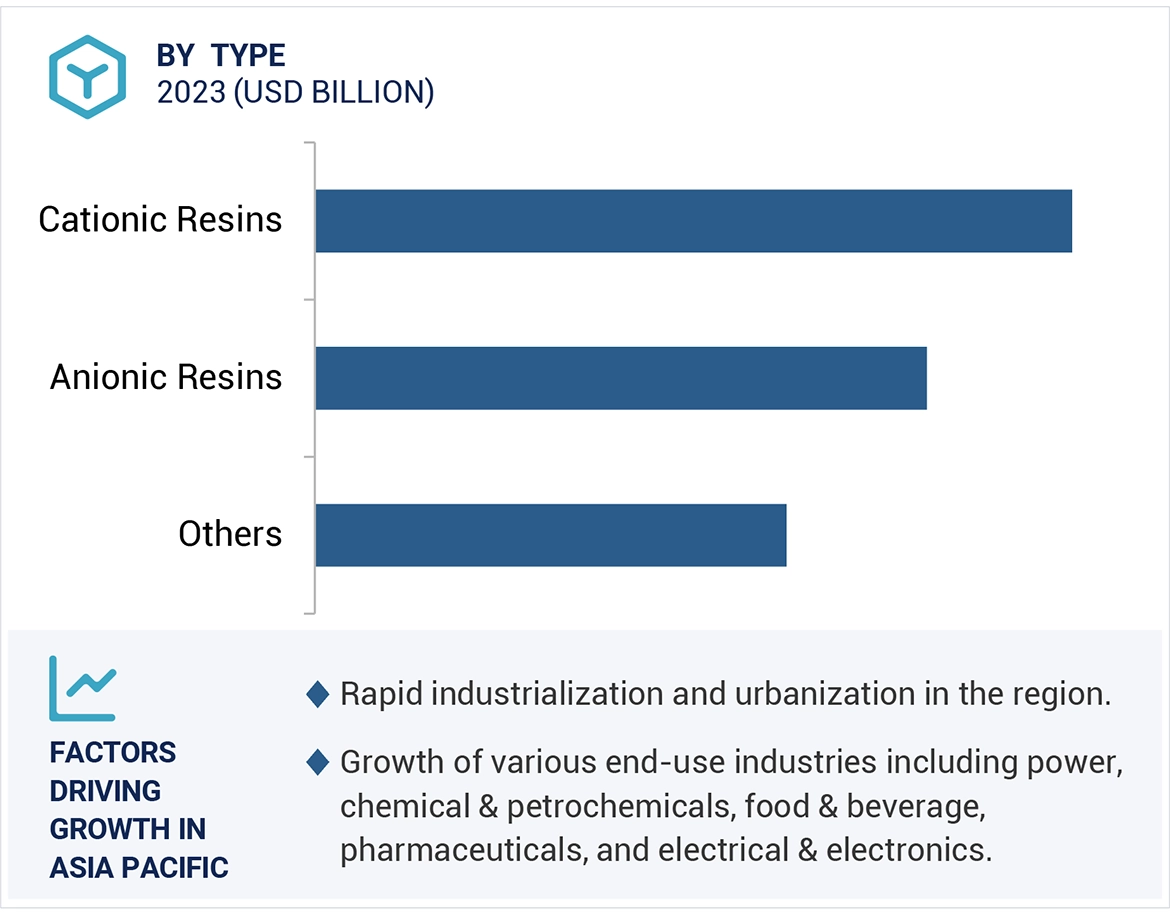


Shaghayegh
Oct, 2015
interested to know about ion exchange technology .
William
Jun, 2018
Resin type breakup, and company information for North America..
Marubini
Mar, 2019
Sample report on global ion exchange resins market.
Freda
Feb, 2019
General information on Ion Exchange materials Market.
Hartmut
Feb, 2016
General information on Ion Exchange Resins Market.
Atul
Aug, 2015
Interested in Ion Exchange Resins Market.
George
Feb, 2019
Interested in market size and growth of acid cation resin..
Bruno
Dec, 2018
Chile ion exchange resin market specific to mining & metallurgy applications..
Kalindi
Mar, 2018
Report title not mentioned.
Norberto
Mar, 2016
General information on Ion Exchange Resins in Germany, Austria, and Denmark.
Norberto
Mar, 2016
Specific interest on understanding market sixe for floating LNG power vessel market in Europe .
PATRICK
Aug, 2017
Information on Ion Exchange resin Market in Malaysia.
antonio
Apr, 2018
Interest pertaining to resins for demineralization, softening, and metal removal..