The study involves four major activities that estimate the size of the laser technology market. Exhaustive secondary research was conducted to collect information related to the market. Following this was validating these findings, assumptions, and sizing with the industry experts across the value chain through primary research. Both top-down and bottom-up approaches were employed to estimate the overall size of the laser market. Subsequently, market breakdown and data triangulation procedures were used to determine the extent of different segments and subsegments of the market.
Secondary Research
Secondary sources in this research study include corporate filings (such as annual reports, investor presentations, and financial statements); trade, business, and professional associations; white papers, certified publications, articles from recognized authors; directories; and databases. The secondary data were collected and analyzed to estimate the overall market size, further validated by primary research. The relevant data is collected from various secondary sources, it is analyzed to extract insights and information relevant to the market research objectives. This analysis has involved summarizing the data, identifying trends, and drawing conclusions based on the available information.
Primary Research
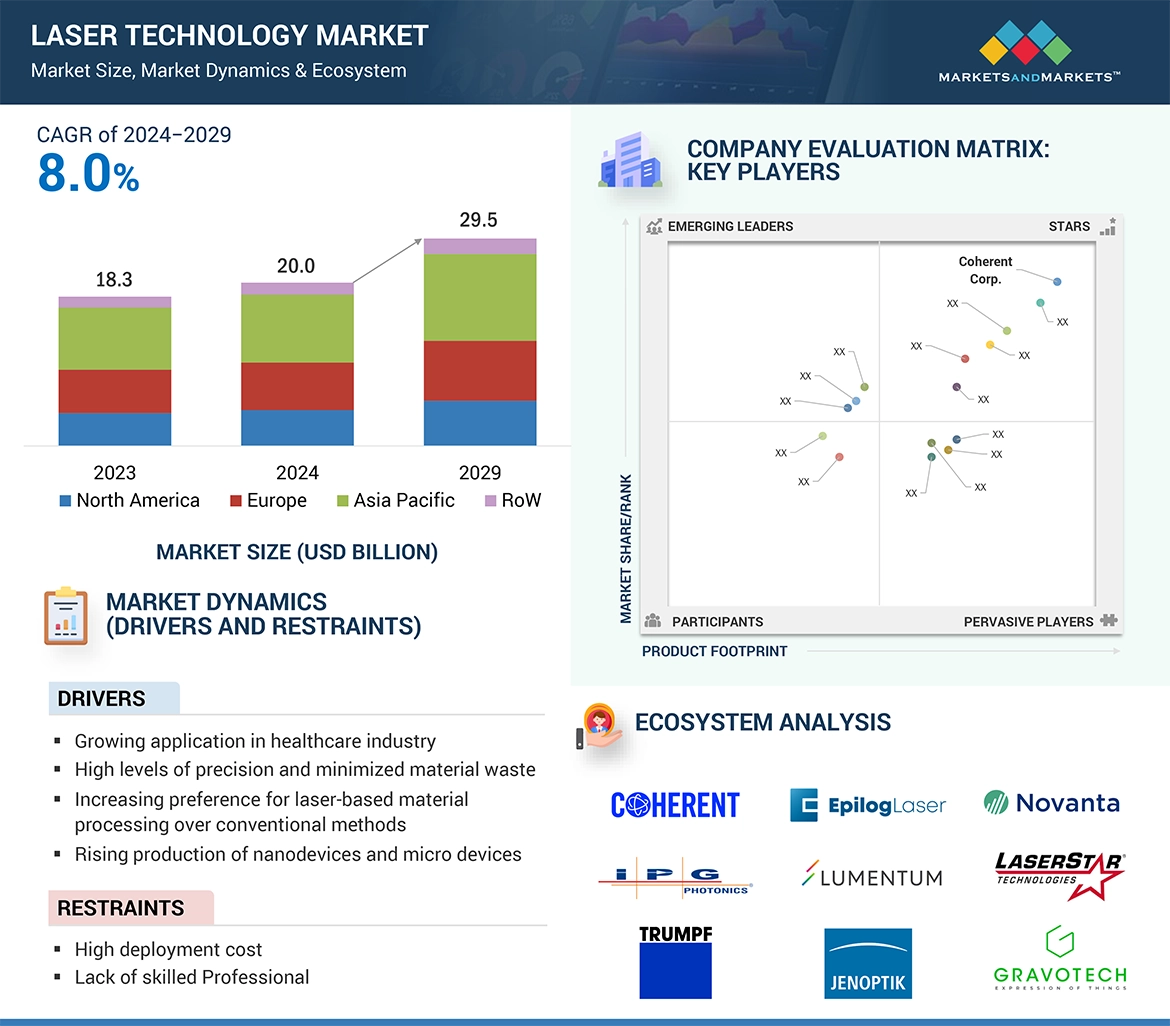
In the primary research process, numerous sources from both the supply and demand sides were interviewed to obtain qualitative and quantitative information about this report. The primary sources from the supply side included various industry experts such as Chief X Officers (CXOs), Vice Presidents (VPs), and Directors from business development, marketing, product development/innovation teams, and related key executives from laser technology providers, (such as Coherent, Trumpf, Han’s Laser Technology Industry Group Co., Ltd, IPG Photonics and Jenoptik AG) research organizations, distributors, professional and managed service providers, industry associations, and key opinion leaders. Approximately 25% of the primary interviews were conducted with the demand side and 75% with the supply side. These data were collected mainly through questionnaires, emails, and telephonic interviews, accounting for 80% of the primary interviews.
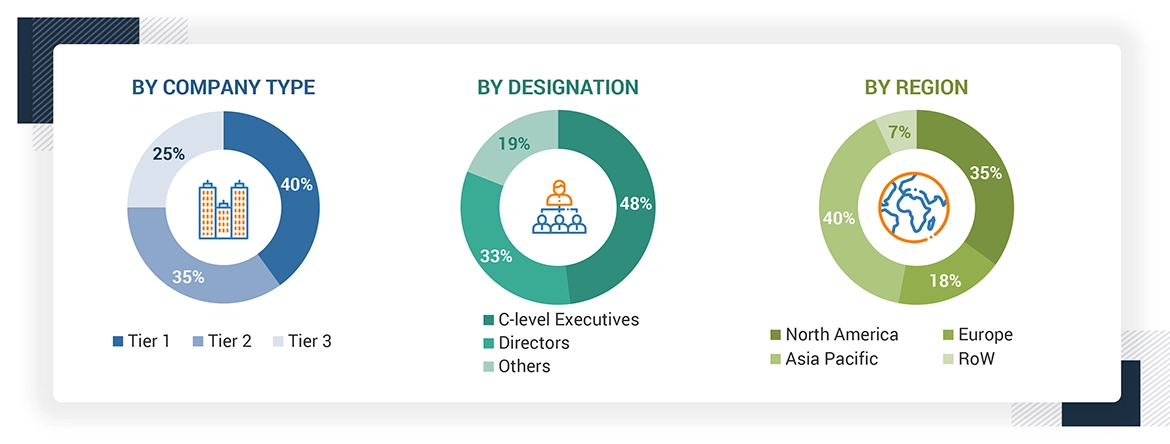
Note: Other designations include sales, marketing, and product managers.
The three tiers of the companies have been defined based on their total revenue as of 2022; tier 1: revenue greater than USD 20 million, tier 2: revenue between USD 20 million and USD 10 million, and tier 3: revenue less than USD 10 million.
To know about the assumptions considered for the study, download the pdf brochure
Market Size Estimation
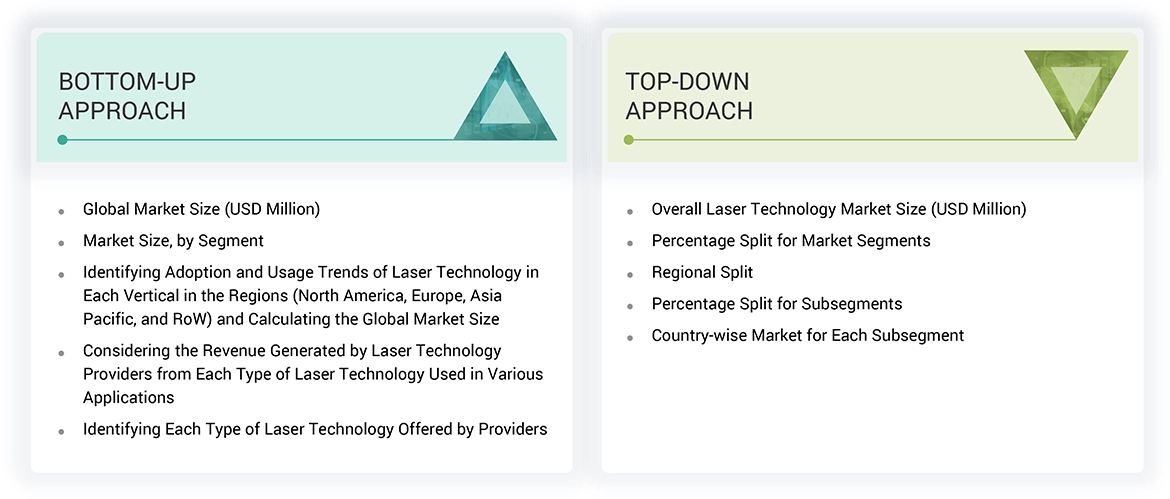
In the market engineering process, both top-down and bottom-up approaches were implemented, along with several data triangulation methods, to estimate and validate the size of the laser market and other dependent submarkets listed in this report.
Data Triangulation
After estimating the overall market size, the total market was split into several segments. The market breakdown and data triangulation procedures were employed wherever applicable to complete the overall market engineering process and gauge exact statistics for all segments. The data were triangulated by studying various factors and trends from both the demand and supply sides. The market was also validated using both top-down and bottom-up approaches.
Market Definition
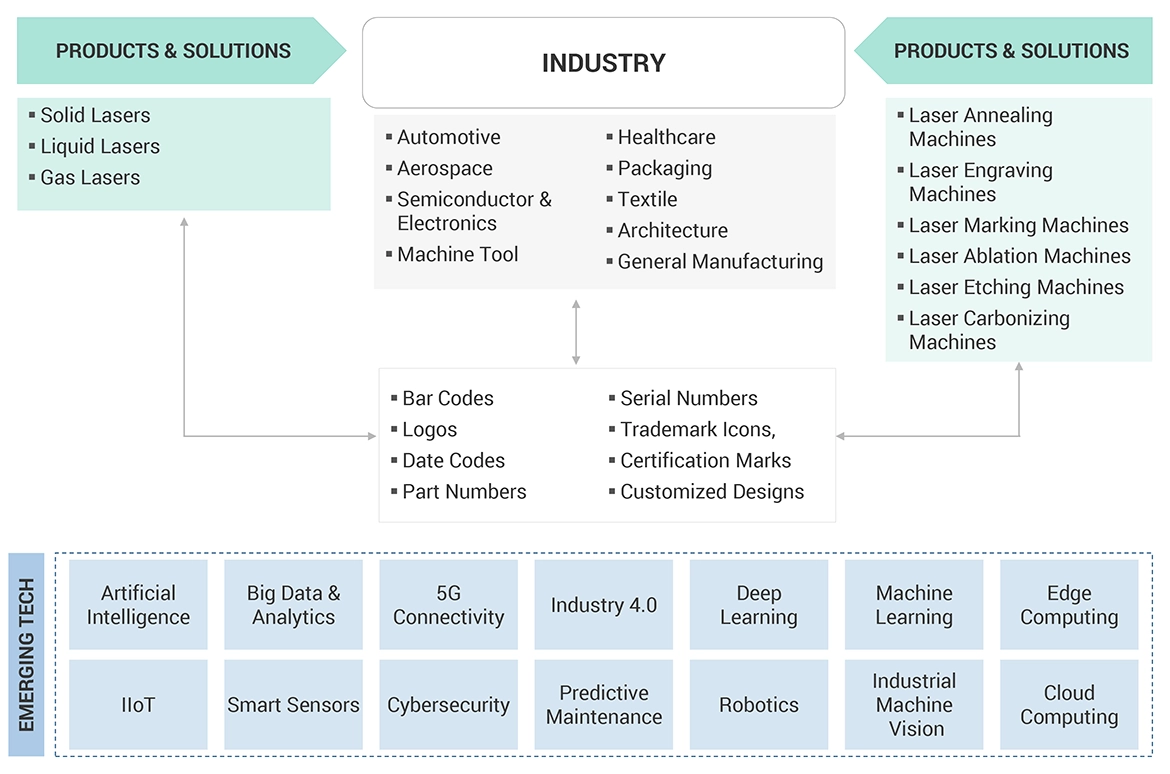
Laser stands for light amplification by stimulated emission of radiation (LASER). Laser technology-based devices generate a beam of light, which is coherent, monochromatic, and aligned. They generate light through optical amplification based on the stimulated emission of electromagnetic radiation. The wavelength of laser light is purer compared to other light sources. Unlike other light sources, all the photons that develop the laser beam have a fixed-phase relationship. The light beam generated from a laser source has low divergence. Laser technology-based systems find applications in optical communication, cutting, drilling, printing, and marking and engraving. The verticals that use laser technology include commercial, telecommunications, research, aerospace & defense, healthcare, automotive, semiconductor & electronics, industrial, and others (oil & gas, iron & steel, tobacco, glass, wood, retail, and plastics).
Stakeholders
-
End users
-
Government bodies, venture capitalists, and private equity firms
-
Laser technology manufacturers
-
Laser technology distributors
-
Laser technology industry associations
-
Professional service/solution providers
-
Research institutions and organizations
-
Standards organizations and regulatory authorities related to the laser market
-
System integrators
-
Technology consultants
Report Objectives
-
To define, describe, and project the size of the global laser technology market, in terms of value, segmented based on laser type, application, product, vertical and region
-
To forecast the market size for various segments with respect to four main regions—North America, Europe, Asia Pacific, and Rest of the World (RoW)s
-
To provide detailed information regarding the major factors (drivers, restraints, opportunities, and industry-specific challenges) influencing the growth of the market
-
To analyze the micro markets with respect to individual growth trends, prospects, and contributions to the total market
-
To profile the key market players, and comprehensively analyze their market ranking and core competencies.
-
To analyze competitive developments, such as joint ventures, mergers & acquisitions, product launches, and research & development (R&D) activities, in the laser market
-
To provide the leadership mapping based on company profiles and key player strategies such as product launches and development, collaborations, expansions, and acquisitions
-
To analyze the opportunities in the market for stakeholders and provide a detailed competitive landscape of the market
-
To provide ecosystem analysis, case study analysis, patent analysis, pricing analysis, Porter’s five forces analysis, key stakeholders & buying criteria, key conferences and events, and regulatory bodies, government agencies, and regulations pertaining to the market under study


 HIGHEST CAGR MARKET IN 2024
 CHINA FASTEST GROWING MARKET IN THE REGION
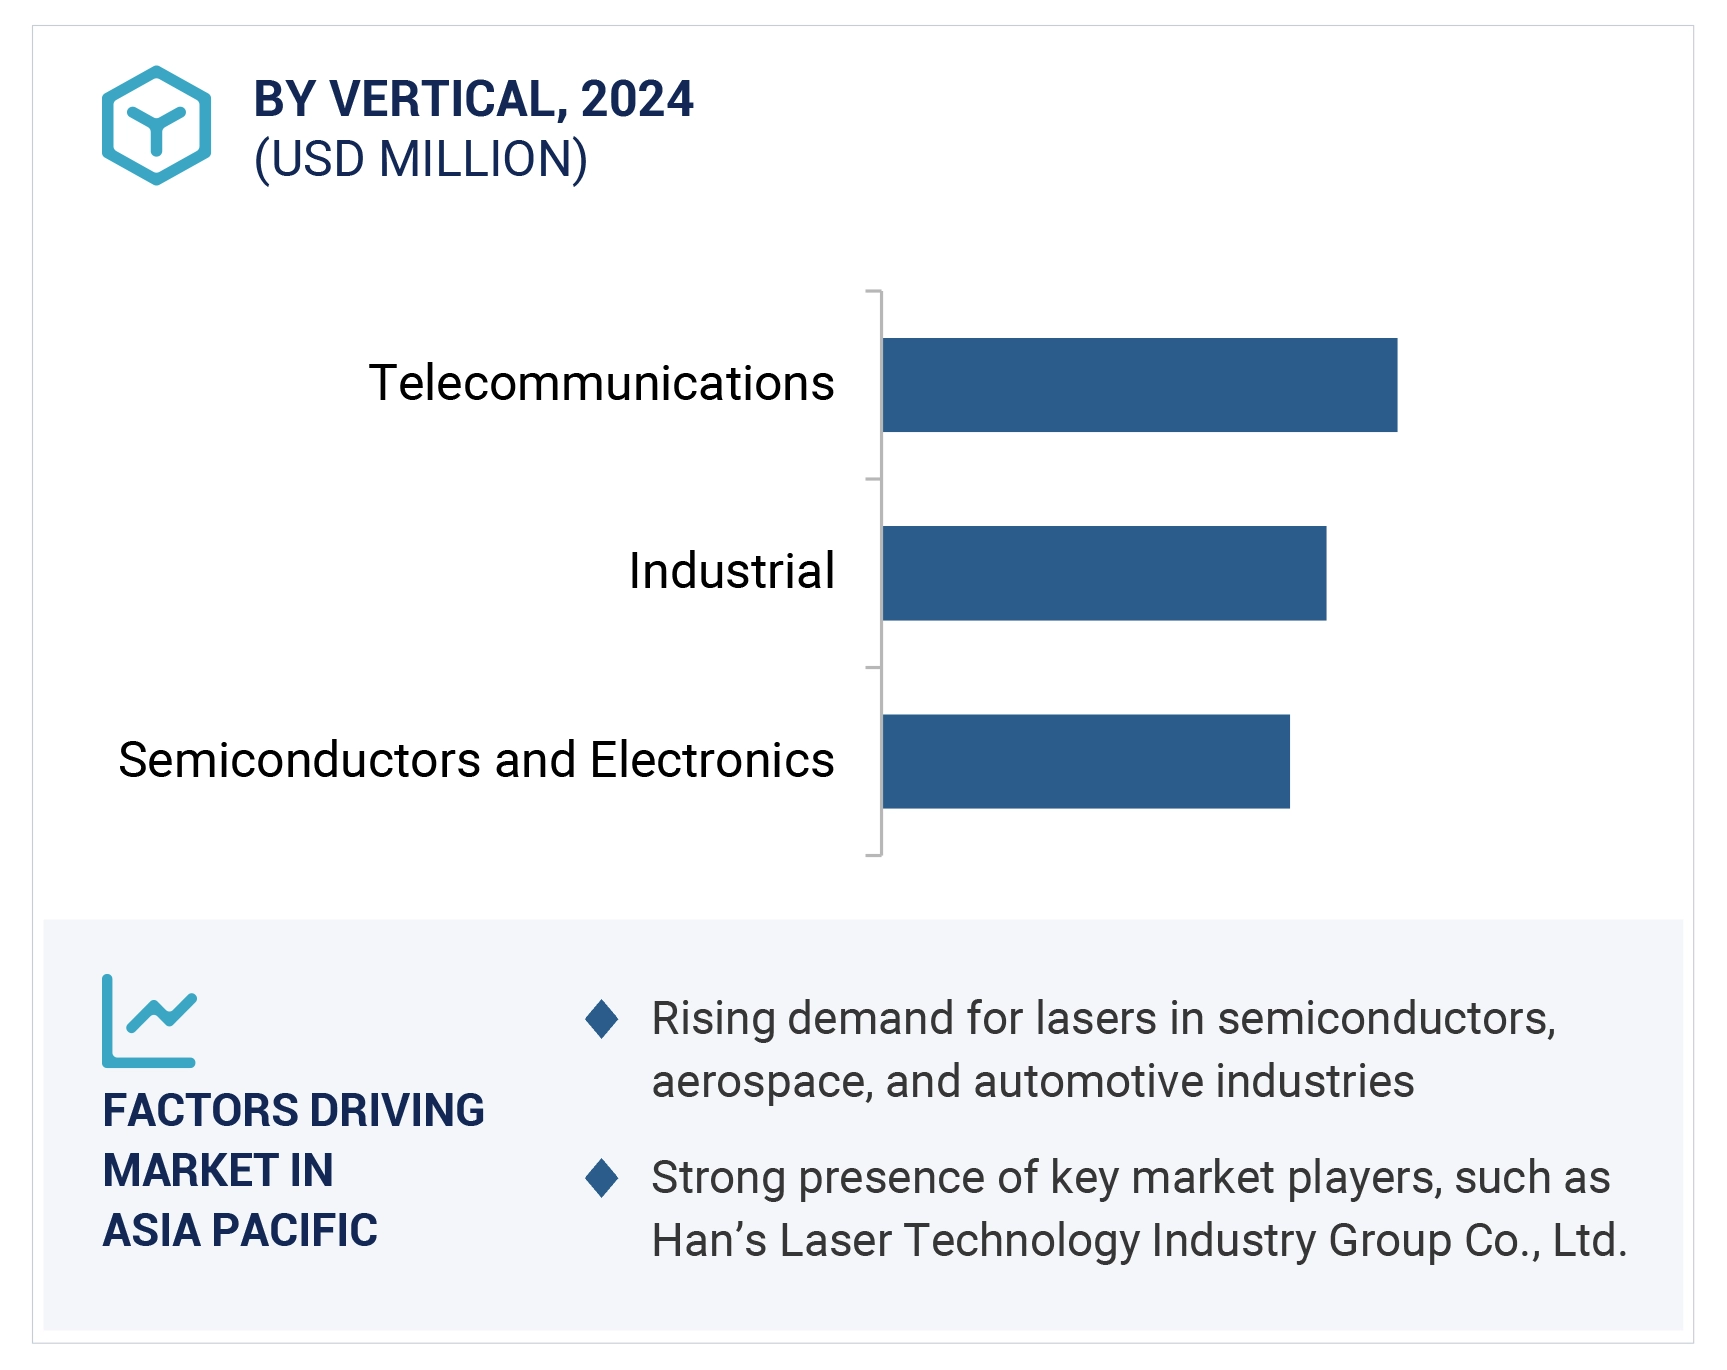


Steve
Apr, 2026
How comprehensive is the segmentation analysis by laser type (solid, gas, liquid) and does it include revenue contribution and adoption trends across each segment?.
Jessie
Apr, 2026
The segmentation across applications, regions, and laser types seems very detailed and useful for strategic planning..
MJ
Jun, 2019
As a medium industry player, we would like to get informative data regarding the prospects of laser application in the future market so that we can reach to our fruitful planning on the purpose of the best sales of laser equipment..
C�neyt
Mar, 2019
I need to learn detailed laser market share from 2019 to 2025 to use in my thesis. I would be very happy especially if it's about diode lasers that is used to pump doped fiber lasers (between 808 nm and 1060 nm)..
Greg
Nov, 2013
I would like the Epilog and Universal Laser Systems and Xenetech and Gravograph and Trotec financial pages..
Jeon
Sep, 2019
I would like to research out the market size well to classify the technical addressable market and commercial addressable Market via our products..
Joseph
Apr, 2019
We are interested in marketing single crystals for nonlinear optics in solid state lasers especially in the UV and deep UV..
Maik
Dec, 2014
Will increase in adoption of fiber laser will affect demand of CO2 laser?.
User
Sep, 2019
Over the years, fiber laser have witnessed an increase in demand due to its low cost, high output power, and compact size. Will these fiber laser replace the prominent laser been used today including CO2 laser?.
Chris
Nov, 2015
Looking for specific information on the number of YAG and other garnets used in the USA and globally..
User
Sep, 2019
There are several harmful effects of laser medical devices such as mild skin burns, tissue damage, photochemical effects and more. These effects depends upon various factors including exposure duration, beam energy, beam wavelength, and area of exposure. In what terms, harmful effects of laser during medical treatment or surgery will affect market growth?.
Judy
Dec, 2018
Do government regulation affect adoption of lasers for food items?.
Adam
Nov, 2015
Do you have more recent data than this report, and can you provide access to analyst who wrote it for a Q&A to dig deeper into specific sectors: we are particularly dealing at medical, surface treatment, YAG, fiber and ultrafast. The project has some urgency and your quick response would be appreciated..
User
Sep, 2019
Dot peen marking offers several advantages in terms of low-stress marking, adjustable marking length, ability to mark through any coating, and dot peen marking can be programmable for fully automated marking. How dot peen marking affect adoption of laser for marketing and engraving application?.
Andrew
Oct, 2015
Hi, I am an analyst at CCMP Capital. We are currently researching the laser market and found your report, �Laser Technology Market by Type, Application, and Geography - Trends & Forecast to 2013 - 2020� online. Do you have a sample of the report you could send us? We are in the initial stages of our research and want to get some preliminary understanding of the market before we proceed..
User
Nov, 2019
Recent trade war between China and the US have resulted in decreasing industrial output growth from several countries and global slowdown. According to an estimate, the trade war is expected to lower world's GDP by 1%. Up to what extent, US China trade war will affect laser market growth?.
Giorgio
Nov, 2019
I am working on a research based on laser technologies. I am trying to have a better overview on the market share/growth and competition, present in the laser technologies sector. .
Mika
Apr, 2019
I'm writing a BSc thesis about VECSEL lasers and I'm looking for a source to cite regarding the current size of the laser technology market..
User
Mar, 2019
Solid and fiber laser uses rare earth elements such as chromium, erbium, neodymium and others. Extraction of these rare earth materials can cause hazardous environment impacts. Also the raw supply can be monopolized by few countries. How government regulation regarding raw material mining and extraction for laser raw material will affect the market growth?.
Liu
Feb, 2019
We are working on Indian laser development to judge whether we can have some corporation on the engineer or academic problems with India university or company..