Medical Robots Market By Product & Service [Instrument & Accessories, Robotic Systems (Surgical Robots, Rehabilitation Robots)], Application (Laparoscopy, Radiation Therapy, Pharmacy), End User (Hospital, Ambulatory Surgery) - Global Forecasts To 2025
Updated on : February 20, 2023
The global medical robots market in terms of revenue was estimated to be worth $5.9 billion in 2020 and is poised to reach $12.7 billion by 2025, growing at a CAGR of 16.5% from 2020 to 2025. The key factors propelling the growth of this market are the advantages offered by robotic-assisted surgery and robot-assisted training in rehabilitation therapy, technological advancements in robotic systems, Improving reimbursement scenario, the increasing adoption of surgical robots, and the increase in funding for medical robot research. However, the high cost of robotic systems is a key factor limiting market growth in the coming years.
To know about the assumptions considered for the study, Request for Free Sample Report
Medical Robots Market Dynamics
Drivers: Advantages of robotic-assisted surgery & robot-assisted training in rehabilitation therapy
Across the globe, the demand for minimally invasive surgeries (MIS) is on the rise mainly due to the advantages associated with these procedures, such as smaller incisions, fewer cuts, decreased scarring, reduced pain, increased safety, faster recovery periods, and considerable cost savings. Robotic minimally invasive surgery adds to these advantages by ensuring greater accuracy and repeatability, as well as providing greater control and efficiency. According to a 2018 article on a gynecological study of laparoscopy hysterectomy, the conversion rate of straight-stick laparoscopy to open surgery was 25%. On the other hand, procedures using a robotic platform showed a conversion rate of typically less than 5%, which leads to a reduction in morbidity and blood loss.
Robotic surgery also offers highly advanced visualization capabilities that provide surgeons with a superior view of the operating area, using HD cameras to illustrate up to microscopic structures. These systems provide greater dexterity than what the human hand is capable of; given their ability to rotate 360 degrees and superior maneuverability, robots can allow surgeons to even reach hard-to-access areas.
According to the Center for Disease Control and Prevention (CDC), stroke is the leading cause of serious long-term disability in the US. Impairments that result from stroke include fatigue, hemiparesis, and difficulties with walking. It is vital for stroke patients to regain their walking ability by actively participating in the rehabilitation process to avoid secondary complications such as osteoporosis or heart disease. In 2017, a study published in the Hong Kong Physiotherapy Journal compared robotic-assisted gait therapy (RAGT) with traditional physiotherapy in 14 patients. The results of this study stated that RAGT could provide stroke patients with extra benefits in terms of ambulation, mobility, and balance as compared to physiotherapy. Also, in 2013, a study conducted by UK-based Cochrane Collaboration concluded that stroke patients who engaged in robot-assisted gait training for their rehabilitation demonstrated improved recovery in independent walking as compared to patients who only pursued conventional gait training. The most important advantage of using robot technology in rehabilitation intervention is the ability to deliver high-dosage and high-intensity training. This property makes robotic therapy a promising novel technology for rehabilitation of patients with motor disorders caused by stroke or spinal cord disease. Research into rehabilitation robotics has been growing rapidly, and the number of therapeutic rehabilitation robots has increased dramatically during the last two decades.
These advantages of surgical robots and rehabilitation robots and the rising demand for better, quicker healthcare services are expected to drive the growth of the overall medical robots market in the coming years.
Restrains: High price of robotic systems
Robot-assisted surgeries are much more expensive than minimally invasive surgeries. The American Congress of Obstetricians and Gynecologists recommends robotic hysterectomy only for unusual and complex clinical conditions. The association states that the adoption of robotic surgery for all hysterectomies would add an estimated USD 960 million to the annual cost of hysterectomy surgeries in the US. The da Vinci system, which is one of the most commonly used robotic systems, costs between USD 1.5 million and USD 2.5 million, while the CyberKnife radiosurgery robotic system costs around USD 4 to 7 million per unit. Similarly, average price of a Lokomat rehabilitation robot is around USD 380,000.
In addition, the annual maintenance cost of a robot is close to USD 125,000, which further adds to the already high cost of robotic surgery. A research letter published in the Journal of the American Medical Association (JAMA) in August 2018 estimated the cost of each robotic surgical procedure at USD 3,568. The rising cost of surgeries due to the use of robotic systems is thus expected to restrain the growth of the global market.
In the last few years, hospitals worldwide have witnessed a decrease in their budgets, primarily due to declining federal budgets. For instance, the Florida government’s budget cuts for South Florida hospitals amounted to USD 160 million in 2017. In 2017, 44 urban hospitals in Denver faced budget cuts ranging between USD 0.1 million to USD 20 million.
Similarly, hospital budgets in some European countries were reduced in the last couple of years, with further reductions expected in the coming years. Reductions in budgets have necessitated cost-containment measures in many facets of hospital operations. Cost-cutting has resulted in staff lay-offs, delays in facility upgrades, and freezing the purchases of capital equipment such as high-cost robotic systems.
Opportunities: Emerging markets and growing medical tourism
The emerging markets are expected to offer significant opportunities for players in the medical robots market, mainly due to the rising adoption of surgical robots in surgeries. The emerging countries have registered a sustained increase in the number of surgical procedures during the past decade, driven by the growing target patient population and rising medical tourism. As of 2017, Brazil, Russia, India, China, and South Africa were among the fastest-growing economies in the world and are expected to account for one-third of the total global healthcare expenditure by 2022 (Source: World Economic Forum).
Emerging countries such as India offer radiotherapy treatment options at a lesser price as compared to developed countries. For instance, in the US, patients have to pay between USD 50,000–100,000 for CyberKnife treatment, whereas in India, the procedure costs around 60–80% lesser (Source: Tour2India4Health Group). In addition to low treatment costs, the markets in developing countries are characterized by the presence of less-stringent regulations and data requirements. Also, the regulatory policies in the Asia Pacific are considered to be more adaptive and business-friendly by market players. All these factors are encouraging market players to focus more on emerging markets in the coming years.
Thus, the growing healthcare expenditure and surgical procedures, coupled with business expansions of major players in the emerging markets, are likely to present high growth opportunities for the global market.
The instrument & accessories segment to hold the largest market share
On the basis of product & service, the medical robots market is segmented into robotic systems, instruments & accessories, and services. The instruments & accessories segment commanded the largest share of the of the market in 2019. This segment is also expected to grow at the highest CAGR of 18.5% during the forecast period. The large share and high growth rate of this segment are mainly driven by the recurrent purchase of instruments & accessories as opposed to robotic systems, which are a one-time investment
The laparasopic application segment to hold the largest share of the global medical robots market
Based on the applications, the market is segmented into laparoscopy, orthopedic surgery, pharmacy applications, physical rehabilitation, external beam radiation therapy, neurosurgery and other applications. The laparoscopy application segment is expected to account for the largest share during the forecast period owing to increasing sugical laparascopic procedures conducted globally and increasing adoption of surgical robots.
The hospitals end user segment to hold the largest market share
Based on end users, the market is divided into hospitals, ambulatory surgery centers, rehabilitation centers and other end users (retail pharmacies and external radiotherapy centers). Hospitals are expected to account for the largest share of the global market in 2020 owing to higher adoption of medical robots in hospitals and increasing robotic surgery procedures conducted in hospitals.
Asia Pacific to witness significant growth in the global medical robots market
Geographically, the market is segmented into North America, Europe, Asia Pacific (APAC), and the Rest of the World. The market in the APAC is expected to grow at the highest CAGR over the next five years. Increasing demand from key markets such as Japan and China and the rising cases of acute and chronic diseases in APAC region to drive market growth in the region.
To know about the assumptions considered for the study, download the pdf brochure
Major key players operating in the global medical robots market are Intuitive Surgical (US), Stryker Corporation (US), Omnicell (US), BD Rowa (US), ARxIUM (Canada), Hocoma AG (Switzerland), among others.
Medical Robots Market Report Scope:
Report Metric |
Details |
Market size for years |
2018-2025 |
Base year considered |
2019 |
Forecast period |
2020–2025 |
Forecast units |
Value (USD Billion) |
Segments covered |
By Product, By Application, By End Users & by Region |
Geographies covered |
North America, Europe, Asia Pacific, ROW |
Companies covered |
The major market players include Intuitive Surgical (US), Stryker Corporation (US), Accuray (US), Omnicell, Inc.(US), BD Rowa (US), Hocoma AG (Switzerland), Medtronic (Ireland), Smith & Nephew (UK), ARxIUM (Canada) (Total 20 companies) |
The study categorizes the medical robots market into< following segments and sub-segments:
By Product & Service
- Instrument & Accessories
- Robotic Systems
- Services
By Application
- Laparoscopy
- Orthopedic Surgery
- Pharmacy Applications
- Physical Rehabilitation
- External Beam Radiation Therapy
- Neurosurgery
- Other Applications
By Solutions
- On-premise solutions
- Cloud-based solutions
By End User
- Hospitals
- Ambulatory Surgery Centers
- Rehabilitation Centers
- Other End Users
By Region
-
North America
- US
- Canada
-
Europe
- Germany
- UK
- France
- Italy
- Spain
- Rest of Europe (RoE)
-
Asia Pacific
- Japan
- China
- India
- Rest of APAC (RoAPAC)
- RoW
Recent Developments
- In 2020, Stryker Corporation (US) received regulatory approval for MAKO robotic surgery system in Japan for make partial knee indication.
- In 2020, Accuray (US) launched the CyberKnife S7 System a next-generation CyberKnife platform with advanced precision, and real-time artificial intelligence (AI)-driven motion tracking and synchronization treatment delivery for all stereotactic radiosurgery (SRS) and stereotactic body radiation therapy (SBRT) treatments.
- In 2020, Medtronic (Ireland) acquired Medicrea, a pioneer in the transformation of spinal surgery through artificial intelligence, predictive modeling and patient specific implants
- In 2019, Intuitive Surgical (US) received clearance from the US FDA for the da Vinci Single-port Surgical System.
- In 2019, Stryker Corporation (US) acquired Mobius Imaging, LLC (US) and Cardan Robotics (US). This acquisition brings expertise in advanced imaging and robotics, as well as a robust product pipeline.
To speak to our analyst for a discussion on the above findings, click Speak to Analyst
TABLE OF CONTENTS
1 INTRODUCTION (Page No. - 19)
1.1 OBJECTIVES OF THE STUDY
1.2 MARKET DEFINITION
1.3 INCLUSIONS AND EXCLUSIONS
1.3.1 MARKETS COVERED
1.3.2 YEARS CONSIDERED FOR THE REPORT
1.4 CURRENCY
1.5 LIMITATIONS
1.6 STAKEHOLDERS
1.7 SUMMARY OF CHANGES
2 RESEARCH METHODOLOGY (Page No. - 29)
2.1 RESEARCH DATA
2.2 RESEARCH METHODOLOGY STEPS
2.2.1 SECONDARY DATA
2.2.1.1 Key data from secondary sources
2.2.2 PRIMARY DATA
2.2.2.1 Key data from primary sources
2.3 MARKET SIZE ESTIMATION METHODOLOGY
2.4 MARKET DATA ESTIMATION AND TRIANGULATION
2.5 ASSUMPTIONS FOR THE STUDY
2.6 COVID-19-SPECIFIC ASSUMPTIONS
3 EXECUTIVE SUMMARY (Page No. - 32)
4 PREMIUM INSIGHTS (Page No. - 36)
4.1 GLOBAL MEDICAL ROBOTS MARKET OVERVIEW
4.2 NORTH AMERICA: MARKET, 2019
4.3 GLOBAL MARKET, BY PRODUCT & SERVICE
4.4 GLOBAL MARKET: GEOGRAPHIC GROWTH OPPORTUNITIES
5 MARKET OVERVIEW (Page No. - 39)
5.1 INTRODUCTION
5.2 MARKET DYNAMICS
5.2.1 DRIVERS
5.2.1.1 Advantages of robot-assisted surgery & training in rehabilitation therapy
5.2.1.2 Technological advancements
5.2.1.3 Improving reimbursement scenario
5.2.1.4 Increasing adoption of surgical robots
5.2.1.5 Increase in funding for medical robot research
5.2.2 RESTRAINTS
5.2.2.1 High cost of robotic systems
5.2.3 OPPORTUNITIES
5.2.3.1 Increasing penetration of surgical robots in ASCs
5.2.3.2 Emerging markets
5.3 IMPACT OF COVID-19 ON THE GLOBAL MARKET
5.4 ECOSYSTEM
5.5 TECHNOLOGY ANALYSIS
6 MEDICAL ROBOTS MARKET, BY PRODUCT & SERVICE (Page No. - 49)
6.1 INTRODUCTION
6.2 INSTRUMENTS & ACCESSORIES
6.2.1 RECURRENT PURCHASE OF INSTRUMENTS & ACCESSORIES FOR EACH SURGICAL PROCEDURE TO DRIVE GROWTH IN THIS SEGMENT
6.3 ROBOTIC SYSTEMS
6.3.1 SURGICAL ROBOTIC SYSTEMS
6.3.1.1 Increasing number of laparoscopic surgeries globally to drive the growth of this market
6.3.1.2 Laparoscopy robotic systems
6.3.1.3 Orthopedic robotic systems
6.3.1.4 Neurosurgical robotic systems
6.3.2 HOSPITAL & PHARMACY ROBOTIC SYSTEMS
6.3.2.1 Reduced error rate and increased efficiency provided by robots drive their adoption
6.3.3 REHABILITATION ROBOTIC SYSTEMS
6.3.3.1 Increasing number of market players offering rehabilitation robots to drive the growth of this market
6.3.3.2 Therapeutic robotic systems
6.3.3.3 Assistive robotic systems
6.3.3.4 Exoskeleton robotic systems
6.3.3.5 Other rehabilitation robotic systems
6.3.4 NONINVASIVE RADIOSURGERY ROBOTIC SYSTEMS
6.3.4.1 Growing focus on adopting advanced systems and instruments is a key driver of market growth
6.3.5 OTHER ROBOTIC SYSTEMS
6.4 SERVICES
6.4.1 RECURRING REVENUE PER INSTALLATION AND PER PROCEDURE TO OFFER GROWTH OPPORTUNITIES
7 MEDICAL ROBOTS MARKET, BY APPLICATION (Page No. - 71)
7.1 INTRODUCTION
7.2 LAPAROSCOPY
7.2.1 INCREASING NUMBER OF SURGICAL PROCEDURES CONDUCTED TO DRIVE THE MARKET GROWTH
7.3 ORTHOPEDIC SURGERY
7.3.1 HIGH IMPLANTATION AND PLACEMENT ACCURACY OF SURGICAL ROBOTS IN ORTHOPEDIC PROCEDURES SUPPORTS MARKET GROWTH
7.4 PHARMACY APPLICATIONS
7.4.1 FOCUS OF HOSPITALS AND PHARMACIES TO REDUCE MEDICATION ERRORS AND INCREASE EFFICIENCY DRIVE THE MARKET GROWTH
7.5 PHYSICAL REHABILITATION
7.5.1 INCREASING INCIDENCE OF STROKES & SPINAL CORD INJURY WILL FAVOR DEMAND FOR ROBOTS
7.6 EXTERNAL BEAM RADIATION THERAPY
7.6.1 EARLY DETECTION OF CANCER CASES IN DEVELOPED ECONOMIES TO DRIVE THE DEMAND FOR EBRT
7.7 NEUROSURGERY
7.7.1 INCREASING PREVALENCE OF NEUROLOGICAL DISORDERS TO FUEL MARKET GROWTH
7.8 OTHER APPLICATIONS
8 MEDICAL ROBOTS MARKET, BY END USER (Page No. - 86)
8.1 INTRODUCTION
8.2 HOSPITALS
8.2.1 ROBOT-ASSISTED SURGERIES ENABLE HOSPITALS TO LOWER PRE- AND POST-OPERATIVE CARE COSTS
8.3 AMBULATORY SURGERY CENTERS
8.3.1 RISE IN THE NUMBER OF OUTPATIENT SURGERIES TO SUPPORT MARKET GROWTH
8.4 REHABILITATION CENTERS
8.4.1 INCREASING INCIDENCE OF DISABILITIES TO SUPPORT THE GROWTH OF REHAB CENTERS
8.5 OTHER END USERS
9 MEDICAL ROBOTS MARKET, BY REGION (Page No. - 96)
9.1 INTRODUCTION
9.2 NORTH AMERICA
9.2.1 US
9.2.1.1 The US holds the largest share of the North American market
9.2.2 CANADA
9.2.2.1 Increased use of surgical robots in pediatric applications to drive market growth in Canada
9.3 EUROPE
9.3.1 GERMANY
9.3.1.1 Germany to witness the highest growth in the European market
9.3.2 ITALY
9.3.2.1 Increasing number of robotic surgical systems installed in the country to propel market growth
9.3.3 FRANCE
9.3.3.1 Higher adoption of MIS to support market growth in the country
9.3.4 UK
9.3.4.1 UK has registered an increase in the number of robotic surgical procedures performed
9.3.5 SPAIN
9.3.5.1 Increasing implementation and development of medical robotic programs in Spain to drive market growth
9.3.6 ROE
9.4 ASIA PACIFIC
9.4.1 JAPAN
9.4.1.1 Japan dominates the APAC market
9.4.2 CHINA
9.4.2.1 China to be the fastest-growing country in the Asia Pacific surgical robots market
9.4.3 INDIA
9.4.3.1 Huge patient population to support market growth
9.4.4 REST OF ASIA PACIFIC
9.5 REST OF THE WORLD
10 COMPETITIVE LANDSCAPE (Page No. - 132)
10.1 INTRODUCTION
10.2 MARKET EVALUATION FRAMEWORK
10.3 MARKET RANKING/SHARE ANALYSIS
10.3.1 OVERALL MEDICAL ROBOTS MARKET SHARE ANALYSIS
10.3.2 SURGICAL ROBOTS MARKET SHARE ANALYSIS
10.3.3 HOSPITAL & PHARMACY ROBOTS MARKET SHARE ANALYSIS
10.3.4 REHABILITATION ROBOTS MARKET SHARE ANALYSIS
10.3.5 RADIOSURGERY ROBOTIC SYSTEMS MARKET SHARE ANALYSIS
10.4 KEY MARKET DEVELOPMENTS
10.4.1 PRODUCT LAUNCHES & APPROVALS
10.4.2 DEALS
10.4.3 OTHER DEVELOPMENTS
11 COMPANY EVALUATION MATRIX AND COMPANY PROFILES (Page No. - 140)
11.1 INTRODUCTION
11.2 COMPANY EVALUATION MATRIX DEFINITIONS AND METHODOLOGY
11.2.1 STARS
11.2.2 EMERGING LEADERS
11.2.3 PERVASIVE PLAYERS
11.2.4 EMERGING COMPANIES
11.3 COMPETITIVE LEADERSHIP MAPPING (EMERGING PLAYERS)
11.3.1 PROGRESSIVE COMPANIES
11.3.2 STARTING/EMERGING BLOCKS
11.3.3 RESPONSIVE COMPANIES
11.3.4 DYNAMIC COMPANIES
11.4 COMPANY PROFILES
11.4.1 INTUITIVE SURGICAL
11.4.1.1 Business overview
11.4.1.2 Products & services offered
11.4.1.3 Recent developments
11.4.1.4 MnM view
11.4.2 STRYKER CORPORATION
11.4.2.1 Business overview
11.4.2.2 Products offered
11.4.2.3 Recent developments
11.4.2.4 MnM view
11.4.3 ACCURAY
11.4.3.1 Business overview
11.4.3.2 Products offered
11.4.3.3 Recent developments
11.4.3.4 MnM view
11.4.4 BECTON, DICKINSON AND COMPANY
11.4.4.1 Business overview
11.4.4.2 Products offered
11.4.4.3 Recent developments
11.4.4.4 MnM view
11.4.5 MEDTRONIC
11.4.5.1 Business overview
11.4.5.2 Products offered
11.4.5.3 Recent developments
11.4.5.4 MnM view
11.4.6 OMNICELL
11.4.6.1 Business overview
11.4.6.2 Products offered
11.4.6.3 Recent developments
11.4.7 ZIMMER BIOMET
11.4.7.1 Business overview
11.4.7.2 Products offered
11.4.7.3 Recent developments
11.4.7.4 MnM view
11.4.8 SMITH & NEPHEW
11.4.8.1 BUSINESS OVERVIEW
11.4.8.2 Products offered
11.4.8.3 Recent developments
11.4.9 HOCOMA AG
11.4.9.1 Business overview
11.4.9.2 Products offered
11.4.9.3 Recent developments
11.4.9.4 MnM view
11.4.10 CYBERDYNE
11.4.10.1 Business overview
11.4.10.2 Products offered
11.4.10.3 Recent developments
11.4.11 EKSO BIONICS
11.4.11.1 Business overview
11.4.11.2 Products offered
11.4.11.3 Recent developments
11.4.12 ARXIUM
11.4.12.1 Business overview
11.4.12.2 Products offered
11.4.12.3 Recent developments
11.4.13 TRANSENTERIX
11.4.13.1 Business overview
11.4.13.2 Products offered
11.4.13.3 Recent developments
11.4.14 REWALK ROBOTICS
11.4.14.1 Business overview
11.4.14.2 Products offered
11.4.14.3 Recent developments
11.4.15 CMR SURGICAL
11.4.15.1 Business overview
11.4.15.2 Products offered
11.4.15.3 Recent developments
11.4.16 RENISHAW
11.4.16.1 Business overview
11.4.16.2 Products offered
11.4.16.3 Recent developments
11.4.17 GOLLMANN KOMMISSIONIERSYSTEME GMBH
11.4.17.1 Products offered
11.4.18 BIONIK LABORATORIES CORP.
11.4.18.1 Business overview
11.4.18.2 Products offered
11.4.18.3 Recent developments
11.4.19 AURIS HEALTH
11.4.19.1 Business overview
11.4.19.2 Products offered
11.4.19.3 Recent developments
11.4.20 AVATERAMEDICAL GMBH
11.4.20.1 Business overview
11.4.20.2 Products offered
11.4.20.3 Recent developments
11.4.21 ZAP SURGICAL SYSTEMS
11.4.21.1 Business overview
11.4.21.2 Products offered
12 APPENDIX
12.1 DISCUSSION GUIDE
12.2 KNOWLEDGE STORE: MARKETSANDMARKETS' SUBSCRIPTION PORTAL
12.3 AVAILABLE CUSTOMIZATIONS
12.4 RELATED REPORTS
12.5 AUTHOR DETAILS
LIST OF TABLES (164 Tables)
TABLE 1 TECHNOLOGICAL ADVANCEMENTS IN MEDICAL ROBOTS
TABLE 2 DIGITAL TECHNOLOGY ENABLERS, THEIR BENEFITS, AND EXAMPLES IN THE MARKET
TABLE 3 MEDICAL ROBOTS MARKET, BY PRODUCT & SERVICE, 2018-2025 (USD MILLION)
TABLE 4 ROBOTIC SYSTEMS MARKET, BY KEY PLAYER, 2018-2025 (UNITS)
TABLE 5 MEDICAL ROBOT INSTRUMENTS & ACCESSORIES MARKET, BY REGION, 2020-2025 (USD MILLION)
TABLE 6 NORTH AMERICA: MEDICAL ROBOT INSTRUMENTS & ACCESSORIES MARKET, BY COUNTRY, 2018-2025 (USD MILLION)
TABLE 7 EUROPE: MEDICAL ROBOT INSTRUMENTS & ACCESSORIES MARKET, BY COUNTRY, 2018-2025 (USD MILLION)
TABLE 8 APAC: MEDICAL ROBOT INSTRUMENTS & ACCESSORIES MARKET, BY COUNTRY, 2018-2025 (USD MILLION)
TABLE 9 MEDICAL ROBOTS PRICING
TABLE 10 ROBOTIC SYSTEMS MARKET, BY TYPE, 2018-2025 (USD MILLION)
TABLE 11 ROBOTIC SYSTEMS MARKET, BY TYPE, 2018-2025 (UNITS)
TABLE 12 ROBOTIC SYSTEMS MARKET, BY REGION, 2018-2025 (USD MILLION)
TABLE 13 NORTH AMERICA: ROBOTIC SYSTEMS MARKET, BY COUNTRY, 2018-2025 (USD MILLION)
TABLE 14 EUROPE: ROBOTIC SYSTEMS MARKET, BY COUNTRY, 2018-2025 (USD MILLION)
TABLE 15 APAC: ROBOTIC SYSTEMS MARKET, BY COUNTRY, 2018-2025 (USD MILLION)
TABLE 16 SURGICAL ROBOTIC SYSTEMS MARKET, BY TYPE, 2018-2025 (USD MILLION)
TABLE 17 SURGICAL ROBOTIC SYSTEMS MARKET, BY TYPE, 2018-2025 (UNITS)
TABLE 18 SURGICAL ROBOTIC SYSTEMS MARKET, BY REGION, 2018-2025 (USD MILLION)
TABLE 19 NORTH AMERICA: SURGICAL ROBOTIC SYSTEMS MARKET, BY COUNTRY, 2018-2025 (USD MILLION)
TABLE 20 EUROPE: SURGICAL ROBOTIC SYSTEMS MARKET, BY COUNTRY, 2018-2025 (USD MILLION)
TABLE 21 APAC: SURGICAL ROBOTIC SYSTEMS MARKET, BY COUNTRY, 2018-2025 (USD MILLION)
TABLE 22 HOSPITAL & PHARMACY ROBOTIC SYSTEMS MARKET, BY TYPE, 2018-2025 (USD MILLION)
TABLE 23 HOSPITAL & PHARMACY ROBOTIC SYSTEMS MARKET, BY TYPE, 2018-2025 (UNITS)
TABLE 24 HOSPITAL & PHARMACY ROBOTIC SYSTEMS MARKET, BY REGION, 2018-2025 (USD MILLION)
TABLE 25 NORTH AMERICA: HOSPITAL & PHARMACY ROBOTIC SYSTEMS MARKET, BY COUNTRY, 2018-2025 (USD MILLION)
TABLE 26 EUROPE: HOSPITAL & PHARMACY ROBOTIC SYSTEMS MARKET, BY COUNTRY, 2018-2025 (USD MILLION)
TABLE 27 APAC: HOSPITAL & PHARMACY ROBOTIC SYSTEMS MARKET, BY COUNTRY, 2018-2025 (USD MILLION)
TABLE 28 REHABILITATION ROBOTIC SYSTEMS MARKET, BY TYPE, 2018-2025 (USD MILLION)
TABLE 29 REHABILITATION ROBOTIC SYSTEMS MARKET, BY TYPE, 2020-2025 (UNITS)
TABLE 30 REHABILITATION ROBOTIC SYSTEMS MARKET, BY REGION, 2018-2025 (USD MILLION)
TABLE 31 NORTH AMERICA: REHABILITATION ROBOTIC SYSTEMS MARKET, BY COUNTRY, 2018-2025 (USD MILLION)
TABLE 32 EUROPE: REHABILITATION ROBOTIC SYSTEMS MARKET, BY COUNTRY, 2018-2025 (USD MILLION)
TABLE 33 APAC: REHABILITATION ROBOTIC SYSTEMS MARKET, BY COUNTRY, 2018-2025 (USD MILLION)
TABLE 34 NONINVASIVE RADIOSURGERY ROBOTIC SYSTEMS MARKET, BY REGION, 2020-2025 (USD MILLION)
TABLE 35 NORTH AMERICA: NONINVASIVE RADIOSURGERY ROBOTIC SYSTEMS MARKET, BY COUNTRY, 2018-2025 (USD MILLION)
TABLE 36 EUROPE: NONINVASIVE RADIOSURGERY ROBOTIC SYSTEMS MARKET, BY COUNTRY, 2018-2025 (USD MILLION)
TABLE 37 APAC: NONINVASIVE RADIOSURGERY ROBOTIC SYSTEMS MARKET, BY COUNTRY, 2018-2025 (USD MILLION)
TABLE 38 OTHER ROBOTIC SYSTEMS MARKET, BY REGION, 2018-2025 (USD MILLION)
TABLE 39 NORTH AMERICA: OTHER ROBOTIC SYSTEMS MARKET, BY COUNTRY, 2018-2025 (USD MILLION)
TABLE 40 EUROPE: OTHER ROBOTIC SYSTEMS MARKET, BY COUNTRY, 2018-2025 (USD MILLION)
TABLE 41 APAC: OTHER ROBOTIC SYSTEMS MARKET, BY COUNTRY, 2018-2025 (USD MILLION)
TABLE 42 MEDICAL ROBOT SERVICES MARKET, BY REGION, 2018-2025 (USD MILLION)
TABLE 43 NORTH AMERICA: MEDICAL ROBOT SERVICES MARKET, BY COUNTRY, 2018-2025 (USD MILLION)
TABLE 44 EUROPE: MEDICAL ROBOT SERVICES MARKET, BY COUNTRY, 2018-2025 (USD MILLION)
TABLE 45 APAC: MEDICAL ROBOT SERVICES MARKET, BY COUNTRY, 2018-2025 (USD MILLION)
TABLE 46 GLOBAL MARKET, BY APPLICATION, 2018-2025 (USD MILLION)
TABLE 47 GLOBAL MARKET FOR LAPAROSCOPY, BY REGION, 2020-2025 (USD MILLION)
TABLE 48 NORTH AMERICA: MARKET FOR LAPAROSCOPY, BY COUNTRY, 2018-2025 (USD MILLION)
TABLE 49 EUROPE: MARKET FOR LAPAROSCOPY, BY COUNTRY, 2018-2025 (USD MILLION)
TABLE 50 APAC MARKET FOR LAPAROSCOPY, BY COUNTRY, 2018-2025 (USD MILLION)
TABLE 51 GLOBAL MARKET FOR ORTHOPEDIC SURGERY, BY REGION, 2020-2025 (USD MILLION)
TABLE 52 NORTH AMERICA: MARKET FOR ORTHOPEDIC SURGERY, BY COUNTRY, 2020-2025 (USD MILLION)
TABLE 53 EUROPE: MARKET FOR ORTHOPEDIC SURGERY, BY COUNTRY, 2018-2025 (USD MILLION)
TABLE 54 APAC: MARKET FOR ORTHOPEDIC SURGERY, BY COUNTRY, 2018-2025 (USD MILLION)
TABLE 55 GLOBAL MARKET FOR PHARMACY APPLICATIONS, BY REGION, 2018-2025 (USD MILLION)
TABLE 56 NORTH AMERICA: MARKET FOR PHARMACY APPLICATIONS, BY COUNTRY, 2020-2025 (USD MILLION)
TABLE 57 EUROPE: MARKET FOR PHARMACY APPLICATIONS, BY COUNTRY, 2018-2025 (USD MILLION)
TABLE 58 APAC: MARKET FOR PHARMACY APPLICATIONS, BY COUNTRY, 2018-2025 (USD MILLION)
TABLE 59 GLOBAL MARKET FOR PHYSICAL REHABILITATION THERAPY, BY REGION, 2018-2025 (USD MILLION)
TABLE 60 NORTH AMERICA: MARKET FOR PHYSICAL REHABILITATION, BY COUNTRY, 2020-2025 (USD MILLION)
TABLE 61 EUROPE: MARKET FOR PHYSICAL REHABILITATION, BY COUNTRY, 2018-2025 (USD MILLION)
TABLE 62 APAC: MARKET FOR PHYSICAL REHABILITATION, BY COUNTRY, 2018-2025 (USD MILLION)
TABLE 63 GLOBAL MARKET FOR EXTERNAL BEAM RADIATION THERAPY, BY REGION, 2018-2025 (USD MILLION)
TABLE 64 NORTH AMERICA: MARKET FOR EXTERNAL BEAM RADIATION THERAPY, BY COUNTRY, 2020-2025 (USD MILLION)
TABLE 65 EUROPE: MARKET FOR EXTERNAL BEAM RADIATION THERAPY, BY COUNTRY, 2018-2025 (USD MILLION)
TABLE 66 APAC: MARKET FOR EXTERNAL BEAM RADIATION THERAPY, BY COUNTRY, 2018-2025 (USD MILLION)
TABLE 67 GLOBAL MARKET FOR NEUROSURGERY, BY REGION, 2020-2025 (USD MILLION)
TABLE 68 NORTH AMERICA: MARKET FOR NEUROSURGERY, BY COUNTRY, 2020-2025 (USD MILLION)
TABLE 69 EUROPE: MARKET FOR NEUROSURGERY, BY COUNTRY, 2018-2025 (USD MILLION)
TABLE 70 APAC: MARKET FOR NEUROSURGERY, BY COUNTRY, 2018-2025 (USD MILLION)
TABLE 71 GLOBAL MARKET FOR OTHER APPLICATIONS, BY REGION, 2018-2025 (USD MILLION)
TABLE 72 NORTH AMERICA: MARKET FOR OTHER APPLICATIONS, BY COUNTRY, 2020-2025 (USD MILLION)
TABLE 73 EUROPE: MARKET FOR OTHER APPLICATIONS, BY COUNTRY, 2018-2025 (USD MILLION)
TABLE 74 APAC: MARKET FOR OTHER APPLICATIONS, BY COUNTRY, 2018-2025 (USD MILLION)
TABLE 75 MEDICAL ROBOTS MARKET, BY END USER, 2018-2025 (USD MILLION)
TABLE 76 LIST OF RECENTLY INSTALLED SURGICAL ROBOT SYSTEMS IN HOSPITALS ACROSS THE GLOBE
TABLE 77 GLOBAL MARKET FOR HOSPITALS, BY REGION, 2018-2025 (USD MILLION)
TABLE 78 NORTH AMERICA: MARKET FOR HOSPITALS, BY COUNTRY, 2018-2025 (USD MILLION)
TABLE 79 EUROPE: MARKET FOR HOSPITALS, BY COUNTRY, 2018-2025 (USD MILLION)
TABLE 80 APAC: MARKET FOR HOSPITALS, BY COUNTRY, 2018-2025 (USD MILLION)
TABLE 81 GLOBAL MARKET FOR AMBULATORY SURGERY CENTERS, BY REGION, 2018-2025 (USD MILLION)
TABLE 82 NORTH AMERICA: MARKET FOR AMBULATORY SURGERY CENTERS, BY COUNTRY, 2018-2025 (USD MILLION)
TABLE 83 EUROPE: MARKET FOR AMBULATORY SURGERY CENTERS, BY COUNTRY, 2018-2025 (USD MILLION)
TABLE 84 APAC: MARKET FOR AMBULATORY SURGERY CENTERS, BY COUNTRY, 2018-2025 (USD MILLION)
TABLE 85 GLOBAL MARKET FOR REHABILITATION CENTERS, BY REGION, 2018-2025 (USD MILLION)
TABLE 86 NORTH AMERICA: MARKET FOR REHABILITATION CENTERS, BY COUNTRY, 2018-2025 (USD MILLION)
TABLE 87 EUROPE: MARKET FOR REHABILITATION CENTERS, BY COUNTRY, 2018-2025 (USD MILLION)
TABLE 88 APAC: MARKET FOR REHABILITATION CENTERS, BY COUNTRY, 2018-2025 (USD MILLION)
TABLE 89 GLOBAL MARKET FOR OTHER END USERS, BY REGION, 2018-2025 (USD MILLION)
TABLE 90 NORTH AMERICA: MARKET FOR OTHER END USERS, BY COUNTRY, 2018-2025 (USD MILLION)
TABLE 91 EUROPE: MARKET FOR OTHER END USERS, BY COUNTRY, 2018-2025 (USD MILLION)
TABLE 92 APAC: MARKET FOR OTHER END USERS, BY COUNTRY, 2018-2025 (USD MILLION)
TABLE 93 GLOBAL MARKET, BY REGION, 2018-2025 (USD MILLION)
TABLE 94 NORTH AMERICA: MEDICAL ROBOTS MARKET, BY COUNTRY, 2018-2025 (USD MILLION)
TABLE 95 NORTH AMERICA: MARKET, BY PRODUCT & SERVICE, 2018-2025 (USD MILLION)
TABLE 96 NORTH AMERICA: ROBOTIC SYSTEMS MARKET, BY TYPE, 2018-2025 (USD MILLION)
TABLE 97 NORTH AMERICA: MARKET, BY APPLICATION, 2018-2025 (USD MILLION)
TABLE 98 NORTH AMERICA: MARKET, BY END USER, 2018-2025 (USD MILLION)
TABLE 99 US: MEDICAL ROBOTS MARKET, BY PRODUCT & SERVICE, 2018-2025 (USD MILLION)
TABLE 100 US: ROBOTIC SYSTEMS MARKET, BY TYPE, 2018-2025 (USD MILLION)
TABLE 101 US: MARKET, BY APPLICATION, 2018-2025 (USD MILLION)
TABLE 102 US: MARKET, BY END USER, 2018-2025 (USD MILLION)
TABLE 103 CANADA: MEDICAL ROBOTS MARKET, BY PRODUCT & SERVICE, 2018-2025 (USD MILLION)
TABLE 104 CANADA: ROBOTIC SYSTEMS MARKET, BY TYPE, 2018-2025 (USD MILLION)
TABLE 105 CANADA: MARKET, BY APPLICATION, 2018-2025 (USD MILLION)
TABLE 106 CANADA: MARKET, BY END USER, 2018-2025 (USD MILLION)
TABLE 107 EUROPE: MEDICAL ROBOTS MARKET, BY COUNTRY, 2018-2025 (USD MILLION)
TABLE 108 EUROPE: MARKET, BY PRODUCT & SERVICE, 2018-2025 (USD MILLION)
TABLE 109 EUROPE: ROBOTIC SYSTEMS MARKET, BY TYPE, 2018-2025 (USD MILLION)
TABLE 110 EUROPE: MARKET, BY APPLICATION, 2018-2025 (USD MILLION)
TABLE 111 EUROPE: MARKET, BY END USER, 2018-2025 (USD MILLION)
TABLE 112 GERMANY: MEDICAL ROBOTS MARKET, BY PRODUCT & SERVICE, 2018-2025 (USD MILLION)
TABLE 113 GERMANY: ROBOTIC SYSTEMS MARKET, BY TYPE, 2018-2025 (USD MILLION)
TABLE 114 GERMANY: MARKET, BY APPLICATION, 2018-2025 (USD MILLION)
TABLE 115 GERMANY: MARKET, BY END USER, 2018-2025 (USD MILLION)
TABLE 116 ITALY: MEDICAL ROBOTS MARKET, BY PRODUCT & SERVICE, 2018-2025 (USD MILLION)
TABLE 117 ITALY: ROBOTIC SYSTEMS MARKET, BY TYPE, 2018-2025 (USD MILLION)
TABLE 118 ITALY: MARKET, BY APPLICATION, 2018-2025 (USD MILLION)
TABLE 119 ITALY: MARKET, BY END USER, 2018-2025 (USD MILLION)
TABLE 120 FRANCE: MEDICAL ROBOTS MARKET, BY PRODUCT & SERVICE, 2018-2025 (USD MILLION)
TABLE 121 FRANCE: ROBOTIC SYSTEMS MARKET, BY TYPE, 2018-2025 (USD MILLION)
TABLE 122 FRANCE: MARKET, BY APPLICATION, 2018-2025 (USD MILLION)
TABLE 123 FRANCE: MARKET, BY END USER, 2018-2025 (USD MILLION)
TABLE 124 UK: MEDICAL ROBOTS MARKET, BY PRODUCT & SERVICE, 2018-2025 (USD MILLION)
TABLE 125 UK: ROBOTIC SYSTEMS MARKET, BY TYPE, 2018-2025 (USD MILLION)
TABLE 126 UK: MARKET, BY APPLICATION, 2018-2025 (USD MILLION)
TABLE 127 UK: MARKET, BY END USER, 2018-2025 (USD MILLION)
TABLE 128 SPAIN: MEDICAL ROBOTS MARKET, BY PRODUCT & SERVICE, 2018-2025 (USD MILLION)
TABLE 129 SPAIN: ROBOTIC SYSTEMS MARKET, BY TYPE, 2018-2025 (USD MILLION)
TABLE 130 SPAIN: MARKET, BY APPLICATION, 2018-2025 (USD MILLION)
TABLE 131 SPAIN: MARKET, BY END USER, 2018-2025 (USD MILLION)
TABLE 132 ROE: MEDICAL ROBOTS MARKET, BY PRODUCT & SERVICE, 2018-2025 (USD MILLION)
TABLE 133 ROE: ROBOTIC SYSTEMS MARKET, BY TYPE, 2018-2025 (USD MILLION)
TABLE 134 ROE: MARKET, BY APPLICATION, 2018-2025 (USD MILLION)
TABLE 135 ROE: MARKET, BY END USER, 2018-2025 (USD MILLION)
TABLE 136 ASIA PACIFIC: MEDICAL ROBOTS MARKET, BY COUNTRY, 2018-2025 (USD MILLION)
TABLE 137 ASIA PACIFIC: MARKET, BY PRODUCT & SERVICE, 2018-2025 (USD MILLION)
TABLE 138 ASIA PACIFIC: ROBOTIC SYSTEMS MARKET, BY TYPE, 2018-2025 (USD MILLION)
TABLE 139 ASIA PACIFIC: MARKET, BY APPLICATION, 2018-2025 (USD MILLION)
TABLE 140 ASIA PACIFIC: MARKET, BY END USER, 2018-2025 (USD MILLION)
TABLE 141 JAPAN: MEDICAL ROBOTS MARKET, BY PRODUCT & SERVICE, 2018-2025 (USD MILLION)
TABLE 142 JAPAN: ROBOTIC SYSTEMS MARKET, BY TYPE, 2018-2025 (USD MILLION)
TABLE 143 JAPAN: MARKET, BY APPLICATION, 2018-2025 (USD MILLION)
TABLE 144 JAPAN: MARKET, BY END USER, 2018-2025 (USD MILLION)
TABLE 145 CHINA: MARKET, BY PRODUCT & SERVICE, 2018-2025 (USD MILLION)
TABLE 146 CHINA: ROBOTIC SYSTEMS MARKET, BY TYPE, 2018-2025 (USD MILLION)
TABLE 147 CHINA: MARKET, BY APPLICATION, 2018-2025 (USD MILLION)
TABLE 148 CHINA: MARKET, BY END USER, 2018-2025 (USD MILLION)
TABLE 149 INDIA: MEDICAL ROBOTS MARKET, BY PRODUCT & SERVICE, 2018-2025 (USD MILLION)
TABLE 150 INDIA: ROBOTIC SYSTEMS MARKET, BY TYPE, 2018-2025 (USD MILLION)
TABLE 151 INDIA: MARKET, BY APPLICATION, 2018-2025 (USD MILLION)
TABLE 152 INDIA: MARKET, BY END USER, 2018-2025 (USD MILLION)
TABLE 153 ROAPAC: MEDICAL ROBOTS MARKET, BY PRODUCT & SERVICE, 2018-2025 (USD MILLION)
TABLE 154 ROAPAC: ROBOTIC SYSTEMS MARKET, BY TYPE, 2018-2025 (USD MILLION)
TABLE 155 ROAPAC: MARKET, BY APPLICATION, 2018-2025 (USD MILLION)
TABLE 156 ROAPAC: MARKET, BY END USER, 2018-2025 (USD MILLION)
TABLE 157 ROW: MEDICAL ROBOTS MARKET, BY PRODUCT & SERVICE, 2018-2025 (USD MILLION)
TABLE 158 ROW: ROBOTIC SYSTEMS MARKET, BY TYPE, 2018-2025 (USD MILLION)
TABLE 159 ROW: MARKET, BY APPLICATION, 2018-2025 (USD MILLION)
TABLE 160 ROW: MARKET, BY END USER, 2018-2025 (USD MILLION)
TABLE 161 KEY PRODUCT LAUNCHES & APPROVALS, 2018-2020
TABLE 162 KEY DEALS, 2017-2020
TABLE 163 OTHER KEY DEVELOPMENTS, 2017-2020
TABLE 164 COMPANY EVALUATION MATRIX: CRITERIA
LIST OF FIGURES (47 Figures)
FIGURE 1 MEDICAL ROBOTS MARKET SEGMENTATION
FIGURE 2 RESEARCH METHODOLOGY: GLOBAL MARKET
FIGURE 3 RESEARCH DESIGN
FIGURE 4 BREAKDOWN OF PRIMARY INTERVIEWS: BY COMPANY TYPE, DESIGNATION, AND REGION
FIGURE 5 PRIMARY SOURCES
FIGURE 6 RESEARCH METHODOLOGY: HYPOTHESIS BUILDING
FIGURE 7 MARKET SIZE ESTIMATION: REVENUE SHARE ANALYSIS
FIGURE 8 REVENUE-BASED MARKET SIZE ESTIMATION: IV COMPOUNDING ROBOTS MARKET
FIGURE 9 DATA TRIANGULATION METHODOLOGY
FIGURE 10 GLOBAL MARKET, BY PRODUCT & SERVICE, 2020 VS. 2025
FIGURE 11 MEDICAL ROBOTIC SYSTEMS MARKET, BY TYPE, 2020 VS. 2025
FIGURE 12 GLOBAL MARKET, BY APPLICATION, 2020 VS. 2025
FIGURE 13 GLOBAL MARKET, BY END USER, 2020 VS. 2025
FIGURE 14 GEOGRAPHICAL SNAPSHOT OF THE GLOBAL MARKET
FIGURE 15 ADVANTAGES OF MEDICAL ROBOTS HAVE DRIVEN THEIR ADOPTION
FIGURE 16 INSTRUMENTS & ACCESSORIES ACCOUNTED FOR THE LARGEST SHARE OF THE NORTH AMERICAN MARKET IN 2019
FIGURE 17 INSTRUMENTS & ACCESSORIES TO ACCOUNT FOR THE LARGEST MARKET SHARE IN 2020
FIGURE 18 ASIA PACIFIC MARKET TO WITNESS THE HIGHEST GROWTH DURING THE FORECAST PERIOD
FIGURE 19 GLOBAL MARKET: DRIVERS, RESTRAINTS, AND OPPORTUNITIES
FIGURE 20 IMPACT OF COVID-19 ON THE GLOBAL MARKET
FIGURE 21 GLOBAL MARKET: ECOSYSTEM
FIGURE 22 NORTH AMERICA TO DOMINATE THE GLOBAL MARKET DURING THE FORECAST PERIOD
FIGURE 23 NORTH AMERICA: MARKET SNAPSHOT
FIGURE 24 ASIA PACIFIC: MARKET SNAPSHOT
FIGURE 25 MARKET EVALUATION FRAMEWORK
FIGURE 26 GLOBAL MARKET SHARE, BY KEY PLAYER, 2019
FIGURE 27 INTUITIVE SURGICAL PRODUCT MIX, 2019
FIGURE 28 SURGICAL ROBOTS MARKET SHARE, BY KEY PLAYER, 2019
FIGURE 29 MEDICATION DISPENSING ROBOTS MARKET SHARE, BY KEY PLAYER, 2019
FIGURE 30 IV ROBOTIC SYSTEMS MARKET SHARE, BY KEY PLAYER, 2019
FIGURE 31 REHABILITATION ROBOTS MARKET SHARE, BY KEY PLAYER, 2019
FIGURE 32 MEDICAL ROBOTS MARKET COMPANY EVALUATION MATRIX, 2019
FIGURE 33 GLOBAL MARKET: COMPETITIVE LEADERSHIP MAPPING, EMERGING PLAYERS, 2019
FIGURE 34 INTUITIVE SURGICAL: COMPANY SNAPSHOT (2019)
FIGURE 35 STRYKER CORPORATION: COMPANY SNAPSHOT (2019)
FIGURE 36 ACCURAY: COMPANY SNAPSHOT (2019)
FIGURE 37 BECTON, DICKINSON AND COMPANY: COMPANY SNAPSHOT (2019)
FIGURE 38 MEDTRONIC: COMPANY SNAPSHOT (2019)
FIGURE 39 OMNICELL: COMPANY SNAPSHOT (2019)
FIGURE 40 ZIMMER BIOMET: COMPANY SNAPSHOT (2019)
FIGURE 41 SMITH & NEPHEW: COMPANY SNAPSHOT (2019)
FIGURE 42 CYBERDYNE: COMPANY SNAPSHOT (2019)
FIGURE 43 EKSO BIONICS: COMPANY SNAPSHOT (2019)
FIGURE 44 TRANSENTERIX: COMPANY SNAPSHOT (2019)
FIGURE 45 REWALK ROBOTICS: COMPANY SNAPSHOT (2019)
FIGURE 46 RENISHAW: COMPANY SNAPSHOT (2019)
FIGURE 47 BIONIK LABORATORIES CORP: COMPANY SNAPSHOT (2019)
This study involved four major activities in estimating the size of the medical robots market. Exhaustive secondary research was done to collect information on the market, peer market, and parent market. The next step was to validate these findings, assumptions, and sizing with industry experts across value chains through primary research. The bottom-up approach was employed to estimate the overall market size. After that, market breakdown and data triangulation were used to estimate the market size of segments and sub-segments.
Secondary Research
The secondary research process involved the widespread use of secondary sources, directories, databases (such as Bloomberg Businessweek, Factiva, and D&B Hoovers), white papers, annual reports, company house documents, investor presentations, and SEC filings of companies. Some non-exclusive secondary sources include the Minimally Invasive Robotic Association (MIRA), Clinical Robotic Surgery Association (CRSA), American Association of Healthcare Administrative Management (AAHAM), Institute for Health Technology Transformation (iHT2 ), World Health Organization (WHO), Centers for Disease Control and Prevention (CDC), Organisation for Economic Co-operation and Development (OECD), American Medical Group Association (AMGA), American Hospital Association (AHA), Expert Interviews, and MarketsandMarkets Analysis.
Secondary research was used to identify and collect information useful for the extensive, technical, market-oriented, and commercial study of the medical robots market. It was also used to obtain important information about the key players and market classification and segmentation according to industry trends to the bottom-most level, and key developments related to market and technology perspectives. A database of the key industry leaders was also prepared using secondary research.
Primary Research
In the primary research process, various sources from both the supply and demand sides were interviewed to obtain qualitative and quantitative information for this report. The primary sources from the supply side include industry experts such as CEOs, vice presidents, marketing and sales directors, technology & innovation directors, and related key executives from various key companies and organizations operating in the medical robots market. The primary sources from the demand side included industry experts, consultants, healthcare providers, healthcare payers, hospital administration, and government bodies. Primary research was conducted to validate the market segmentation, identify key players in the market, and gather insights on key industry trends and key market dynamics.
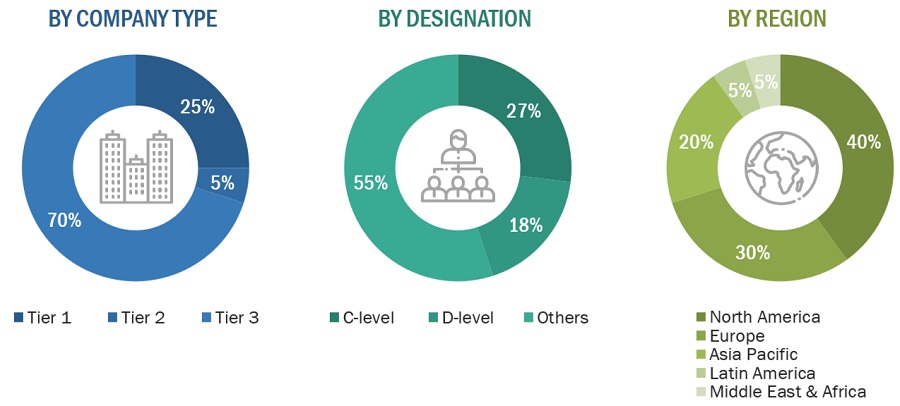
Breakdown of Primary Interviews
To know about the assumptions considered for the study, download the pdf brochure
Tiers are defined based on a company’s total revenue. As of 2019: Tier 1= > USD 2 billion, Tier 2 = USD 50 million to USD 2 billion, and Tier 3= < USD P 50 million. <>
Market Size Estimation
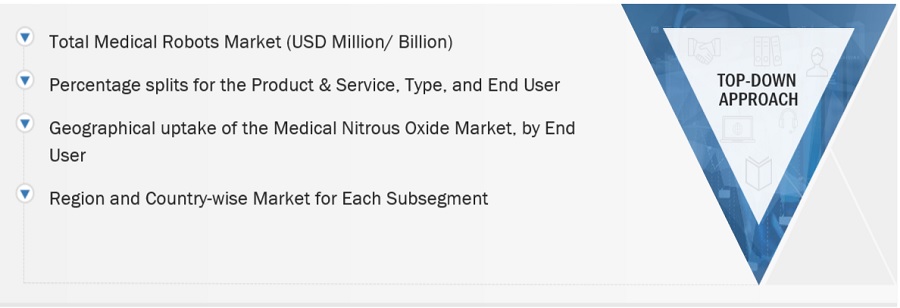
Both top-down and bottom-up approaches were used to estimate and validate the total size of the medical robots market. These methods were also used extensively to estimate the size of various subsegments in the market. The research methodology used to estimate the market size includes the following:
- The key players in the industry and markets have been identified through extensive secondary research
- The industry’s supply chain and market size, in terms of value, have been determined through primary and secondary research processes
- All percentage shares, splits, and breakdowns have been determined using secondary sources and verified through primary sources
Data Triangulation
After arriving at the overall market size—using the market size estimation processes as explained above—the market was split into several segments and sub-segments. To complete the overall market engineering process and arrive at the exact statistics of each market segment and subsegment, the data triangulation, and market breakdown procedures were employed, wherever applicable. The data was triangulated by studying various factors and trends from both the demand and supply sides, in the provider, payer, and other industries.
Report Objectives
- To define, describe, and forecast the global medical robots market by product, application, end user and region
- To provide detailed information regarding the major factors influencing the market growth (such as drivers, restraints, opportunities, and challenges)
- To analyze the micromarkets with respect to individual growth trends, prospects, and contributions to the overall market
- To analyze the opportunities for stakeholders and provide details of the competitive landscape for market leaders
- To forecast the size of the market segments with respect to four main regions, namely,
- North America, Europe, the Asia Pacific, and the Rest of the World
- To profile the key players and analyze their market shares and core competencies
- To track and analyze competitive developments such as product launches, partnerships, agreements, collaborations, expansions, and acquisitions in the overall medical robots market
Available Customizations
MarketsandMarkets offers the following customizations for this market report:
- Additional country-level analysis of medical robots market.
- Profiling of additional market players (up to 3)
Growth opportunities and latent adjacency in Medical Robots Market