Liquid Feed Supplements Market by Type (Protein, Minerals, Vitamins, and Others), Source (Molasses, Corn, Urea, and Others), Livestock (Ruminants, Poultry, Swine, Aquaculture, and Others), and by Region - Global Forecast to 2020


The global liquid feed supplements market is estimated to be valued at USD 4.23 Billion in 2015. The market is projected to grow at a CAGR of 5.5% from 2015 to 2020 and reach USD 5.53 Billion by 2020.
The market is segmented on the basis of its type, source, and livestock. It is further segmented on the basis of regions, such as North America, Europe, Asia-Pacific, Latin America, and the Rest of the World (RoW). With the increasing demand of livestock products, the global market is expected to grow in future years. The years considered for the study are as follows:
- Base Year – 2014
- Estimated Year – 2015
- Projected Year – 2020
- Forecast Period – 2015 to 2020
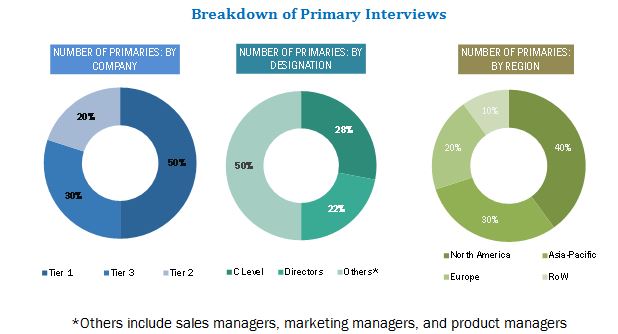
This report includes the estimation of market sizes for value (USD million) and volume (KT). Top-down and bottom-up approaches have been used to estimate and validate the size of the liquid feed supplements market and to estimate the size of various other dependent submarkets. Key players in the market have been identified through secondary research, and their market share has been determined through primary and secondary research. All percentage shares, splits, and breakdowns have been determined using secondary sources and were verified through primary sources.
This report provides both qualitative and quantitative analyses of the liquid feed supplements market, the competitive landscape, and the preferred development strategies of key players. The key players preferred new product development, acquisition, expansion & collaboration, and joint venture as preferred strategies to gain a larger share in the market.
Market Ecosystem:
The upstream players such as the raw material suppliers of the liquid feed supplements and the downstream stakeholders such as the manufacturers and end-user industries of the liquid feed supplements influence the global market.
Target Audience
The report is targeted toward the existing players in the industry, which include feed manufacturers and research institutions. Key participants in the supply chain of the liquid feed supplements are raw material suppliers, government bodies, distributors, and end users.
Manufacturing companies who offer the liquid feed supplements to other end users have been included in this report. For instance, Archer Daniels Midland Company (U.S.) Cargill, Incorporated (U.S.), GrainCorp Ltd. (Austria), Land O’ Lakes (U.S.), and BASF SE (Germany) are the top five major manufacturing companies profiled in this report.
Scope of the Report
On the basis of Type, the market is segmented as follows:
- Protein
- Minerals
- Vitamins
- Others (acids, enzymes, and fats)
On the basis of Source, the market is segmented as follows:
- Molasses (prills and granules)
- Corn
- Urea
- Others (soy and wheat bran)
On the basis of Livestock, the market is segmented as follows:
- Ruminants
- Poultry
- Swine
- Aquaculture
- Others (horses and monkeys)
On the basis of Region, the market is segmented as follows:
- North America
- Europe
- Asia-Pacific
- Latin America
- RoW
Available Customizations
With the given market data, MarketsandMarkets offers customizations according to the client-specific needs.
The following customization options are available for the report:
Product Analysis
- Product matrix, which gives a detailed comparison of the product portfolio of each company
Company Information
- Detailed analysis and profiling of additional market players (up to five)
The liquid feed supplements market is projected to grow at a CAGR of 5.5% from 2015 to reach a value of USD 5.53 Billion by 2020. The market growth is driven by increasing demand for products derived from livestock. The market is further driven by factors such as rising awareness about animal health, feed quality among farmers, and increasing livestock production cost.
Depending upon the types, the market is led by the protein segment, followed by minerals and vitamins.. Molasses, corn, urea, and others are the major sources in the market. When used in cattle feed, molasses increases palatability of the feed and also has a high bioavailability, and as a result, manufacturers prefer molasses to be included in the liquid feed to enhance palatability and cost reduction. Among the livestock, that is, ruminants, poultry, swine, aquaculture, and others, the ruminants segment accounted for the largest market share in 2014, which is followed by the poultry segment in 2014.
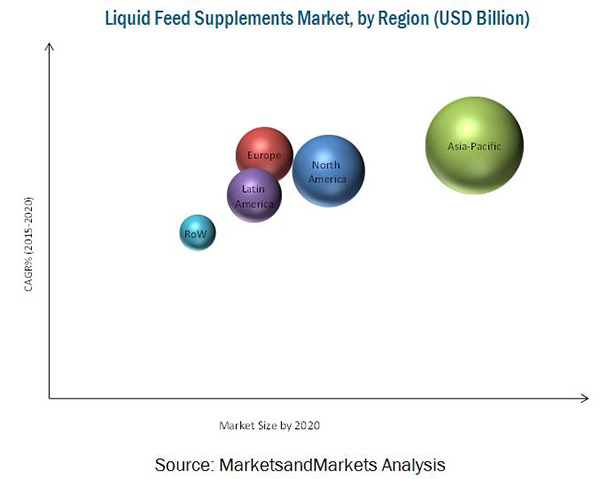
Asia-Pacific accounted for the largest share in the liquid feed supplements market, followed by North America and Europe. Adoption of molasses and liquid feed for livestock is increasing in emerging countries such as Brazil, China, India, and Japan, which is supported by a high presence of protein effectiveness in cost. The Asia-Pacific region is projected to be the fastest-growing market owing to investments from several multinational manufacturers and growing awareness regarding uses of liquid feed supplements, especially in countries such as China and India.
The different regulatory structures and interventions in different countries around the globe, related to the usage of liquid feed supplements in ruminants and loss of synthetic amino acids during the storage of liquid feed supplements, may hinder the growth of the market.
The key market players that dominated the market include Cargill, Incorporated (U.S.), Archer Daniels Midland Company (U.S.), Land O’Lakes Inc. (U.S.), BASF SE (Germany), and GrainCorp Ltd. (Australia). Most key participants have been exploring new regions through acquisition and investing in new product development in the liquid feed supplements market, to avail a competitive advantage through combined synergies. Since 2013, the global market has witnessed an increase in demand, especially in developing nations such as India, China, Brazil, and Japan.
 Exclusive indicates content/data unique to MarketsandMarkets and not available with any competitors.
Table of Contents
1 Introduction (Page No. - 14)
1.1 Objectives of the Study
1.2 Market Definition
1.3 Market Scope
1.3.1 Markets Covered
1.3.2 Years Considered for the Study
1.4 Currency
1.5 Limitations
1.6 Stakeholders
2 Research Methodology (Page No. - 17)
2.1 Research Data
2.1.1 Research Design
2.1.2 Secondary Data
2.1.2.1 Key Data From Secondary Sources
2.1.3 Primary Data
2.1.3.1 Key Data From Primary Sources
2.1.3.2 Key Industry Insights
2.1.3.3 Breakdown of Primary Interviews
2.2 Factor Analysis
2.2.1 Introduction
2.2.2 Demand-Side Analysis
2.2.2.1 Increase in Total Feed Production
2.2.3 Supply-Side Analysis
2.2.3.1 Fluctuations in Raw Material Prices
2.3 Market Size Estimation
2.3.1 Bottom-Up Approach
2.3.2 Top-Down Approach
2.4 Market Breakdown & Data Triangulation
2.5 Research Assumptions & Limitations
2.5.1 Limitations
3 Executive Summary (Page No. - 29)
4 Premium Insights (Page No. - 35)
4.1 Attractive Opportunities in the Market
4.2 Liquid Feed Supplements Market, By Type
4.3 Market Size, By Type & Region, 2014
4.4 Asia-Pacific: the Largest Consumer of Liquid Feed Supplements
4.5 Market, By Livestock
4.6 Asia-Pacific: the Largest Consumer of Liquid Feed Supplements
4.7 Liquid Feed Supplements Market Life Cycle Analysis, By Region
5 Market Overview (Page No. - 42)
5.1 Introduction
5.2 Market Segmentation
5.2.1 Liquid Feed Supplements Market, By Type
5.2.2 Market, By Source
5.2.3 Market, By Livestock
5.3 Market Dynamics
5.3.1 Drivers
5.3.1.1 Increased Demand for Products Derived From Animals
5.3.1.1.1 Increasing Meat Consumption
5.3.1.1.2 Growing Dairy Industry
5.3.1.1.3 Increasing Consumption of Egg
5.3.1.2 Rising Awareness About Animal Health & Feed Quality
5.3.1.3 Increased Availability of Liquid By-Products From Several Industries
5.3.1.4 A Solution to Poor Pasture
5.3.2 Restrains
5.3.2.1 Regulatory Structure & Interventions
5.3.2.2 Loss of Synthetic Amino Acids During Storage of Liquid Feeds
5.3.3 Opportunities
5.3.3.1 Increasing Market Opportunities in Asia-Pacific & Latin America
5.3.3.2 Increasing Research & Technological Advancements in the Feed Industry
5.3.4 Challenges
5.3.4.1 Varying Consumers’ Requirement
5.3.4.2 High Water & Salt Content of By-Products
6 Industry Trends (Page No. - 54)
6.1 Introduction
6.2 Value Chain Analysis
6.3 Supply Chain Analysis
6.3.1 Prominent Companies
6.3.2 Small & Medium Enterprises
6.3.3 End Users (Manufacturers/Consumers)
6.3.4 Key Influencers
6.4 Porter’s Five Forces Analysis
6.4.1 Intensity of Competitive Rivalry
6.4.2 Bargaining Power of Suppliers
6.4.3 Bargaining Power of Buyers
6.4.4 Threat of New Entrants
6.4.5 Threat of Substitutes
6.5 Regulatory System for Feed Liquid Feed Supplements Safety
6.5.1 Regulations Laid By the European Commission
6.5.2 Regulations Laid By the U.S. Food & Drug Administration (USFDA)
6.5.3 Regulations Laid By the Bureau of Indian Standards
7 Market for Liquid Feed Supplements, By Type (Page No. - 65)
7.1 Introduction
7.2 Protein
7.3 Minerals
7.4 Vitamins
7.5 Others
8 Market for Liquid Feed Supplements, By Source (Page No. - 72)
8.1 Introduction
8.2 Molasses
8.3 Corn
8.4 Urea
8.5 Others
9 Market for Liquid Feed Supplements, By Livestock (Page No. - 79)
9.1 Introduction
9.2 Ruminants
9.3 Poultry
9.4 Swine
9.5 Aquaculture
9.6 Others
10 Market for Liquid Feed Supplements, By Region (Page No. - 88)
10.1 Introduction
10.2 North America
10.2.1 U.S.
10.2.2 Canada
10.2.3 Mexico
10.3 Europe
10.3.1 U.K.
10.3.2 Germany
10.3.3 France
10.3.4 Italy
10.3.5 Spain
10.3.6 Russia
10.3.7 Rest of Europe
10.4 Asia-Pacific
10.4.1 China
10.4.2 India
10.4.3 Japan
10.4.4 Indonesia
10.4.5 Rest of Asia-Pacific
10.5 Latin America
10.5.1 Brazil
10.5.2 Argentina
10.5.3 Rest of Latin America
10.6 Rest of the World (RoW)
10.6.1 Africa
10.6.2 The Middle East
10.6.3 Others in RoW
11 Competitive Landscape (Page No. - 125)
11.1 Overview
11.2 Market Share Analysis
11.3 Competitive Situation & Trends
11.3.1 New Product Launches
11.3.2 Acquisitions
11.3.3 Expansions
11.3.4 Partnerships & Collaborations
11.3.5 Joint Ventures & Agreements
12 Company Profiles (Page No. - 133)
(Company at A Glance, Recent Financials, Products & Services, Strategies & Insights, & Recent Developments)*
12.1 Introduction
12.2 Cargill, Incorporated
12.3 BASF SE
12.4 Archer Daniels Midland Company
12.5 Land O’lakes, Inc.
12.6 Graincorp Ltd.
12.7 Ridley Corporation Limited
12.8 Quality Liquid Feeds, Inc.
12.9 Performance Feeds
12.10 Westway Feed Products LLC
12.11 Dallas Keith Ltd.
*Details on Company at A Glance, Recent Financials, Products & Services, Strategies & Insights, & Recent Developments Might Not Be Captured in Case of Unlisted Companies.
13 Appendix (Page No. - 155)
13.1 Discussion Guide
13.2 Knowledge Store: Marketsandmarkets’ Subscription Portal
13.3 Introducing RT: Real Time Market Intelligence
13.4 Available Customizations
13.5 Related Reports
List of Tables (74 Tables)
Table 1 Per Capita Consumption of Meat, By Region
Table 2 European Communities (Protein Feeding Stuff) (Amendment) Regulations, 1996
Table 3 Market Size, By Type, 2013-2020 (USD Million)
Table 4 Liquid Feed Supplements Market Size, By Type, 2013-2020 (KT)
Table 5 Protein: Liquid Feed Supplements Market Size, By Region, 2013-2020 (USD Million)
Table 6 Minerals: Market Size for Liquid Feed Supplements, By Region, 2013-2020 (USD Million)
Table 7 Vitamins: Market Size for Liquid Feed Supplements, By Region, 2013-2020 (USD Million)
Table 8 Others: By Market Size, By Region, 2013-2020 (USD Million)
Table 9 Liquid Feed Supplements Market Size, By Source, 2013-2020 (USD Million)
Table 10 Market Size, By Source, 2013-2020 (KT)
Table 11 Molasses: Market Size for Liquid Feed Supplements, By Region, 2013-2020 (USD Million)
Table 12 Corn: By Market Size, By Region, 2013-2020 (USD Million)
Table 13 Urea: Market Size for Liquid Feed Supplements, By Region, 2013-2020 (USD Million)
Table 14 Others: Liquid Feed Supplements Market Size, By Region, 2013-2020 (USD Million)
Table 15 Liquid Feed Supplements Market Size, By Livestock, 2013-2020 (USD Million)
Table 16 Market Size, By Livestock, 2013-2020 (KT)
Table 17 Ruminants: Liquid Feed Supplements Market Size, By Region, 2013-2020 (USD Million)
Table 18 Poultry: Market Size for Liquid Feed Supplements, By Region, 2013-2020 (USD Million)
Table 19 Swine: Market Size for Liquid Feed Supplements, By Region, 2013-2020 (USD Million)
Table 20 Aquaculture: By Market Size, By Region, 2013-2020 (USD Million)
Table 21 Others: Market Size for Liquid Feed Supplements, By Region, 2013-2020 (USD Million)
Table 22 Liquid Feed Supplements Market Size, By Region, 2013-2020 (USD Million)
Table 23 Market Size, By Region, 2013-2020 (KT)
Table 24 North America: Liquid Feed Supplements Market Size, By Country, 2013-2020 (USD Million)
Table 25 North America: Market Size, By Country, 2013-2020 (KT)
Table 26 North America:Market Size, By Type, 2013-2020 (USD Million)
Table 27 North America: Market Size, By Source, 2013-2020 (USD Million)
Table 28 North America: Market Size, By Livestock, 2013-2020 (USD Million)
Table 29 U.S.: Liquid Feed Supplements Market Size, By Type, 2013–2020 (USD Million)
Table 30 Canada: Market Size for Liquid Feed Supplements, By Type, 2013–2020 (USD Million)
Table 31 Mexico: Market Size for Liquid Feed Supplements, By Type, 2013–2020 (USD Million)
Table 32 Europe: Liquid Feed Supplements Market Size, By Country, 2013-2020 (USD Million)
Table 33 Europe: Market Size, By Country, 2013-2020 (KT)
Table 34 Europe: Market Size, By Type, 2013-2020 (USD Million)
Table 35 Europe: Market Size, By Source, 2013-2020 (USD Million)
Table 36 Europe: Market Size, By Livestock, 2013-2020 (USD Million)
Table 37 U.K.: Liquid Feed Supplements Market Size, By Type, 2013–2020 (USD Million)
Table 38 Germany: Market Size for Liquid Feed Supplements, By Type, 2013–2020 (USD Million)
Table 39 France: By Market Size, By Type, 2013–2020 (USD Million)
Table 40 Italy: Market Size for Liquid Feed Supplements, By Type, 2013–2020 (USD Million)
Table 41 Spain: Liquid Feed Supplements Market Size, By Type, 2013–2020 (USD Million)
Table 42 Russia: Market Size for Liquid Feed Supplements, By Type, 2013–2020 (USD Million)
Table 43 Rest of Europe: By Market Size, By Type, 2013–2020 (USD Million)
Table 44 Asia-Pacific: Liquid Feed Supplements Market Size, By Country, 2013–2020 (USD Million)
Table 45 Asia-Pacific: Market Size, By Country, 2013–2020 (KT)
Table 46 Asia-Pacific: Market Size, By Type, 2013–2020 (USD Million)
Table 47 Asia-Pacific: Market Size, By Source, 2013-2020 (USD Million)
Table 48 Asia-Pacific: Market Size, By Livestock, 2013-2020 (USD Million)
Table 49 China: Liquid Feed Supplements Market Size, By Type, 2013–2020 (USD Million)
Table 50 India: Market Size for Liquid Feed Supplements, By Type, 2013–2020 (USD Million)
Table 51 Japan: Market Size for Liquid Feed Supplements, By Type, 2013–2020 (USD Million)
Table 52 Indonesia: Liquid Feed Supplements Market Size, By Type, 2013–2020 (USD Million)
Table 53 Rest of Asia-Pacific: Liquid Feed Supplements Market Size, By Type, 2013–2020 (USD Million)
Table 54 Latin America: Market Size for Liquid Feed Supplements, By Country, 2013-2020 (USD Million)
Table 55 Latin America: Market Size, By Country, 2013-2020 (KT)
Table 56 Latin America: Market Size, By Type, 2013-2020 (USD Million)
Table 57 Latin America: Market Size, By Source, 2013-2020 (USD Million)
Table 58 Latin America: Market Size, By Livestock, 2013-2020 (USD Million)
Table 59 Brazil: Liquid Feed Supplements Market Size, By Type, 2013–2020 (USD Million)
Table 60 Argentina: By Market Size, By Type, 2013–2020 (USD Million)
Table 61 Rest of Latin America: Liquid Feed Supplements Market Size, By Type, 2013–2020 (USD Million)
Table 62 RoW: Liquid Feed Supplements Market Size, By Region, 2013–2020 (USD Million)
Table 63 RoW: Market Size, By Country, 2013–2020 (KT)
Table 64 RoW: Market Size, By Type, 2013–2020 (USD Million)
Table 65 RoW: Market Size, By Source 2013-2020 (USD Million)
Table 66 RoW: Market Size, By Livestock, 2013-2020 (USD Million)
Table 67 Africa: Market Size for Liquid Feed Supplements, By Type, 2013–2020 (USD Million)
Table 68 Middle East: Liquid Feed Supplements Market Size, By Type, 2013–2020 (USD Million)
Table 69 Others in RoW: Market Size for Liquid Feed Supplements, By Type, 2013–2020 (USD Million)
Table 70 New Product Launches, 2011–2015
Table 71 Acquisitions, 2011–2015
Table 72 Expansions, 2014–2015
Table 73 Partnerships & Collaborations, 2011-2013
Table 74 Joint Ventures & Agreements , 2015
List of Figures (54 Figures)
Figure 1 Market Segmentation
Figure 2 Global Feed Production, 2011-2014 (Million Tons)
Figure 3 Global Feed Production, By Region, 2014 (Million Tons)
Figure 4 Global Average Price of Raw Materials, 1960-2014 (USD/Mt)
Figure 5 Market Size Estimation Methodology: Bottom-Up Approach
Figure 6 Market Size Estimation Methodology: Top-Down Approach
Figure 7 Data Triangulation
Figure 8 Liquid Feed Supplements Market, By Type, 2015 vs 2020 (USD Million)
Figure 9 Market, By Source, 2015 vs 2020 (USD Million)
Figure 10 Market, By Livestock, 2015 vs 2020 (USD Million)
Figure 11 Liquid Feed Supplements Market Trend, By Region, 2013-2020
Figure 12 Top Five Markets, By Country, 2015 vs 2020 (USD Million)
Figure 13 Asia-Pacific Projected to Be the Fastest-Growing Market From 2015 to 2020
Figure 14 An Emerging Market With Promising Growth Potential, 2015-2020 (USD Million)
Figure 15 Proteins Segment Projected to Be the Largest By 2020
Figure 16 Asia-Pacific Market Exhibited Significant Market for Proteins, 2014 (USD Million)
Figure 17 Evolving Livestock Management Practices Strengthen the Demand in Asia-Pacific Region - 2014
Figure 18 The Ruminants Segment Projected to Be the Largest Market During the Forecast Period in 2014
Figure 19 Evolving Livestock Management Practices Strengthen the Demand in Asia-Pacific Region - 2014
Figure 20 Asia-Pacific Liquid Feed Supplements Market is Experiencing High Growth in 2014
Figure 21 Market, By Type
Figure 22 Market, By Source
Figure 23 Liquid Feed Supplements Market, By Livestock
Figure 24 Liquid Feed Supplements: Drivers, Restraints, Opportunities, and Challenges
Figure 25 Global Per Capita Meat Consumption, 1965–2016 (Pounds)
Figure 26 Global Milk Consumption, By Region, 2009–2014 (Liters, Per Capita)
Figure 27 Consumption of Eggs, Per Person - 2014
Figure 28 Liquid Feed Supplements: Value Chain
Figure 29 Liquid Feed Supplements: Supply Chain
Figure 30 Porter’s Five Forces Analysis: Liquid Feed Supplements
Figure 31 Liquid Feed Supplements Market Size, By Type, 2015 vs 2020 (USD Million)
Figure 32 Protein: Liquid Feed Supplements Market Size, By Region, 2015 vs 2020 (USD Million)
Figure 33 Molasses to Be the Fastest-Growing Segment of Liquid Feed Supplements, 2015 vs 2020 (USD Million)
Figure 34 Molasses is Expected to Dominate the Asia-Pacific Market, 2015 vs 2020 (USD Million)
Figure 35 Market Size, By Livestock, 2014 (USD Million)
Figure 36 Ruminants: the Largest Liquid Feed Supplements Market, By Region, 2015-2020 (USD Million)
Figure 37 Poultry: Liquid Feed Supplements Market Size, By Region, 2015-2020 (USD Million)
Figure 38 Geographic Snapshot Rapidly Growing Markets are Emerging as New Hotspots (2015-2020)
Figure 39 North American Liquid Feed Supplements Market: A Snapshot
Figure 40 European Liquid Feed Supplements Market: A Snapshot
Figure 41 Asia-Pacific Liquid Feed Supplements Market: A Snapshot
Figure 42 Acquisitions and New Product Launches Were Preferred By Key Liquid Feed Supplements Companies Between 2011 to 2015
Figure 43 Liquid Feed Supplements Market Share (Segmental Revenue), By Key Player, 2014
Figure 44 Expansions Fueled Growth & Innovation of Liquid Feed Supplements Between 2011 and 2015
Figure 45 Acquisitions & New Product Launches: the Key Strategies, 2011–2015
Figure 47 Cargill, Incorporated: Company Snapshot
Figure 48 BASF SE: Company Snapshot
Figure 49 Archer Daniels Midland Company: Company Snapshot
Figure 50 Land O’lakes, Inc.: Company Snapshot
Figure 51 Graincorp Ltd: Company Snapshot
Figure 52 Ridley Corporation Limited: Company Snapshot
Figure 53 Marketsandmarkets Knowledge Store Snapshot
Figure 54 Marketsandmarkets Knowledge Store: Agriculture Industry Snapshot


Growth opportunities and latent adjacency in Liquid Feed Supplements Market