Micromachining Market by Type (Traditional, Non-traditional, Hybrid), Process (Additive, Subtractive, Others), Axis (3 axes, 4 axes, 5 axes), Industry (Automotive, Aerospace & Defense), and Geography - Global Forecast to 2036


Micromachining Market Summary
The Micromachining Market was valued at approximately USD 3.6 billion in 2025 and is projected to reach USD 9.8 billion by 2036, growing at a CAGR of 9.5% during the forecast period (2025–2036). The market is witnessing steady expansion as industries increasingly demand ultra-precision manufacturing for miniaturized components across electronics, medical devices, aerospace, and automotive sectors. The surge in adoption is largely driven by advancements in artificial intelligence (AI), Internet of Things (IoT), and industrial automation, which are transforming manufacturing processes and enabling high-precision fabrication at micro and nano scales. The integration of digital manufacturing techniques, including computer numerical control (CNC), laser-based machining, and smart factory systems, is accelerating demand. As industries shift toward lightweight, compact, and energy-efficient designs, micromachining technologies are becoming indispensable for achieving high accuracy, reduced material waste, and enhanced production efficiency.
Key Market Trends & Insights
The Micromachining Market is shaped by rapid technological innovation and evolving industrial requirements. North America leads the market due to its advanced manufacturing ecosystem and early adoption of precision engineering technologies. Asia Pacific is the fastest-growing region, driven by expanding electronics manufacturing, semiconductor production, and industrial automation. Laser micromachining dominates the technology segment, owing to its precision, flexibility, and non-contact processing capabilities. Emerging trends include the integration of AI-driven process optimization, real-time monitoring systems, and automated quality control. Additionally, the convergence of micromachining with additive manufacturing and Industry 4.0 technologies is creating new opportunities for hybrid manufacturing solutions.
Market Size & Forecast
-
Base Year Market Size (2025): USD 3.6 Billion
-
Forecast Value (2036): USD 9.8 Billion
-
CAGR (2025–2036): 9.5%
-
Growth is driven by increasing demand for miniaturized components, advancements in laser machining technologies, and rising adoption of automation in manufacturing.
Micromachining Market Top 10 key takeaway
-
The Micromachining Market is projected to grow at a CAGR of 9.5% through 2036.
-
North America dominates due to advanced manufacturing capabilities.
-
Asia Pacific is the fastest-growing region with strong industrial expansion.
-
Laser micromachining is the leading technology segment.
-
AI integration is enhancing precision and process optimization.
-
Increasing demand for miniaturized electronics is driving growth.
-
Medical device manufacturing is a key application area.
-
Automation is improving efficiency and reducing production costs.
-
Hybrid manufacturing technologies are emerging as a trend.
-
Rising investments in semiconductor manufacturing are boosting demand.
Product Insights
The laser micromachining segment dominates the Micromachining Market, primarily due to its ability to deliver high precision, minimal thermal damage, and flexibility across a wide range of materials. Laser-based systems are widely used in applications such as micro-drilling, micro-cutting, and surface structuring, making them essential for industries like electronics and medical devices. The non-contact nature of laser micromachining reduces wear and tear on tools, ensuring consistent performance and lower maintenance costs.
Mechanical micromachining, including CNC-based micro-milling and micro-turning, continues to hold a significant share, particularly in applications requiring high material removal rates. Emerging product categories include ultrasonic micromachining and electrochemical micromachining, which offer unique advantages for processing hard and brittle materials. The integration of AI-driven control systems into micromachining equipment is enabling real-time adjustments, predictive maintenance, and enhanced precision, further improving productivity and efficiency.
Technology / Component Insights
The Micromachining Market is driven by advancements in laser technology, CNC systems, and micro-electromechanical systems (MEMS) fabrication techniques. Laser micromachining, particularly femtosecond and picosecond laser technologies, is revolutionizing the market by enabling ultra-precise material processing with minimal heat-affected zones. CNC-based micromachining systems provide high accuracy and repeatability, making them suitable for mass production.
AI and machine learning are playing a crucial role in optimizing micromachining processes by enabling predictive analytics, process monitoring, and automated quality control. IoT integration allows for real-time data collection and connectivity between machines, facilitating smart manufacturing environments. Cloud computing supports data storage and analysis, enabling remote monitoring and optimization of production processes.
Future innovation trends include the development of hybrid manufacturing systems that combine additive and subtractive processes, as well as the use of advanced materials such as composites and nanomaterials. The adoption of digital twins and simulation technologies is also expected to enhance process efficiency and reduce production costs.
Application Insights
The electronics and semiconductor industry represents the leading application segment in the Micromachining Market, driven by the increasing demand for miniaturized components and high-performance devices. Micromachining is widely used in the fabrication of microchips, sensors, and circuit boards, where precision and accuracy are critical.
The medical device industry is another significant application area, where micromachining is used to manufacture components such as stents, implants, and surgical instruments. The ability to produce intricate and precise designs makes micromachining essential for advanced medical technologies. Other applications include aerospace, automotive, and defense, where micromachining is used for precision components and lightweight structures.
Future opportunities lie in the integration of micromachining with emerging technologies such as 5G, IoT, and autonomous systems. The growing demand for high-performance and energy-efficient devices is expected to further drive the adoption of micromachining technologies.
Regional Insights
North America leads the Micromachining Market, supported by a strong manufacturing base, advanced technological infrastructure, and significant investments in research and development. The region’s focus on innovation and adoption of Industry 4.0 technologies has driven the demand for precision manufacturing solutions.
Europe is experiencing steady growth, driven by the presence of established automotive and aerospace industries, as well as increasing investments in advanced manufacturing technologies. The region is focusing on sustainability and efficiency, further boosting the adoption of micromachining.
Asia Pacific is the fastest-growing region, fueled by rapid industrialization, expanding electronics and semiconductor industries, and increasing adoption of automation. Countries such as China, Japan, and South Korea are investing heavily in advanced manufacturing technologies, driving market growth.
-
North America leads due to advanced manufacturing and R&D
-
Europe shows steady growth driven by automotive and aerospace sectors
-
Asia Pacific is the fastest-growing region
-
Government initiatives are supporting industrial automation
-
Rising demand for electronics and semiconductors is driving growth
Country-Specific Market Trends
In Asia Pacific, China dominates the Micromachining Market with a projected CAGR of 10.8%, driven by its strong manufacturing base and investments in semiconductor production. Japan follows with a CAGR of 9.7%, focusing on precision engineering and advanced manufacturing technologies.
In North America, the United States leads the market due to its advanced industrial infrastructure and adoption of AI-driven manufacturing solutions. Canada and Mexico are experiencing steady growth, with CAGRs ranging from 8.5% to 9.2%, supported by increasing investments in manufacturing and industrial automation.
In Europe, Germany and France are key contributors to market growth, with CAGRs of approximately 9.0% and 8.7%, respectively. These countries are focusing on integrating micromachining with Industry 4.0 technologies to enhance productivity and efficiency.
-
China leads APAC with strong manufacturing capabilities
-
Japan focuses on precision engineering and innovation
-
United States dominates North America market
-
Canada and Mexico show steady growth trends
-
Germany and France lead Europe in advanced manufacturing adoption
Key Micromachining Company Insights
The Micromachining Market is highly competitive, with companies focusing on innovation, automation, and strategic collaborations to strengthen their market position. Leading players are investing in advanced laser technologies, AI integration, and smart manufacturing solutions to enhance their product offerings.
Major companies include IPG Photonics Corporation, Coherent Corp., Trumpf Group, Lumentum Holdings Inc., GF Machining Solutions, Makino Milling Machine Co., Ltd., Mitsubishi Electric Corporation, Han’s Laser Technology Industry Group Co., Ltd., Oxford Instruments plc, and Electro Scientific Industries (ESI). These companies are leveraging AI and automation to improve precision, reduce production costs, and expand their market presence.
-
Companies are investing in advanced laser micromachining technologies
-
AI-driven process optimization is a key focus area
-
Strategic partnerships are driving innovation
-
Automation is enhancing manufacturing efficiency
-
Expansion into emerging markets is a major growth strategy
Recent Developments
Recent developments in the Micromachining Market highlight the increasing focus on innovation and efficiency. In 2025, a leading manufacturer introduced a femtosecond laser micromachining system designed for semiconductor applications, offering enhanced precision and reduced processing time. Another company launched an AI-powered micromachining platform that enables real-time process optimization and predictive maintenance. Additionally, a strategic partnership between a micromachining firm and an automotive manufacturer aims to develop advanced components for electric vehicles using precision machining technologies.
Market Segmentation
The Micromachining Market is segmented based on product, technology/component, application, and region. By product, the market includes laser micromachining, mechanical micromachining, ultrasonic micromachining, and electrochemical micromachining, with laser micromachining dominating due to its precision and versatility. By technology, the market is segmented into CNC systems, laser systems, and MEMS fabrication technologies. Application-wise, the market covers electronics, medical devices, aerospace, automotive, and defense. Regionally, the market is divided into North America, Europe, Asia Pacific, and Rest of the World.
-
Laser micromachining dominates the product segment
-
CNC and laser systems are key technology segments
-
Electronics is the leading application area
-
Asia Pacific offers the highest growth potential
-
Hybrid manufacturing solutions are gaining traction
Conclusion
The Micromachining Market is poised for significant growth through 2036, driven by advancements in AI, IoT, and automation technologies. As industries continue to demand high-precision, miniaturized components, micromachining will play a critical role in enabling next-generation manufacturing processes. The integration of digital technologies and smart manufacturing solutions is expected to further enhance efficiency, accuracy, and scalability. With strong growth potential across regions and industries, the micromachining market represents a strategic opportunity for businesses to innovate and remain competitive in the evolving industrial landscape.
FAQs
1. What is the current market size of the Micromachining Market?
The market was valued at approximately USD 3.6 billion in 2025.
2. What is the expected growth rate of the market?
The market is expected to grow at a CAGR of 9.5% from 2025 to 2036.
3. What are the key drivers of market growth?
Key drivers include AI integration, IoT adoption, automation, and increasing demand for miniaturized components.
4. Which region dominates the market?
North America currently holds the largest market share.
5. Who are the key players in the market?
Major companies include IPG Photonics Corporation, Coherent Corp., and Trumpf Group.
To speak to our analyst for a discussion on the above findings, click Speak to Analyst
 Exclusive indicates content/data unique to MarketsandMarkets and not available with any competitors.
Table of Contents
1 Introduction (Page No. - 17)
1.1 Study Objectives
1.2 Definition
1.3 Study Scope
1.3.1 Markets Covered
1.3.2 Inclusions/Exclusions
1.3.3 Years Considered
1.4 Currency
1.5 Limitations
1.6 Stakeholders
2 Research Methodology (Page No. - 21)
2.1 Introduction
2.1.1 Secondary Data
2.1.1.1 List of Major Secondary Sources
2.1.1.2 Key Data From Secondary Sources
2.1.2 Primary Data
2.1.2.1 Breakdown of Primaries
2.1.2.2 Key Data From Primary Sources
2.1.3 Secondary and Primary Research
2.1.3.1 Key Industry Insights
2.2 Market Size Estimation
2.2.1 Bottom-Up Approach
2.2.1.1 Approach for Arriving at the Market Size Using the Bottom-Up Analysis
2.2.2 Top-Down Approach
2.2.2.1 Approach for Arriving at the Market Size Using the Bottom-Up Analysis
2.3 Market Breakdown and Data Triangulation
2.4 Research Assumptions
3 Executive Summary (Page No. - 30)
4 Premium Insights (Page No. - 35)
4.1 Micromachining Market
4.2 Micromachining Market, By Type (2020–2025)
4.3 Micromachining Market, By Process (2020 and 2025)
4.4 Micromachining Market, By Axis (2020 and 2025)
4.5 Micromachining Market, By Industry (2020 and 2025)
4.6 Market, By Region (2020–2025)
5 Market Overview (Page No. - 38)
5.1 Introduction
5.2 Market Dynamics
5.2.1 Drivers
5.2.1.1 Demand for the Miniaturization of Microelectronic Devices
5.2.1.2 Laser-Based Material Micromachining Preferred Over the Traditional Approach
5.2.2 Restraints
5.2.2.1 Regulatory Compliances
5.2.3 Opportunities
5.2.3.1 Development of the Sensor Fusion Technology
5.2.4 Challenges
5.2.4.1 Requirement of Low-Cost Solutions
5.2.4.2 Environmental Concerns Over the Use of Rare Earth Elements
6 Micromachining Market, By Type (Page No. - 42)
6.1 Introduction
6.2 Traditional
6.2.1 Traditional Type to Lead the Automotive Market
6.2.1.1 Mechanical
6.2.1.1.1 Micro Milling
6.2.1.1.2 Micro Turning
6.2.1.2 Lithographie, Galvanoformung & Abformung (LIGA)
6.3 Non-Traditional
6.3.1 Non-Traditional Type Micromachining to Lead the Market
6.3.1.1 Electro-Chemical Micromachining (ECM)
6.3.1.2 Electrical Discharge Micromachining (EDM)
6.3.1.3 Ultrasonic Micromachining
6.3.1.4 Laser Micromachining
6.4 Hybrid Micromachining
6.4.1 Subtractive Process Leads the Hybrid Micromachining Market
7 Micromachining Market, By Process (Page No. - 50)
7.1 Introduction
7.2 Additive
7.2.1 Additive Process to Grow at the Highest CAGR in the Micromachining Market
7.2.1.1 Surface Micromachining
7.2.1.1.1 Chemical Vapor Deposition (CVD)
7.2.1.1.1.1 Low Pressure CVD
7.2.1.1.1.2 Plasma Enhanced CVD
7.2.1.1.2 Electro Deposition
7.2.1.1.3 Epitaxy
7.2.1.1.4 Physical Vapor Deposition (Pvd)
7.3 Subtractive
7.3.1 Subtractive Process Projected to Lead the Market During the Forecast Period
7.3.1.1 Bulk Micromachining
7.3.1.1.1 Wet Etching
7.3.1.1.2 Dry Etching
7.3.1.2 Micro Cutting
7.3.1.3 Micro Drilling
7.3.1.4 Micro Texturing
7.3.1.5 Micro Ablating
7.3.1.6 Micro Scribing
7.3.1.7 Micro Engraving
7.4 Others
7.4.1 Joining
7.4.1.1 Micro Welding
7.4.2 Modifications
7.4.2.1 Micro Marking
7.4.2.2 Micro Perforating
8 Micromachining Market, By Axis (Page No. - 60)
8.1 Introduction
8.2 3 Axes
8.2.1 3 Axes Micromachining to Lead the Market During the Forecast Period
8.3 4 Axes
8.3.1 Non-Traditional Micromachining Projected to Lead the Market in 4 Axes Machines During the Forecast Period
8.4 5 Axes
8.4.1 5 Axes Micromachining to Grow at the Highest CAGR During the Forecast Period
8.5 Others
9 Micromachining Market, By Industry (Page No. - 68)
9.1 Introduction
9.2 Automotive
9.2.1 Non-Traditional Micromachining is Projected to Lead the Market in the Automotive Segment
9.3 Semiconductors & Electronics
9.3.1 Subtractive Process is Projected to Lead the Semiconductors & Electronics Industry
9.4 Aerospace & Defense
9.4.1 3 Axes and 5 Axes to Lead the Aerospace & Defense Market
9.5 Medical & Aesthetics
9.5.1 Europe Projected to Lead the Market in the Medical & Aesthetics Segment
9.6 Telecommunications
9.6.1 Additive Process in the Telecommunications Segment to Grow at the Highest CAGR
9.7 Power & Energy
9.7.1 The Hybrid Type is Projected to Grow at the Highest CAGR in the Power & Energy Segment
9.8 Plastics & Polymers
9.8.1 Additive Process to Grow at the Highest CAGR in the Plastics & Polymers Segment
9.9 Gems & Jewelry
9.9.1 Non-Traditional Segment to Lead in the Gems & Jewelery Industry
9.10 Others
10 Geographic Analysis (Page No. - 84)
10.1 Introduction
10.2 North America
10.2.1 US
10.2.1.1 Increasing Use of Micromachining in Automobile Industry
10.2.2 Canada
10.2.2.1 Promising Opportunities for Micromachining in Automotive Industry
10.2.3 Mexico
10.2.3.1 Consistent Growth in Automotive Industry to Boost Micromachining Market
10.3 Europe
10.3.1 UK
10.3.1.1 Presence of Prominent Automotive and Aerospace Companies Increases the Adoption of Micromachining in UK
10.3.2 France
10.3.2.1 Strong Aerospace Industry Boosts the Market for Micromachining in France
10.3.3 Germany
10.3.3.1 Significant Growth is Expected in Micromachining Market Due to Presence of Strong Automotive Industry
10.3.4 Rest of Europe
10.4 Asia Pacific (APAC)
10.4.1 China
10.4.1.1 Demand for Lasers is Rising Due to Increasing Manufacturing Activities in Automobile Industry
10.4.2 Japan
10.4.2.1 Rapid Industrialization and Modernization Makes Japan A Prominent Player in the Asia Pacific Region
10.4.3 South Korea
10.4.3.1 South Korea is One of the Most Industrialized Nations in Asia.
10.4.4 India
10.4.4.1 India is One of the Fastest-Growing Economies in the Asia Pacific.
10.4.5 Rest of Asia Pacific
10.5 Rest of the World (RoW)
10.5.1 Middle East & Africa
10.5.2 South America
11 Competitive Landscape (Page No. - 98)
11.1 Overview
11.2 Ranking Analysis of Players in the Micromachining Market
11.3 Competitive Leadership Mapping, 2018
11.3.1 Visionary Leaders
11.3.2 Dynamic Differentiators
11.3.3 Innovators
11.3.4 Emerging Companies
11.4 Competitive Scenario
11.4.1 Product Launches
11.4.2 Expansions
11.4.3 Partnerships
12 Company Profiles (Page No. - 102)
(Business Overview, Products Offered, Recent Developments, SWOT Analysis, and MnM View)*
12.1 Key Players
12.1.1 Coherent
12.1.2 Georg Fischer
12.1.3 Makino
12.1.4 Lumentum
12.1.5 Mitsubishi
12.1.6 DATRON
12.1.7 Han’s Laser
12.1.8 Electro Scientific Industries
12.1.9 IPG Photonics
12.1.10 Heraeus
12.2 Right to Win
12.3 Other Key Players
12.3.1 Omax
12.3.2 3D Micromac
12.3.3 Lasea
12.3.4 Posalux
12.3.5 Scanlab
12.3.6 Tornos
12.3.7 Swisstec 3D
12.3.8 Kugler
12.3.9 GFH
*Details on Business Overview, Products Offered, Recent Developments, SWOT Analysis, and MnM View Might Not Be Captured in Case of Unlisted Companies.
13 Appendix (Page No. - 125)
13.1 Insights of Industry Experts
13.2 Discussion Guide
13.3 Knowledge Store: Marketsandmarkets’ Subscription Portal
13.4 Available Customizations
13.5 Related Reports
13.6 Author Details
List of Tables (101 Tables)
Table 1 Micromachining Market, By Type, 2017–2025 (USD Million)
Table 2 Micromachining Market for the Traditional Type, By Process, 2017–2025 (USD Million)
Table 3 Micromachining Market for the Traditional Type, By Axis, 2017–2025 (USD Million)
Table 4 Micromachining Market for the Traditional Type, By Industry, 2017–2025 (USD Million)
Table 5 Micromachining Market for the Traditional Type, By Geography, 2017–2025 (USD Million)
Table 6 Micromachining Market for the Non-Traditional Type, By Process, 2017–2025 (USD Million)
Table 7 Micromachining Market for the Non-Traditional Type, By Axis, 2017–2025 (USD Million)
Table 8 Micromachining Market for the Non-Traditional Type, By Industry, 2017–2025 (USD Million)
Table 9 Micromachining Market for the Non-Traditional Type, By Geography, 2017–2025 (USD Million)
Table 10 Market for the Hybrid Type, By Process, 2017–2025 (USD Million)
Table 11 Market for the Hybrid Type, By Axis, 2017–2025 (USD Million)
Table 12 Market for the Hybrid Type, By Industry, 2017–2025 (USD Thousand)
Table 13 Market for the Hybrid Type, By Geography, 2017–2025 (USD Million)
Table 14 Market, By Process, 2017–2025 (USD Million)
Table 15 Market for the Additive Process, By Type, 2017–2025 (USD Million)
Table 16 Market for the Additive Process, By Axis, 2017–2025 (USD Million)
Table 17 Market for the Additive Process, By Industry, 2017–2025 (USD Million)
Table 18 Market for the Additive Process, By Geography, 2017–2025 (USD Million)
Table 19 Market for the Subtractive Process, By Type, 2017–2025 (USD Million)
Table 20 Market for the Subtractive Process, By Axis, 2017–2025 (USD Million)
Table 21 Market for the Subtractive Process, By Industry, 2017–2025 (USD Million)
Table 22 Market for the Subtractive Process, By Geography, 2017–2025 (USD Million)
Table 23 Market for Other Processes, By Type, 2017–2025 (USD Million)
Table 24 Market for Other Processes, By Axis, 2017–2025 (USD Million)
Table 25 Market for Other Processes, By Industry, 2017–2025 (USD Million)
Table 26 Market for Other Processes, By Geography, 2017–2025 (USD Million)
Table 27 Market, By Axis, 2017–2025 (USD Million)
Table 28 Market for 3 Axes, By Process, 2017–2025 (USD Million)
Table 29 Market for 3 Axes, By Type, 2017–2025 (USD Million)
Table 30 Market for 3 Axes, By Industry, 2017–2025 (USD Million)
Table 31 Market for 3 Axes, By Geography, 2017–2025 (USD Million)
Table 32 Market for 4 Axes, By Process, 2017–2025 (USD Million)
Table 33 Market for 4 Axes, By Type, 2017–2025 (USD Million)
Table 34 Market for 4 Axes, By Industry, 2017–2025 (USD Million)
Table 35 Market for 4 Axes, By Geography, 2017–2025 (USD Million)
Table 36 Market for 5 Axes, By Process, 2017–2025 (USD Million)
Table 37 Market for 5 Axes, By Type, 2017–2025 (USD Million)
Table 38 Market for 5 Axes, By Industry, 2017–2025 (USD Million)
Table 39 Market for 5 Axes, By Geography, 2017–2025 (USD Million)
Table 40 Market for Other Axes, By Process, 2017–2025 (USD Million)
Table 41 Market for Other Axes, By Type, 2017–2025 (USD Million)
Table 42 Market for Other Axes, By Industry, 2017–2025 (USD Thousand)
Table 43 Market for Other Axes, By Geography, 2017–2025 (USD Million)
Table 44 Market, By Industry, 2017–2025 (USD Million)
Table 45 Market for the Automotive Industry, By Process, 2017–2025 (USD Million)
Table 46 Market for the Automotive Industry, By Type, 2017–2025 (USD Million)
Table 47 Market for the Automotive Industry, By Axis, 2017–2025 (USD Million)
Table 48 Market for the Automotive Industry, By Geography, 2017–2025 (USD Million)
Table 49 Market for the Semiconductors & Electronics Industry, By Process, 2017–2025 (USD Million)
Table 50 Market for the Semiconductors & Electronics Industry, By Type, 2017–2025 (USD Million)
Table 51 Market for the Semiconductors & Electronics Industry, By Axis, 2017–2025 (USD Million)
Table 52 Market for the Semiconductors & Electronics Industry, By Geography, 2017–2025 (USD Million)
Table 53 Market for the Aerospace & Defense Industry, By Process, 2017–2025 (USD Million)
Table 54 Market for the Aerospace & Defense Industry, By Type, 2017–2025 (USD Million)
Table 55 Market for the Aerospace & Defense Industry, By Axis, 2017–2025 (USD Million)
Table 56 Market for the Aerospace & Defense Industry, By Geography, 2017–2025 (USD Million)
Table 57 Market for the Medical & Aesthetics Industry, By Process, 2017–2025 (USD Million)
Table 58 Market for the Medical & Aesthetics Industry, By Type, 2017–2025 (USD Million)
Table 59 Market for the Medical & Aesthetics Industry, By Axis, 2017–2025 (USD Million)
Table 60 Market for the Medical & Aesthetics Industry, By Geography, 2017–2025 (USD Million)
Table 61 Market for the Telecommunications Industry, By Process, 2017–2025 (USD Million)
Table 62 Market for the Telecommunications Industry, By Type, 2017–2025 (USD Million)
Table 63 Market for the Telecommunications Industry, By Axis, 2017–2025 (USD Million)
Table 64 Market for the Telecommunications Industry, By Geography, 2017–2025 (USD Thousand)
Table 65 Market for the Power & Energy Industry, By Process, 2017–2025 (USD Thousand)
Table 66 Market for the Power & Energy Industry, By Type, 2017–2025 (USD Million)
Table 67 Market for the Power & Energy Industry, By Axis, 2017–2025 (USD Thousand)
Table 68 Market for the Power & Energy Industry, By Geography, 2017–2025 (USD Thousand)
Table 69 Market for the Plastics & Polymers Industry, By Process, 2017–2025 (USD Thousand)
Table 70 Market for the Plastics & Polymers Industry, By Type, 2017–2025 (USD Thousand)
Table 71 Market for the Plastics & Polymers Industry, By Axis, 2017–2025 (USD Thousand)
Table 72 Market for the Plastics & Polymers Industry, By Geography, 2017–2025 (USD Thousand)
Table 73 Market for the Gems & Jewelry Industry, By Process, 2017–2025 (USD Thousand)
Table 74 Market for the Gems & Jewelry Industry, By Type, 2017–2025 (USD Thousand)
Table 75 Market for the Gems & Jewelry Industry, By Axis, 2017–2025 (USD Thousand)
Table 76 Market for the Gems & Jewelry Industry, By Geography, 2017–2025 (USD Thousand)
Table 77 Market for Other Industries, By Process, 2017–2025 (USD Thousand)
Table 78 Market for Other Industries, By Type, 2017–2025 (USD Thousand)
Table 79 Market for Other Industries, By Axis, 2017–2025 (USD Thousand)
Table 80 Market for Other Industries, By Geography, 2017–2025 (USD Thousand)
Table 81 Market, By Geography, 2017–2025 (USD Million)
Table 82 Market for North America, By Process, 2017–2025 (USD Million)
Table 83 Market for North America, By Type, 2017–2025 (USD Million)
Table 84 Market for North America, By Axis, 2017–2025 (USD Million)
Table 85 Market for North America, By Industry, 2017–2025 (USD Million)
Table 86 Market for Europe, By Process, 2017–2025 (USD Million)
Table 87 Market for Europe, By Type, 2017–2025 (USD Million)
Table 88 Market for Europe, By Axis, 2017–2025 (USD Million)
Table 89 Market for Europe, By Industry, 2017–2025 (USD Million)
Table 90 Market for Asia Pacific, By Process, 2017–2025 (USD Million)
Table 91 Market for Asia Pacific, By Type, 2017–2025 (USD Million)
Table 92 Market for Asia Pacific, By Axis, 2017–2025 (USD Million)
Table 93 Market for Asia Pacific, By Industry, 2017–2025 (USD Million)
Table 94 Market for the Rest of the World, By Process, 2017–2025 (USD Thousand)
Table 95 Market for the Rest of the World, By Type, 2017–2025 (USD Million)
Table 96 Market for the Rest of the World, By Axis, 2017–2025 (USD Million)
Table 97 Market for the Rest of the World, By Industry, 2017–2025 (USD Thousand)
Table 98 Top Three Micromachining Market Players, 2018
Table 99 Product Launches, 2018–2019
Table 100 Expansions, 2018–2019
Table 101 Partnership, 2019
List of Figures (33 Figures)
Figure 1 Micromachining Market Segmentation
Figure 2 Market: Research Design
Figure 3 Market Size Estimation Methodology: Bottom-Up Approach
Figure 4 Market Size Estimation Methodology: Top-Down Approach
Figure 5 Market Breakdown and Data Triangulation
Figure 6 Assumptions for the Research Study
Figure 7 Market Segmentation
Figure 8 Global Micromachining Market, 2017 to 2025 (USD Million)
Figure 9 Market for Additive Micromachining Process to Grow at the Highest CAGR During the Forecast Period
Figure 10 Non-Traditional Type to Lead the Micromachining Market During the Forecast Period
Figure 11 5 Axes Micromachining System Projected to Grow at the Highest CAGR During the Forecast Period
Figure 12 Automotive Industry to Lead the Market From 2020 to 2025
Figure 13 Asia Pacific to Grow at the Highest CAGR in the Market During the Forecast Period
Figure 14 Attractive Growth Opportunities for Players in the Market
Figure 15 Hybrid Micromachining to Grow at the Highest CAGR During the Forecast Period
Figure 16 Subtractive Micromachining to Lead the Market During the Forecast Period
Figure 17 3 Axes Micromachining to Lead the Market During the Forecast Period
Figure 18 Automotive Industry to Account for the Largest Share of the Market in 2025
Figure 19 Asia Pacific to Grow at the Highest CAGR in the Market During the Forecast Period
Figure 20 Micromachining Market Dynamics
Figure 21 Market, By Type
Figure 22 Market, By Process
Figure 23 Market, By Axis
Figure 24 Market, By Industry
Figure 25 North America: Micromachining Snapshot
Figure 26 Asia Pacific: Micromachining Market Snapshot
Figure 27 Market (Global) Competitive Leadership Mapping, 2018
Figure 28 Coherent: Company Snapshot
Figure 29 Georg Fischer: Company Snapshot
Figure 30 Makino: Company Snapshot
Figure 31 Lumentum: Company Snapshot
Figure 32 Mitsubishi: Company Snapshot
Figure 33 IPG Photonics: Company Snapshot
The study involved four major activities in estimating the current size of the global micromachining market. Exhaustive secondary research has been done to collect information on the market and the peer market. Validate these findings, assumptions, and sizing with industry experts across the value chain through primary research has been the next step. Both top-down and bottom-up approaches have been employed to estimate the total market size. After that, market breakdown and data triangulation procedures have been carried out to estimate the market size of segments and subsegments.
Secondary Research
In the secondary research process, various secondary sources, such as Factiva and Avention, have been referred to for identifying and collecting information for this study. These secondary sources included annual reports, press releases, and investor presentations of companies, white papers, certified publications, articles by recognized authors, trade directories, and databases.
Primary Research
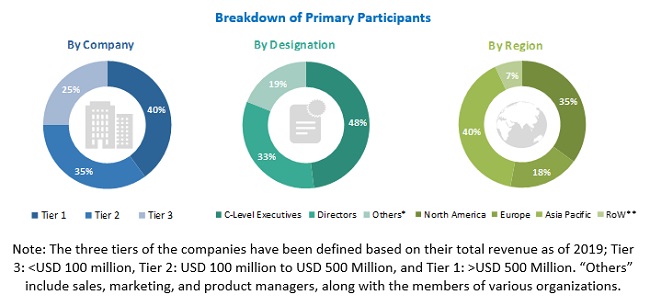
Extensive primary research has been conducted after gaining knowledge about the micromachining market scenario through secondary research. Several primary interviews have been conducted with market experts from both demand and supply sides across four major regions—North America, Europe, APAC, and RoW. Approximately 30% and 70% of primary interviews have been conducted with parties from the demand and supply sides, respectively. This primary data has been collected through questionnaires, e-mails, and telephonic interviews.
The following figure shows the breakdown of primaries based on company type, designation, and region.
To know about the assumptions considered for the study, download the pdf brochure
Market Size Estimation
Both top-down and bottom-up approaches have been used to estimate and validate the size of the global micromachining market and other dependent submarkets. Key players in the market have been identified through secondary research, and their ranking in the respective regions has been determined through primary and secondary research. This entire research methodology involves the study of financial reports of top players and interviews with industry experts (such as CEOs, VPs, directors, and marketing executives) for key insights (both quantitative and qualitative) on the micromachining market. All percentage share split and breakdowns have been determined using secondary sources and verified through primary sources. All the possible parameters that affect the markets covered in this research study have been accounted for, viewed in detail, verified through primary research, and analyzed to obtain the final quantitative and qualitative data. This data has been consolidated and supplemented with detailed inputs and analysis from MarketsandMarkets and presented in this report.
Data Triangulation
After arriving at the overall micromachining market size from the estimation process explained above, the total market has been split into several segments and subsegments. To complete the overall market engineering process and arrive at the exact statistics for all the segments, the market breakdown and data triangulation procedures have been employed, wherever applicable. The data has been triangulated by studying various factors and trends from both the demand and supply sides. The market has also been validated using both top-down and bottom-up approaches.
Study Objectives Are as Follows:
- To define, describe, and forecast the micromachining market, in terms of value, based on type, process, axis, and industry
- To forecast the market size, in terms of value, for segments concerning four main regions—North America, Europe, Asia Pacific (APAC), and Rest of the World (RoW)
- To provide detailed information regarding major factors, namely, drivers, restraints, opportunities, and challenges influencing the growth of the micromachining market
- To provide an overall view of the global micromachining market through illustrative segmentation, analyses, and market size estimations of crucial geographic segments
- To analyze the competitive intelligence of players based on company profiles and their strategies to sustain their position and grow in this market
- To strategically analyze micromarkets1 with respect to individual growth trends, prospects, and contribution to the total market
- To strategically profile key players and comprehensively analyze their market ranking and core competencies2, along with detailing the competitive landscape for market leaders
Available Customizations:
With the given market data, MarketsandMarkets offers customizations according to the company’s specific needs. The following customization options are available for the micromachining market report.
Company Information
- Detailed analysis and profiling of additional market players (up to 5)


Growth opportunities and latent adjacency in Micromachining Market