Medical Radiation Shielding Market by Products (Shields, Booths, Lead sheet, Doors, Windows, Curtain, X-Ray), Solution (Radiation Therapy, Cyclotron, PET, CT, MRI), End-user (Hospitals, Clinics, ASCs, Diagnostic Center), & Region - Global Forecast to 2028
Updated on : September 24, 2024
Overview of the Medical Radiation Shielding Market
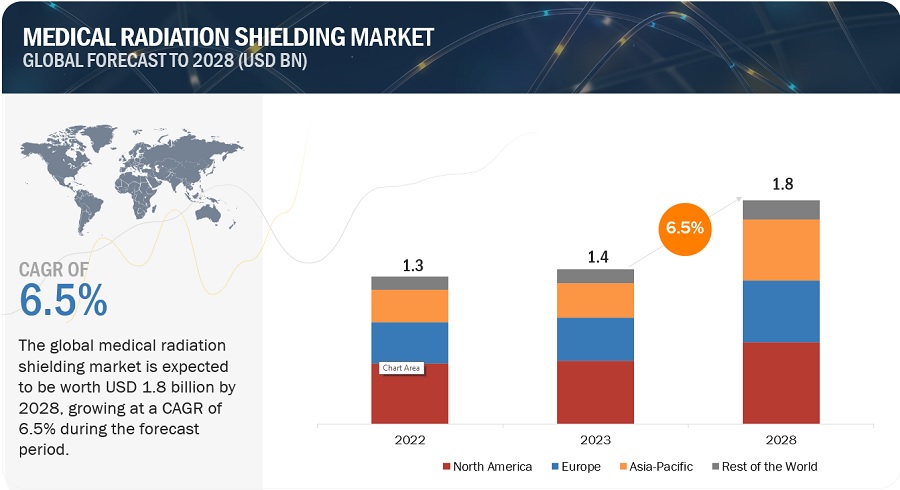
The global medical radiation shielding market, valued at US$1.3 billion in 2022, stood at US$1.4 billion in 2023 and is projected to advance at a resilient CAGR of 6.5% from 2023 to 2028, culminating in a forecasted valuation of US$1.8 billion by the end of the period. The comprehensive research encompasses an exhaustive examination of industry trends, meticulous pricing analysis, patent scrutiny, insights derived from conferences and webinars, identification of key stakeholders, and a nuanced understanding of market purchasing dynamics.
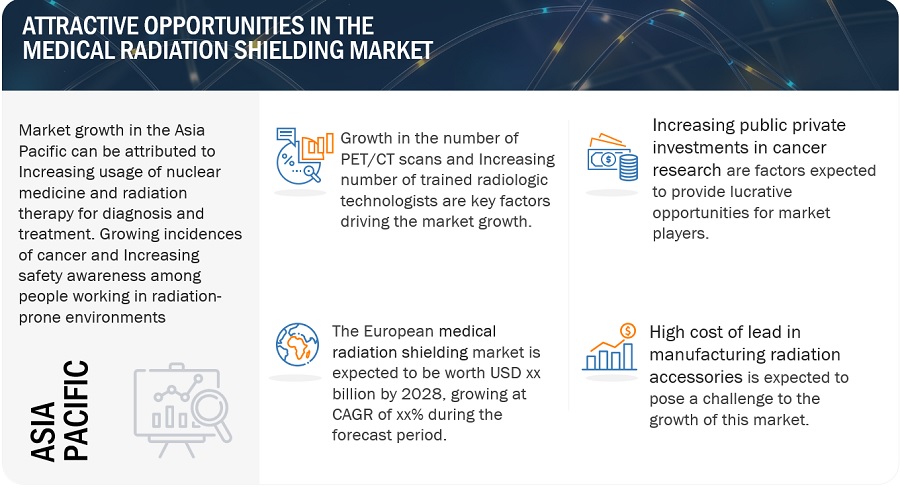
The Increasing usage of nuclear medicine and radiation therapy for diagnosis and treatment, Growing incidences of cancer, and Increasing safety awareness among people working in radiation-prone environments.
Medical Radiation Shielding Market Trends
To know about the assumptions considered for the study, Request for Free Sample Report
Medical Radiation Shielding Dynamics
DRIVER: Increasing usage of nuclear medicine and radiation therapy for diagnosis and treatment
Nuclear medicine & radiotherapy have a wide range of applications in cancer treatment; thus, the increasing prevalence of the disease will favor the radiation detection, monitoring, and safety market. According to GLOBOCAN, the number of cancer cases will rise to ~30 million by 2040 from 19.3 million in 2020. More than 60% of new cancer cases occur in Africa, Asia, and Central & South America; 70% of global cancer deaths also occur in these regions. According to the World Nuclear Association, more than 40 million nuclear medicine procedures are performed every year, and the demand for radioisotopes has increased by 5% annually (data as of May 2020). Nearly 10,000 hospitals across the globe use radioisotopes. In the US, more than 20 million nuclear medicine procedures are performed yearly. In April 2022, According to the World Nuclear Association, North America dominated the diagnostic radioisotopes market and accounted for 50% of the market share, and Europe accounted for 20%.
According to NHS England 2020, Radiography (X-ray) was the most common imaging test performed, with 22.9 million procedures, followed by diagnostic ultrasonography (9.51 million procedures), computerized axial tomography (5.15 million procedures), and MRI (3.46 million procedures). The increasing use of radiation therapy is expected to drive the adoption of medical radiation shielding products market.
RESTRAINT: Lack of adequate healthcare infrastructure
Radiotherapy devices are larger in size and require ample space for installation. One of the major factors restraining the adoption of medical radiation shielding systems is the lack of adequate healthcare infrastructure due to limited healthcare expenditure. In underdeveloped and developing countries very few healthcare institutions are able to utilize the medical radiation shielding solutions for cancer treatment. This, in turn, limits the number of radiotherapy procedures despite their high demand. According to the National Association for Proton Therapy, over 170,000 patients have received proton therapy worldwide, with over 75,000 in the US. By 2030, it is estimated that between 300,000 and 600,000 patients will have received proton therapy treatment. Although clinical experience with proton therapy is increasing now, only approximately 1% of all radiation therapy recipients receive proton therapy, and prospective randomized studies involving large sample populations remain very limited. Most high-income countries have at least one radiotherapy unit available for every 250,000 people. This, on average, would mean four radiotherapy machines per million population.
OPPORTUNITY: Rising healthcare expenditure across developing countries
The increasing healthcare expenditure in several emerging countries, such as China, India, Brazil, and Mexico, will improve access to quality healthcare in these countries. The rising incidence of cancer in these countries will drive the demand for medical radiation shielding products.
The increase in per-capita healthcare expenditure and the raising public demand for cost effective healthcare services can boost the demand of the healthcare products like oncology devices across the developing countries. The overall increase in healthcare expenditure can evidence this. For example, in the Economic Survey of 2022, India’s public expenditure on healthcare stood at 2.1% of GDP in 2021-22 against 1.8% in 2020-21 and 1.3% in 2019-20 (Source: IBEF). Whereas, in China, healthcare expenditure has increased by 12.6% to USD 930 billion as the government has raised spending in the healthcare sector. (Source: Healthcare Asia).
In addition, the developing medical tourism industry in emerging economies and competitive surgical procedure costs offered by prominent healthcare facilities are also increasing the adoption of healthcare technologies in these markets, including oncology. Healthcare treatments cost 65% to 80% less in Malaysia than in the US (Source: Medical Tourism Malaysia). Malaysia’s medical tourism has been growing between 16% and 17% year-on-year over the last five years, outperforming the global industry’s average growth of between 10% and 12%. India is another key hub for medical tourism. Due to the low-cost treatments available in India, the country ranks number 7 among the 20 wellness tourism markets, with over 56 million trips made to India for medical value tourism generating USD 16.3 billion in revenue. It also ranks number 3 in wellness-focused countries in the Asia Pacific.
The large target patient population, untapped opportunities, and low competition in developing economies such as China, India, and Brazil are expected to offer significant growth opportunities for players operating in the market.
CHALLENGE: High cost of lead in manufacturing radiation accessories
Lead is the most important raw material required to manufacture radiation safety accessories such as gloves, aprons, and eyewear. However, it is extensively used for other purposes, such as fire protection and manufacturing lead storage batteries.
The cost of implementing radiation shielding measures can be a significant restraint. Radiation shielding materials, construction modifications, and specialized equipment can be expensive, especially for smaller healthcare facilities or those with budget constraints. The upfront costs associated with radiation shielding products may deter some facilities from investing in comprehensive shielding solutions.
Due to its increasing use in other industries, its cost is projected to increase soon. This brings up the need to develop novel raw materials. As of now, in 2022, lead costs anywhere around 600-700 USD.
Hence, the increasing cost of lead will challenge the medical radiation shielding industry during the forecast period.
Medical Radiation Shielding Market Ecosystem
Prominent companies in this market include well-established manufacturers of market and offer a wide range of products. These companies have been operating in the market for several years and possess a diversified product portfolio, state-of-the-art technologies, and strong global sales and marketing networks. Prominent companies in this market include ESCO Technologies, Mirion Technology, and Nelco Worldwide.
In 2022, MRI Shielding Products segment to observe highest growth rate of the medical radiation shielding industry, by type.
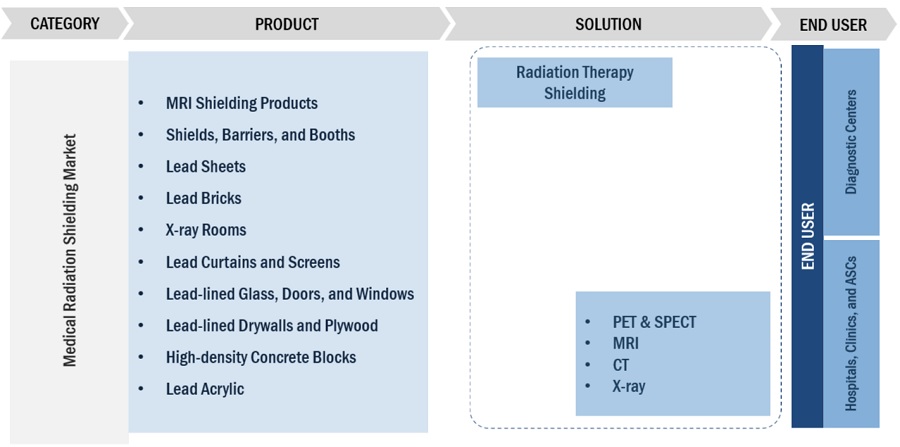
Based on the products, the medical radiation shielding market is categorized into MRI Shielding Products, Shields, Barriers, Booths, X-ray rooms, Lead Sheets, Lead Bricks, Lead Curtains, and Screens, Lead Lined Glass, Doors & Windows, Lead Lined Drywalls and Plywood, High Density Concrete Blocks and Lead Acrylic. MRI Shielding Products are expected to grow fastest due to the increasing number of diagnostic imaging centers and installation base of radiology equipment and an increasing number of trained radiologic technologists. For instance, In Europe, Germany has the highest number of MRI units. In 2021, the country had the third-highest number of MRI units per million inhabitants after Japan and the US (Source: OECD 2022). According to Statista 2022, there are 35 MRI units per million population as of 2020. A large number of diagnostic imaging centers, coupled with the rising volume of examinations and strong healthcare system in terms of infrastructure, hospital beds, and trained staff, are likely to support the growth of the radiation detection, monitoring, and safety market in Germany.
In 2022, Hospitals, Clinics, and Ambulatory Surgery Centers segment to dominate the medical radiation shielding industry, by the end user.
Based on end users, the medical radiation shielding market is segmented into Hospitals, Clinics, Ambulatory Surgery Centers, and Diagnostic centers. Hospitals, Clinics, and Ambulatory Surgery Centers dominate the market due to the increasing number of cancer populations, which will increase the demand for the rising number of hospitals and diagnostic centers. Therefore, Hospitals are the largest end-users owing to the rising number of cancer patients, an increasing number of internal radiation therapy procedures, and the growing adoption of nuclear medicine, radiotherapy, and diagnostics procedures.
To know about the assumptions considered for the study, download the pdf brochure
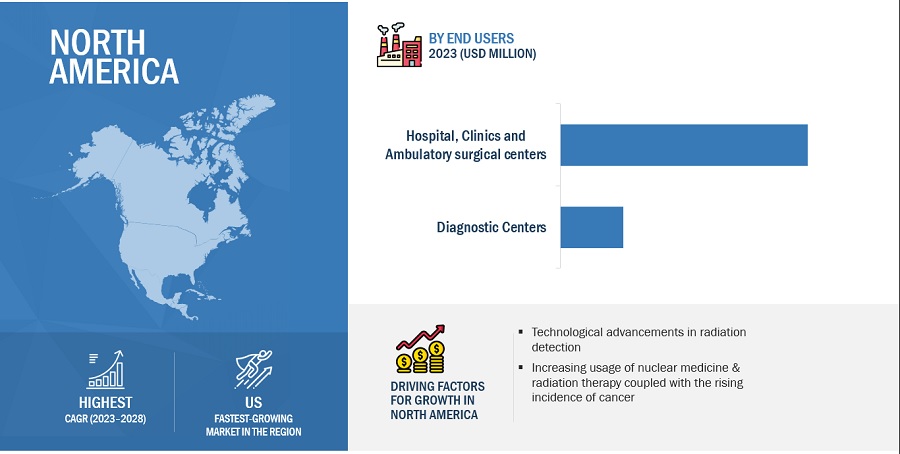
The global Medical Radiation Shielding market is segmented into North America, Europe, Asia Pacific, and Rest of the World. North America is expected to rise at the highest CAGR due to the rising incidence of cancer and the use of radiation therapy for diagnosis and treatment. For Instance, National expenditures associated with cancer have been steadily increasing in the US. According to a report published by ACS (in October 2020), cancer patients in the US paid USD 5.6 billion out-of-pocket for cancer treatments, including surgical procedures, radiation treatments, and chemotherapy drugs, in 2018. Approximately USD 183 billion was spent in the US on cancer-related healthcare in 2015, and this figure is projected to grow to USD 222.2 billion by 2025 and USD 246 billion by 2030.
The Medical Radiation Shielding market is dominated by players such ESCO Technologies Inc. (US), Mirion Technologies Inc. (US), and Nelco Worldwide (US).
Scope of the Medical Radiation Shielding Industry
|
Report Metric |
Details |
|
Market Revenue Size in 2023 |
$1.4 billion |
|
Projected Revenue Size by 2028 |
$1.8 billion |
|
Industry Growth Rate |
Poised to Grow at a CAGR of 6.5% |
|
Market Driver |
Increasing usage of nuclear medicine and radiation therapy for diagnosis and treatment |
|
Market Opportunity |
Rising healthcare expenditure across developing countries |
This research report categorizes the medical radiation shielding market to forecast revenue and analyze trends in each of the following submarkets:
|
By Region |
|
|
By Product |
|
|
By Solution |
|
|
By End User |
|
Recent Developments of Medical Radiation Shielding Industry
- In September 2022, ESCO Technologies partnered with IMRIS, Deerfield Imaging, on a state-of-the-art MRI facility at Boston Children’s Hospital located in Boston, Massachusetts. The newly opened Hale Family building will provide diagnostic and treatment capabilities using IMRIS’ unique on-demand intraoperative MRI (iMRI) during surgery.
- In January 2021, Mirion Technologies acquired Sun Nuclear Corporation to strengthen its position in the market.
- In September 2020, Mirion acquired Biodex Medical Systems, a leader in the medical industry that offers nuclear medicine instruments, medical imaging equipment, and rehabilitation systems.
Frequently Asked Questions (FAQ):
What is the projected market revenue value of the global medical radiation shielding market?
The global medical radiation shielding market boasts a total revenue value of $1.8 billion by 2028.
What is the estimated growth rate (CAGR) of the global medical radiation shielding market?
The global medical radiation shielding market has an estimated compound annual growth rate (CAGR) of 6.5% and a revenue size in the region of $1.4 billion in 2023.
To speak to our analyst for a discussion on the above findings, click Speak to Analyst


- 5.1 INTRODUCTION
-
5.2 MARKET DYNAMICSDRIVERS- Increasing use of nuclear medicine and radiation therapy for diagnosis and treatment- Growing incidence of cancer- Increasing safety awareness among people working in radiation-prone environments- Growth in number of PET/CT scans- Increasing number of trained radiologic technologistsRESTRAINTS- Lack of adequate healthcare infrastructure- Shortage of skilled oncologists/radiologistsOPPORTUNITIES- Rising healthcare expenditure across developing countries- Increasing public-private investments in cancer research- Technological advancements in radiation detectionCHALLENGES- High cost of lead in manufacturing radiation accessories
- 5.3 VALUE CHAIN ANALYSIS
- 5.4 SUPPLY CHAIN ANALYSIS
-
5.5 PORTER’S FIVE FORCES ANALYSISTHREAT OF NEW ENTRANTSTHREAT OF SUBSTITUTESBARGAINING POWER OF BUYERSBARGAINING POWER OF SUPPLIERSINTENSITY OF COMPETITIVE RIVALRY
-
5.6 KEY STAKEHOLDERS & BUYING CRITERIAKEY STAKEHOLDERS IN BUYING PROCESSBUYING CRITERIA
-
5.7 REGULATORY LANDSCAPENORTH AMERICAEUROPEASIA PACIFIC
- 5.8 TRADE ANALYSIS
-
5.9 ECOSYSTEM ANALYSIS
-
5.10 PATENT ANALYSIS
- 5.11 KEY CONFERENCES & EVENTS IN 2023–2024
-
5.12 PRICING ANALYSISAVERAGE SELLING PRICE OF KEY PRODUCTS
-
5.13 TRENDS/DISRUPTIONS IMPACTING CUSTOMERS’ BUSINESSES
- 5.14 TECHNOLOGY ANALYSIS
- 6.1 INTRODUCTION
-
6.2 MRI SHIELDING PRODUCTSINCREASING INSTALLATION BASE OF MRI SCANNERS WORLDWIDE TO BOOST MARKET
-
6.3 LEAD-LINED GLASS, DOORS, AND WINDOWSABILITY OF LEAD-LINED GLASS TO PROTECT PERSONNEL FROM UNNECESSARY RADIATION EXPOSURE TO PROPEL GROWTH
-
6.4 LEAD-LINED DRYWALLS & PLYWOODGROWING DEMAND FOR LEAD-LINED PLYWOOD FOR HEAVIER LEAD SHIELDING REQUIREMENTS TO BOOST MARKET
-
6.5 SHIELDS, BARRIERS, AND BOOTHSINCREASING NUMBER OF DIAGNOSTIC IMAGING CENTERS TO DRIVE GROWTH
-
6.6 LEAD SHEETSCORROSION RESISTANCE ASSOCIATED WITH LEAD SHEETS TO FUEL DEMAND
-
6.7 LEAD BRICKSRESISTANCE TO DAMAGE TO DRIVE ADOPTION OF LEAD BRICKS
-
6.8 HIGH-DENSITY CONCRETE BLOCKSSIGNIFICANT ATTENUATION PROVIDED BY HIGH-DENSITY CONCRETE BLOCKS TO BOOST DEMAND
-
6.9 X-RAY ROOMSDEVELOPMENT OF NEW MATERIALS AS ALTERNATIVES TO LEAD TO CREATE GROWTH OPPORTUNITIES
-
6.10 LEAD CURTAINS & SCREENSGREATER SHIELDING CAPABILITY OF THICK LEAD SCREENS TO FAVOR MARKET GROWTH
-
6.11 LEAD ACRYLICSUPERIOR VISUAL CLARITY AND HIGH LIGHT TRANSMISSION OF LEAD ACRYLIC TO FUEL ADOPTION
- 7.1 INTRODUCTION
-
7.2 RADIATION THERAPY SHIELDINGLINEAR ACCELERATORS- Growing adoption of linear accelerators to drive market growthMULTIMODALITY IMAGING- Recent advances in multimodality imaging to boost marketCYCLOTRONS- Ability of cyclotrons to produce high yields of short half-life, neutron-deficient radioisotopes to favor market growthBRACHYTHERAPY- Ability of brachytherapy to deliver low-dose radiation to drive marketPROTON THERAPY- Non-invasive and non-threatening nature of proton therapy to fuel adoption
-
7.3 DIAGNOSTIC SHIELDINGCT SCANNERS- Rising demand for CT systems from hospitals, clinics, and ASCs to drive marketX-RAY IMAGING- Consistent high quality of images provided by digital imaging to boost demandMRI- Wide use of MRI in hospitals for medical diagnosis and staging of diseases to boost growthNUCLEAR IMAGING- Recent advances in nuclear medicine to increase number of nuclear medicine procedures globally
- 8.1 INTRODUCTION
-
8.2 HOSPITALS, ASCS, AND CLINICSINCREASING NUMBER OF INTERNAL RADIATION THERAPY PROCEDURES TO BOOST MARKET GROWTH
-
8.3 DIAGNOSTIC CENTERSGROWING NUMBER OF DIAGNOSTIC CENTERS TO DRIVE GROWTH
- 9.1 INTRODUCTION
-
9.2 NORTH AMERICANORTH AMERICA: RECESSION IMPACTUS- US to dominate North American medical radiation shielding market during forecast periodCANADA- Increasing number of radiography procedures to support market growth in Canada
-
9.3 EUROPEEUROPE: RECESSION IMPACTGERMANY- Growing geriatric population and increasing radiography procedures in Germany to favor market growthFRANCE- Large number of CT procedures performed to fuel marketUK- Increasing government initiatives and support to aid marketREST OF EUROPE
-
9.4 ASIA PACIFICASIA PACIFIC: RECESSION IMPACTCHINA- Large patient pool and rising healthcare spending to aid marketJAPAN- Rising awareness about radiation exposure to drive marketINDIA- Favorable government policies and healthcare infrastructure to support marketREST OF ASIA PACIFIC
-
9.5 REST OF THE WORLD (ROW)REST OF THE WORLD (ROW): RECESSION IMPACT

- 10.1 OVERVIEW
- 10.2 MARKET RANKING
-
10.3 COMPANY EVALUATION QUADRANT FOR TOP PLAYERSSTARSEMERGING LEADERSPARTICIPANTSPERVASIVE PLAYERS
-
10.4 COMPANY EVALUATION QUADRANT FOR SMES/STARTUPSPROGRESSIVE COMPANIESSTARTING BLOCKSRESPONSIVE COMPANIESDYNAMIC COMPANIES
- 10.5 COMPETITIVE BENCHMARKING
- 10.6 COMPANY FOOTPRINT ANALYSIS
-
10.7 COMPETITIVE SCENARIODEALSOTHER DEVELOPMENTS
-
11.1 KEY PLAYERSETS-LINDGREN (AN ESCO TECHNOLOGIES COMPANY)- Business overview- Products offered- Recent developments- MnM viewBIODEX (A PART OF MIRION TECHNOLOGIES, INC.)- Business overview- Products offered- Recent developments- MnM viewNELCO WORLDWIDE- Business overview- Products offered- MnM viewGAVEN INDUSTRIES, INC.- Business overview- Products offeredRADIATION PROTECTION PRODUCTS, INC.- Business overview- Products offeredMARSHIELD (A DIVISION OF MARS METAL CO.)- Business overview- Products offeredRAY-BAR ENGINEERING CORP.- Business overview- Products offeredAMRAY MEDICAL- Business overview- Products offeredA&L SHIELDING- Business overview- Products offeredGLOBAL PARTNERS IN SHIELDING, INC.- Business overview- Products offeredVERITAS MEDICAL SOLUTIONS LLC- Business overview- Products offeredALIMED, INC.- Business overview- Products offeredPROTECH MEDICAL- Business overview- Products offeredGLOBE COMPOSITE SOLUTIONS LLC- Business overview- Products offeredULTRARAY- Business overview- Products offeredMARS METAL COMPANY- Business overview- Products offeredNUCLEAR LEAD CO.- Business overview- Products offeredNUCLEAR SHIELDS B.V.- Business overview- Products offered
-
11.2 OTHER PLAYERSSHIELDING INTERNATIONAL INC.BAR-RAY PRODUCTS, INC.XENA SHIELDBURLINGTON MEDICALSIMAD SRLEUROPEAN EMC PRODUCTS
- 12.1 DISCUSSION GUIDE
- 12.2 KNOWLEDGESTORE: MARKETSANDMARKETS’ SUBSCRIPTION PORTAL
- 12.3 CUSTOMIZATION OPTIONS
- 12.4 RELATED REPORTS
- 12.5 AUTHOR DETAILS
- TABLE 1 RISK ASSESSMENT
- TABLE 2 NUMBER OF NEW CANCER CASES, 2020–2040
- TABLE 3 INCREASING INCIDENCE OF CANCER, BY REGION, 2020 VS. 2030 VS. 2040 (MILLION)
- TABLE 4 CT SCANNERS INSTALLED, BY COUNTRY, 2019 VS. 2021 (PER MILLION INHABITANTS)
- TABLE 5 CT SCAN PROCEDURAL VOLUME, BY COUNTRY, 2019 VS. 2021 (PER 1,000 INHABITANTS)
- TABLE 6 METROPOLITAN AREAS IN US WITH HIGH EMPLOYMENT LEVELS AMONG RADIOLOGY TECHNOLOGISTS AND TECHNICIANS
- TABLE 7 INFLUENCE OF STAKEHOLDERS ON BUYING PROCESS FOR TOP END USERS (%)
- TABLE 8 KEY BUYING CRITERIA FOR HOSPITALS, CLINICS, AND ASCS AND DIAGNOSTIC CENTERS
- TABLE 9 IMPORT DATA FOR HS CODE 903010, BY COUNTRY, 2018–2022 (USD THOUSAND)
- TABLE 10 EXPORT DATA FOR HS CODE 903010, BY COUNTRY, 2018–2022 (USD THOUSAND)
- TABLE 11 ROLE IN ECOSYSTEM
- TABLE 12 LIST OF CONFERENCES & EVENTS
- TABLE 13 PRICE RANGE OF KEY PRODUCTS IN MEDICAL RADIATION SHIELDING MARKET (USD)
- TABLE 14 MEDICAL RADIATION SHIELDING MARKET, BY PRODUCT, 2021–2028 (USD MILLION)
- TABLE 15 MEDICAL RADIATION SHIELDING MARKET FOR MRI SHIELDING PRODUCTS, BY REGION, 2021–2028 (USD MILLION)
- TABLE 16 MEDICAL RADIATION SHIELDING MARKET FOR LEAD-LINED GLASS, DOORS, AND WINDOWS, BY REGION, 2021–2028 (USD MILLION)
- TABLE 17 MEDICAL RADIATION SHIELDING MARKET FOR LEAD-LINED DRYWALLS & PLYWOOD, BY REGION, 2021–2028 (USD MILLION)
- TABLE 18 MEDICAL RADIATION SHIELDING MARKET FOR SHIELDS, BARRIERS, AND BOOTHS, BY REGION, 2021–2028 (USD MILLION)
- TABLE 19 MEDICAL RADIATION SHIELDING MARKET FOR LEAD SHEETS, BY REGION, 2021–2028 (USD MILLION)
- TABLE 20 MEDICAL RADIATION SHIELDING MARKET FOR LEAD BRICKS, BY REGION, 2021–2028 (USD MILLION)
- TABLE 21 MEDICAL RADIATION SHIELDING MARKET FOR HIGH-DENSITY CONCRETE BLOCKS, BY REGION, 2021–2028 (USD MILLION)
- TABLE 22 MEDICAL RADIATION SHIELDING MARKET FOR X-RAY ROOMS, BY REGION, 2021–2028 (USD MILLION)
- TABLE 23 MEDICAL RADIATION SHIELDING MARKET FOR LEAD CURTAINS & SCREENS, BY REGION, 2021–2028 (USD MILLION)
- TABLE 24 MEDICAL RADIATION SHIELDING MARKET FOR LEAD ACRYLIC, BY REGION, 2021–2028 (USD MILLION)
- TABLE 25 MEDICAL RADIATION SHIELDING MARKET, BY SOLUTION, 2021–2028 (USD MILLION)
- TABLE 26 RADIATION THERAPY SHIELDING MARKET, BY REGION, 2021–2028 (USD MILLION)
- TABLE 27 RADIATION THERAPY SHIELDING MARKET, BY TYPE, 2021–2028 (USD MILLION)
- TABLE 28 MEDICAL RADIATION SHIELDING MARKET FOR LINEAR ACCELERATORS, BY REGION, 2021–2028 (USD MILLION)
- TABLE 29 MEDICAL RADIATION SHIELDING MARKET FOR MULTIMODALITY IMAGING, BY REGION, 2021–2028 (USD MILLION)
- TABLE 30 MEDICAL RADIATION SHIELDING MARKET FOR CYCLOTRONS, BY REGION, 2021–2028 (USD MILLION)
- TABLE 31 MEDICAL RADIATION SHIELDING MARKET FOR BRACHYTHERAPY, BY REGION, 2021–2028 (USD MILLION)
- TABLE 32 MEDICAL RADIATION SHIELDING MARKET FOR PROTON THERAPY, BY REGION, 2021–2028 (USD MILLION)
- TABLE 33 DIAGNOSTIC SHIELDING MARKET, BY REGION, 2021–2028 (USD MILLION)
- TABLE 34 DIAGNOSTIC SHIELDING MARKET, BY TYPE, 2021–2028 (USD MILLION)
- TABLE 35 MEDICAL RADIATION SHIELDING MARKET FOR CT SCANNERS, BY REGION, 2021–2028 (USD MILLION)
- TABLE 36 MEDICAL RADIATION SHIELDING MARKET FOR X-RAY IMAGING, BY REGION, 2021–2028 (USD MILLION)
- TABLE 37 MEDICAL RADIATION SHIELDING MARKET FOR MRI, BY REGION, 2021–2028 (USD MILLION)
- TABLE 38 MEDICAL RADIATION SHIELDING MARKET FOR NUCLEAR MEDICINE, BY REGION, 2021–2028 (USD MILLION)
- TABLE 39 MEDICAL RADIATION SHIELDING MARKET, BY END USER, 2021–2028 (USD MILLION)
- TABLE 40 MEDICAL RADIATION SHIELDING MARKET FOR HOSPITALS, ASCS, AND CLINICS, BY REGION, 2021–2028 (USD MILLION)
- TABLE 41 MEDICAL RADIATION SHIELDING MARKET FOR DIAGNOSTIC CENTERS, BY REGION, 2021–2028 (USD MILLION)
- TABLE 42 MEDICAL RADIATION SHIELDING MARKET, BY REGION, 2021–2028 (USD MILLION)
- TABLE 43 NORTH AMERICA: MEDICAL RADIATION SHIELDING MARKET, BY COUNTRY, 2021–2028 (USD MILLION)
- TABLE 44 NORTH AMERICA: MEDICAL RADIATION SHIELDING MARKET, BY PRODUCT, 2021–2028 (USD MILLION)
- TABLE 45 NORTH AMERICA: MEDICAL RADIATION SHIELDING MARKET, BY SOLUTION, 2021–2028 (USD MILLION)
- TABLE 46 NORTH AMERICA: RADIATION THERAPY SHIELDING MARKET, BY TYPE, 2021–2028 (USD MILLION)
- TABLE 47 NORTH AMERICA: DIAGNOSTIC SHIELDING MARKET, BY TYPE, 2021–2028 (USD MILLION)
- TABLE 48 NORTH AMERICA: MEDICAL RADIATION SHIELDING MARKET, BY END USER, 2021–2028 (USD MILLION)
- TABLE 49 US: MEDICAL RADIATION SHIELDING MARKET, BY PRODUCT, 2021–2028 (USD MILLION)
- TABLE 50 US: MEDICAL RADIATION SHIELDING MARKET, BY SOLUTION, 2021–2028 (USD MILLION)
- TABLE 51 US: RADIATION THERAPY SHIELDING MARKET, BY TYPE, 2021–2028 (USD MILLION)
- TABLE 52 US: DIAGNOSTIC SHIELDING MARKET, BY TYPE, 2021–2028 (USD MILLION)
- TABLE 53 US: MEDICAL RADIATION SHIELDING MARKET, BY END USER, 2021–2028 (USD MILLION)
- TABLE 54 CANADA: MEDICAL RADIATION SHIELDING MARKET, BY PRODUCT, 2021–2028 (USD MILLION)
- TABLE 55 CANADA: MEDICAL RADIATION SHIELDING MARKET, BY SOLUTION, 2021–2028 (USD MILLION)
- TABLE 56 CANADA: RADIATION THERAPY SHIELDING MARKET, BY TYPE, 2021–2028 (USD MILLION)
- TABLE 57 CANADA: DIAGNOSTIC SHIELDING MARKET, BY TYPE, 2021–2028 (USD MILLION)
- TABLE 58 CANADA: MEDICAL RADIATION SHIELDING MARKET, BY END USER, 2021–2028 (USD MILLION)
- TABLE 59 EUROPE: MEDICAL RADIATION SHIELDING MARKET, BY COUNTRY, 2021–2028 (USD MILLION)
- TABLE 60 EUROPE: MEDICAL RADIATION SHIELDING MARKET, BY PRODUCT, 2021–2028 (USD MILLION)
- TABLE 61 EUROPE: MEDICAL RADIATION SHIELDING MARKET, BY SOLUTION, 2021–2028 (USD MILLION)
- TABLE 62 EUROPE: RADIATION THERAPY SHIELDING MARKET, BY TYPE, 2021–2028 (USD MILLION)
- TABLE 63 EUROPE: DIAGNOSTIC SHIELDING MARKET, BY TYPE, 2021–2028 (USD MILLION)
- TABLE 64 EUROPE: MEDICAL RADIATION SHIELDING MARKET, BY END USER, 2021–2028 (USD MILLION)
- TABLE 65 GERMANY: MEDICAL RADIATION SHIELDING MARKET, BY PRODUCT, 2021–2028 (USD MILLION)
- TABLE 66 GERMANY: MEDICAL RADIATION SHIELDING MARKET, BY SOLUTION, 2021–2028 (USD MILLION)
- TABLE 67 GERMANY: RADIATION THERAPY SHIELDING MARKET, BY TYPE, 2021–2028 (USD MILLION)
- TABLE 68 GERMANY: DIAGNOSTIC SHIELDING MARKET, BY TYPE, 2021–2028 (USD MILLION)
- TABLE 69 GERMANY: MEDICAL RADIATION SHIELDING MARKET, BY END USER, 2021–2028 (USD MILLION)
- TABLE 70 FRANCE: MEDICAL RADIATION SHIELDING MARKET, BY PRODUCT, 2021–2028 (USD MILLION)
- TABLE 71 FRANCE: MEDICAL RADIATION SHIELDING MARKET, BY SOLUTION, 2021–2028 (USD MILLION)
- TABLE 72 FRANCE: RADIATION THERAPY SHIELDING MARKET, BY TYPE, 2021–2028 (USD MILLION)
- TABLE 73 FRANCE: DIAGNOSTIC SHIELDING MARKET, BY TYPE, 2021–2028 (USD MILLION)
- TABLE 74 FRANCE: MEDICAL RADIATION SHIELDING MARKET, BY END USER, 2021–2028 (USD MILLION)
- TABLE 75 UK: MEDICAL RADIATION SHIELDING MARKET, BY PRODUCT, 2021–2028 (USD MILLION)
- TABLE 76 UK: MEDICAL RADIATION SHIELDING MARKET, BY SOLUTION, 2021–2028 (USD MILLION)
- TABLE 77 UK: RADIATION THERAPY SHIELDING MARKET, BY TYPE, 2021–2028 (USD MILLION)
- TABLE 78 UK: DIAGNOSTIC SHIELDING MARKET, BY TYPE, 2021–2028 (USD MILLION)
- TABLE 79 UK: MEDICAL RADIATION SHIELDING MARKET, BY END USER, 2021–2028 (USD MILLION)
- TABLE 80 REST OF EUROPE: MEDICAL RADIATION SHIELDING MARKET, BY PRODUCT, 2021–2028 (USD MILLION)
- TABLE 81 REST OF EUROPE: MEDICAL RADIATION SHIELDING MARKET, BY SOLUTION, 2021–2028 (USD MILLION)
- TABLE 82 REST OF EUROPE: RADIATION THERAPY SHIELDING MARKET, BY TYPE, 2021–2028 (USD MILLION)
- TABLE 83 REST OF EUROPE: DIAGNOSTIC SHIELDING MARKET, BY TYPE, 2021–2028 (USD MILLION)
- TABLE 84 REST OF EUROPE: MEDICAL RADIATION SHIELDING MARKET, BY END USER, 2021–2028 (USD MILLION)
- TABLE 85 ASIA PACIFIC: MEDICAL RADIATION SHIELDING MARKET, BY COUNTRY, 2021–2028 (USD MILLION)
- TABLE 86 ASIA PACIFIC: MEDICAL RADIATION SHIELDING MARKET, BY PRODUCT, 2021–2028 (USD MILLION)
- TABLE 87 ASIA PACIFIC: MEDICAL RADIATION SHIELDING MARKET, BY SOLUTION, 2021–2028 (USD MILLION)
- TABLE 88 ASIA PACIFIC: RADIATION THERAPY SHIELDING MARKET, BY TYPE, 2021–2028 (USD MILLION)
- TABLE 89 ASIA PACIFIC: DIAGNOSTIC SHIELDING MARKET, BY TYPE, 2021–2028 (USD MILLION)
- TABLE 90 ASIA PACIFIC: MEDICAL RADIATION SHIELDING MARKET, BY END USER, 2021–2028 (USD MILLION)
- TABLE 91 CHINA: MEDICAL RADIATION SHIELDING MARKET, BY PRODUCT, 2021–2028 (USD MILLION)
- TABLE 92 CHINA: MEDICAL RADIATION SHIELDING MARKET, BY SOLUTION, 2021–2028 (USD MILLION)
- TABLE 93 CHINA: RADIATION THERAPY SHIELDING MARKET, BY TYPE, 2021–2028 (USD MILLION)
- TABLE 94 CHINA: DIAGNOSTIC SHIELDING MARKET, BY TYPE, 2021–2028 (USD MILLION)
- TABLE 95 CHINA: MEDICAL RADIATION SHIELDING MARKET, BY END USER, 2021–2028 (USD MILLION)
- TABLE 96 JAPAN: MEDICAL RADIATION SHIELDING MARKET, BY PRODUCT, 2021–2028 (USD MILLION)
- TABLE 97 JAPAN: MEDICAL RADIATION SHIELDING MARKET, BY SOLUTION, 2021–2028 (USD MILLION)
- TABLE 98 JAPAN: RADIATION THERAPY SHIELDING MARKET, BY TYPE, 2021–2028 (USD MILLION)
- TABLE 99 JAPAN: DIAGNOSTIC SHIELDING MARKET, BY TYPE, 2021–2028 (USD MILLION)
- TABLE 100 JAPAN: MEDICAL RADIATION SHIELDING MARKET, BY END USER, 2021–2028 (USD MILLION)
- TABLE 101 INDIA: MEDICAL RADIATION SHIELDING MARKET, BY PRODUCT, 2021–2028 (USD MILLION)
- TABLE 102 INDIA: MEDICAL RADIATION SHIELDING MARKET, BY SOLUTION, 2021–2028 (USD MILLION)
- TABLE 103 INDIA: RADIATION THERAPY SHIELDING MARKET, BY TYPE, 2021–2028 (USD MILLION)
- TABLE 104 INDIA: DIAGNOSTIC SHIELDING MARKET, BY TYPE, 2021–2028 (USD MILLION)
- TABLE 105 INDIA: MEDICAL RADIATION SHIELDING MARKET, BY END USER, 2021–2028 (USD MILLION)
- TABLE 106 INCIDENCE OF CANCER IN REST OF ASIA PACIFIC, 2020 VS. 2040
- TABLE 107 REST OF ASIA PACIFIC: MEDICAL RADIATION SHIELDING MARKET, BY PRODUCT, 2021–2028 (USD MILLION)
- TABLE 108 REST OF ASIA PACIFIC: MEDICAL RADIATION SHIELDING MARKET, BY SOLUTION, 2021–2028 (USD MILLION)
- TABLE 109 REST OF ASIA PACIFIC: RADIATION THERAPY SHIELDING MARKET, BY TYPE, 2021–2028 (USD MILLION)
- TABLE 110 REST OF ASIA PACIFIC: DIAGNOSTIC SHIELDING MARKET, BY TYPE, 2021–2028 (USD MILLION)
- TABLE 111 REST OF ASIA PACIFIC: MEDICAL RADIATION SHIELDING MARKET, BY END USER, 2021–2028 (USD MILLION)
- TABLE 112 REST OF THE WORLD: MEDICAL RADIATION SHIELDING MARKET, BY PRODUCT, 2021–2028 (USD MILLION)
- TABLE 113 REST OF THE WORLD: MEDICAL RADIATION SHIELDING MARKET, BY SOLUTION, 2021–2028 (USD MILLION)
- TABLE 114 REST OF THE WORLD: RADIATION THERAPY SHIELDING MARKET, BY TYPE, 2021–2028 (USD MILLION)
- TABLE 115 REST OF THE WORLD: DIAGNOSTIC SHIELDING MARKET, BY TYPE, 2021–2028 (USD MILLION)
- TABLE 116 REST OF THE WORLD: MEDICAL RADIATION SHIELDING MARKET, BY END USER, 2021–2028 (USD MILLION)
- TABLE 117 OVERVIEW OF STRATEGIES ADOPTED BY KEY PLAYERS IN MEDICAL RADIATION SHIELDING MARKET
- TABLE 118 TOP 3 COMPANIES IN MEDICAL RADIATION SHIELDING MARKET
- TABLE 119 MEDICAL RADIATION SHIELDING MARKET: DETAILED LIST OF KEY STARTUPS/SMES
- TABLE 120 FOOTPRINT ANALYSIS OF COMPANIES
- TABLE 121 REGIONAL FOOTPRINT ANALYSIS OF COMPANIES
- TABLE 122 PRODUCT FOOTPRINT ANALYSIS OF COMPANIES
- TABLE 123 KEY DEALS, JANUARY 2020–MAY 2023
- TABLE 124 OTHER KEY DEVELOPMENTS, JANUARY 2020–MAY 2023
- TABLE 125 ETS-LINDGREN (AN ESCO TECHNOLOGIES COMPANY): BUSINESS OVERVIEW
- TABLE 126 BIODEX (A PART OF MIRION TECHNOLOGIES, INC.): BUSINESS OVERVIEW
- TABLE 127 NELCO WORLDWIDE: BUSINESS OVERVIEW
- TABLE 128 GAVEN INDUSTRIES, INC.: BUSINESS OVERVIEW
- TABLE 129 RADIATION PROTECTION PRODUCTS, INC.: BUSINESS OVERVIEW
- TABLE 130 MARSHIELD (A DIVISION OF MARS METAL CO.): BUSINESS OVERVIEW
- TABLE 131 RAY-BAR ENGINEERING CORP.: BUSINESS OVERVIEW
- TABLE 132 AMRAY MEDICAL: BUSINESS OVERVIEW
- TABLE 133 A&L SHIELDING: BUSINESS OVERVIEW
- TABLE 134 GLOBAL PARTNERS IN SHIELDING, INC.: BUSINESS OVERVIEW
- TABLE 135 VERITAS MEDICAL SOLUTIONS, LLC: BUSINESS OVERVIEW
- TABLE 136 ALIMED, INC.: BUSINESS OVERVIEW
- TABLE 137 PROTECH MEDICAL: BUSINESS OVERVIEW
- TABLE 138 GLOBE COMPOSITE SOLUTIONS LLC: BUSINESS OVERVIEW
- TABLE 139 ULTRARAY: BUSINESS OVERVIEW
- TABLE 140 MARS METAL COMPANY: BUSINESS OVERVIEW
- TABLE 141 NUCLEAR LEAD CO.: BUSINESS OVERVIEW
- TABLE 142 NUCLEAR SHIELDS B.V.: BUSINESS OVERVIEW
- FIGURE 1 MEDICAL RADIATION SHIELDING MARKET SEGMENTATION
- FIGURE 2 RESEARCH DESIGN
- FIGURE 3 PRIMARY SOURCES
- FIGURE 4 BREAKDOWN OF PRIMARY INTERVIEWS: SUPPLY- AND DEMAND-SIDE PARTICIPANTS
- FIGURE 5 BREAKDOWN OF PRIMARY INTERVIEWS
- FIGURE 6 CAGR PROJECTIONS: SUPPLY-SIDE ANALYSIS
- FIGURE 7 TOP-DOWN APPROACH
- FIGURE 8 DATA TRIANGULATION METHODOLOGY
- FIGURE 9 MEDICAL RADIATION SHIELDING MARKET, BY PRODUCT, 2023 VS. 2028 (USD MILLION)
- FIGURE 10 MEDICAL RADIATION SHIELDING MARKET, BY SOLUTION, 2023 VS. 2028 (USD MILLION)
- FIGURE 11 MEDICAL RADIATION SHIELDING MARKET FOR RADIATION THERAPY SHIELDING, BY TYPE, 2023 VS. 2028 (USD MILLION)
- FIGURE 12 MEDICAL RADIATION SHIELDING MARKET FOR DIAGNOSTIC SHIELDING, BY TYPE, 2023 VS. 2028 (USD MILLION)
- FIGURE 13 MEDICAL RADIATION SHIELDING MARKET, BY END USER, 2023 VS. 2028 (USD MILLION)
- FIGURE 14 GEOGRAPHICAL SNAPSHOT OF MEDICAL RADIATION SHIELDING MARKET
- FIGURE 15 GROWING GLOBAL INCIDENCE OF CANCER TO DRIVE MARKET GROWTH
- FIGURE 16 DIAGNOSTIC SHIELDING HELD LARGEST SHARE OF NORTH AMERICAN MARKET IN 2022
- FIGURE 17 CHINA TO GROW AT HIGHEST CAGR DURING FORECAST PERIOD
- FIGURE 18 MEDICAL RADIATION SHIELDING MARKET: DRIVERS, RESTRAINTS, OPPORTUNITIES, AND CHALLENGES
- FIGURE 19 VALUE CHAIN ANALYSIS: MAJOR VALUE ADDED DURING MANUFACTURING AND ASSEMBLY PHASES
- FIGURE 20 DIRECT DISTRIBUTION—PREFERRED STRATEGY FOR PROMINENT COMPANIES
- FIGURE 21 INFLUENCE OF STAKEHOLDERS ON BUYING PROCESS FOR HOSPITALS, CLINICS, AND ASCS AND DIAGNOSTIC CENTERS
- FIGURE 22 KEY BUYING CRITERIA FOR HOSPITALS, CLINICS, AND ASCS AND DIAGNOSTIC CENTERS
- FIGURE 23 KEY PLAYERS OPERATING IN MEDICAL RADIATION SHIELDING MARKET
- FIGURE 24 NORTH AMERICA: MEDICAL RADIATION SHIELDING MARKET SNAPSHOT
- FIGURE 25 ASIA PACIFIC: MEDICAL RADIATION SHIELDING MARKET SNAPSHOT
- FIGURE 26 MEDICAL RADIATION SHIELDING MARKET: COMPANY EVALUATION QUADRANT FOR KEY PLAYERS, 2022
- FIGURE 27 MEDICAL RADIATION SHIELDING MARKET: COMPANY EVALUATION MATRIX FOR SMES/STARTUPS, 2022
- FIGURE 28 ETS-LINDGREN (AN ESCO TECHNOLOGIES COMPANY): COMPANY SNAPSHOT (2022)
- FIGURE 29 BIODEX (A PART OF MIRION TECHNOLOGIES, INC.): COMPANY SNAPSHOT (2022)
The objective of the study is to analyze the key market dynamics, such as drivers, opportunities, challenges, restraints, and key player strategies. To track company developments such as acquisitions, product launches, expansions, collaborations, agreements, and partnerships of the leading players, the competitive landscape of the Medical radiation shielding market to analyze market players on various parameters within the broad categories of business and product strategy. Top-down and bottom-up approaches were used to estimate the market size. To estimate the market size of segments and subsegments, the market breakdown and data triangulation were used.
The four steps involved in estimating the market size are
Collecting Secondary Data
The secondary research data collection process involves the usage of secondary sources, directories, databases (such as Bloomberg Businessweek, Factiva, and D&B), annual reports, investor presentations, and SEC filings of companies. Secondary research was used to identify and collect information useful for the extensive, technical, market-oriented, and commercial study of the Medical radiation shielding market. A database of the key industry leaders was also prepared using secondary research.
Collecting Primary Data
The primary research data was conducted after acquiring knowledge about the Medical radiation shielding market scenario through secondary research. A significant number of primary interviews were conducted with stakeholders from both the demand side (such as Hospitals and Clinics & ASCs) and supply side (such as included various industry experts, such as Directors, Chief X Officers (CXOs), Vice Presidents (VPs) from business development, marketing, and product development teams, product manufacturers, wholesalers, channel partners, and distributors) across major countries of North America, Europe, Asia Pacific, the Middle East & Africa, and Latin America. Approximately 45% of the primary interviews were conducted with stakeholders from the demand side, while those from the supply side accounted for the remaining 55%. Primary data for this report was collected through questionnaires, emails, and telephonic interviews.
A breakdown of the primary respondents is provided below:
Breakdown of Primary Participants
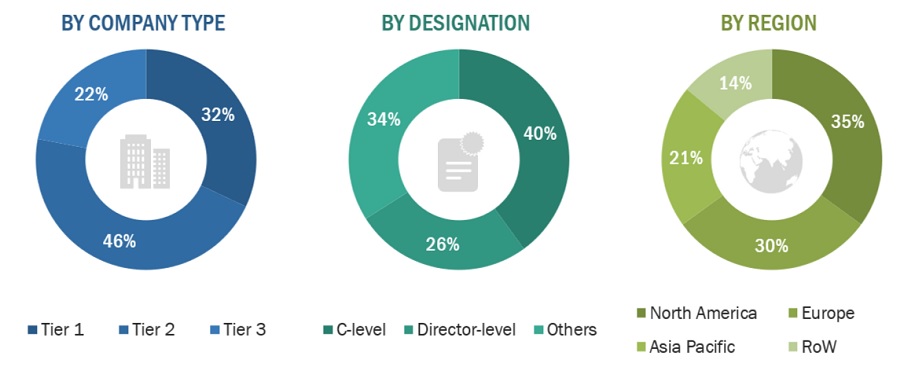
Note 1: *Others include sales managers, marketing managers, and product managers.
Note 2: Tiers are defined based on a company’s total revenue as of 2022: Tier 1=> USD 1 billion, Tier 2 = USD 500 million to USD 1 billion, and Tier 3=< USD 500 million.
To know about the assumptions considered for the study, download the pdf brochure
|
COMPANY NAME |
DESIGNATION |
|
ESCO Technologies Inc. (US) |
Regional Manager |
|
Mirion Technologies, Inc. (US) |
Senior Product Manager |
|
Radiation Protection Products, Inc. (US) |
Product Manager |
Market Size Estimation
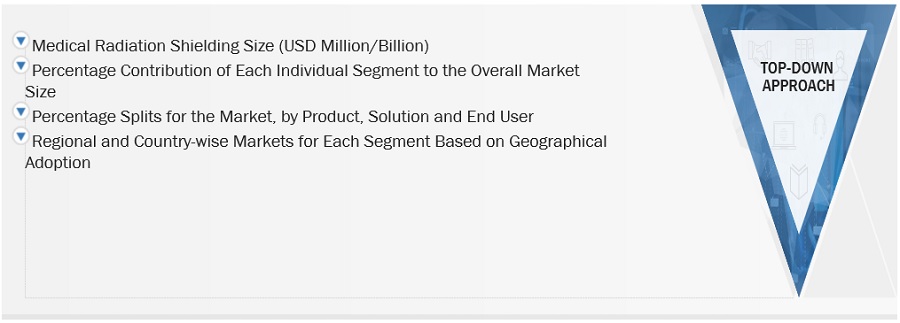
All major product manufacturers offering various Medical Radiation Shielding Markets were identified at the global/regional level. Revenue mapping was done for the major players and was extrapolated to arrive at the global market value of each type of segment. The market value market was also split into various segments and subsegments at the regional and country levels based on the following:
- Product mapping of various manufacturers for each solution of market at the regional and country-level
- Relative adoption pattern of each Medical radiation shielding market among key application segments at the regional and/or country-level
- Detailed primary research to gather qualitative and quantitative information related to segments and subsegments at the regional and/or country level.
- Detailed secondary research to gauge the prevailing market trends at the regional and/or country-level
Global Medical Radiation Shielding Market Size: Top-Down Approach
To know about the assumptions considered for the study, Request for Free Sample Report
Data Triangulation
After arriving at the overall market size—using the market size estimation processes—the market was split into several segments and subsegments. To complete the overall market engineering process and arrive at the exact statistics of each market segment and subsegment, data triangulation and market breakdown procedures were employed, wherever applicable. The data was triangulated by studying various factors and trends from both the demand and supply sides in the Medical Radiation Shielding industry.
Market Definition
Medical radiation shielding refers to the products and solutions used to protect people from harmful radiation. Radiation shielding works on the principle of attenuation; attenuation is the ability to reduce the radiation effect by blocking it through a barrier material. Medical radiation shielding plays a crucial role in radiation therapy and diagnostic imaging.
Key Stakeholders
- Senior Management
- End User
- Finance/Procurement Department
- R&D Department
Report Objectives
- To provide detailed information about the factors influencing the market growth (such as drivers, restraints, opportunities, and challenges)
- To define, describe, segment, and forecast the Medical radiation shielding market by product, application, end-user, and region
- To analyze market opportunities for stakeholders and provide details of the competitive landscape for key players
- To analyze micro markets with respect to individual growth trends, prospects, and contributions to the overall market
- To forecast the size of the market in five main regions along with their respective key countries, namely, North America, Europe, the Asia Pacific, and Rest of the world
- To profile key players in the market and comprehensively analyze their core competencies and market shares
- To track and analyze competitive developments, such as acquisitions; product launches; expansions; collaborations, agreements, & partnerships; and R&D activities of the leading players in the market.
- To benchmark players within the market using the Competitive Leadership Mapping framework, which analyzes market players on various parameters within the broad categories of business and product strategy
Available Customizations
MarketsandMarkets offers the following customizations for this market report:
- Additional country-level analysis of the Medical radiation shielding market
- Profiling of additional market players (up to 5) Product Analysis
- Product matrix, which provides a detailed comparison of the product portfolio of each company in the Medical radiation shielding Market


 Generating Response ...


Growth opportunities and latent adjacency in Medical Radiation Shielding Market