
Actuators Market Size, Share & Trends

Actuators Market Size, Share, Growth & Trends by Actuation (Electric, Hydraulic, Pneumatic), Type (Linear, Rotary), Application (Industrial Automation, Robotics, Vehicle Equipment), Vertical (Power Generation, Automotive, Aerospace & Defense) and Region - Global Forecast to 2030


ACTUATORS MARKET SIZE, SHARE & TRENDS
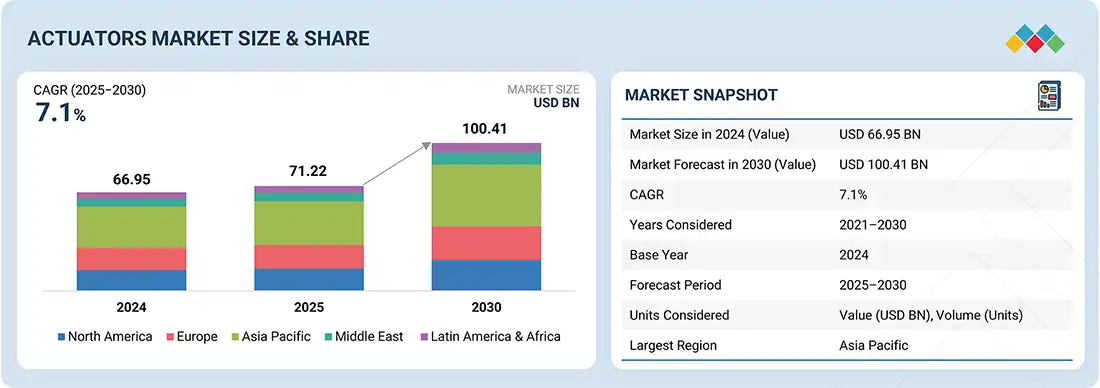
According to Marketsandmarkets, the global actuators market size was valued at USD 71.22 billion in 2025 and is projected to reach USD 100.41 billion by 2030, growing at a CAGR of 7.1% from 2025 to 2030. The increasing demand for automation and the need for efficient control systems are key factors driving the actuators industry. Technological advancements, such as the development of electric actuators and the integration of actuators with IoT and AI, further help enhance their capabilities and applications.
The Actuators Market size is witnessing significant expansion as automation and smart technologies continue to transform industrial operations worldwide. Increasing adoption of robotics, industrial automation systems, and smart manufacturing solutions has accelerated actuators market growth across sectors such as automotive, aerospace, healthcare, and energy. As companies invest in advanced motion control systems, the actuators market share is gradually expanding with strong participation from global manufacturers and technology providers. In addition, emerging actuators market trends such as miniaturized actuators, energy-efficient systems, and integration with IoT platforms are shaping the future of the Actuators industry, enabling higher precision and improved operational efficiency.
Furthermore, the rising demand for automation in manufacturing plants and the growing deployment of electric actuators in industrial equipment are fueling further Actuators Market growth. Many companies within the Actuators industry are focusing on innovation, developing intelligent actuators capable of real-time monitoring and predictive maintenance. These developments are contributing to the steady increase in Actuators Market size while also strengthening competitive positioning among key players. At the same time, evolving Actuators Market trends such as smart factories, Industry 4.0 adoption, and advanced robotics are expected to significantly boost Actuators Market share in the coming years, reinforcing the long-term growth potential of the global Actuators industry.
MARKET SNAPSHOT TABLE
| REPORT METRIC | DETAILS |
|---|---|
| Market Size in 2025 (Value) | USD 71.22 Billion |
| Market Forecast in 2030 (Value) | USD 100.41 Billion |
| Growth Rate | CAGR of 7.1% from 2025-2030 |
| Years Considered | 2021–2030 |
| Base Year | 2024 |
| Forecast Period | 2025–2030 |
| Units Considered | Value (USD Million/Billion), Volume (Thousand/Million Units) |
| Report Coverage | Revenue Forecast, Company Ranking, Competitive Landscape, Growth Factors, and Trends |
| Top Companies |
|
| Growth Drivers |
|
| Segments Covered |
|
| Regional Scope | North America, Europe, Asia Pacific, the Middle East, Latin America, and Africa |
Market Size & Forecast
ACTUATORS MARKET KEY TAKEAWAYS
-
BY ACTUATIONElectric actuation excels through precision, efficiency, low maintenance, and seamless digital integration, driving modern automation and sustainable systems.
-
BY APPLICATIONRobotics contributes to the actuator demand due to its widespread adoption, need for precision, and the rise in automation and smart manufacturing.
-
BY TYPELinear actuators are versatile, simple, and reliable, and are widely used in industrial automation, robotics, automotive, and consumer applications where precise linear motion is essential.
-
BY VERTICALThe automotive sector is rapidly shifting toward electrification, advanced driver-assistance systems (ADAS), and automation. All of these require high-precision, durable actuators, making automotive a consistent and high-volume application.
-
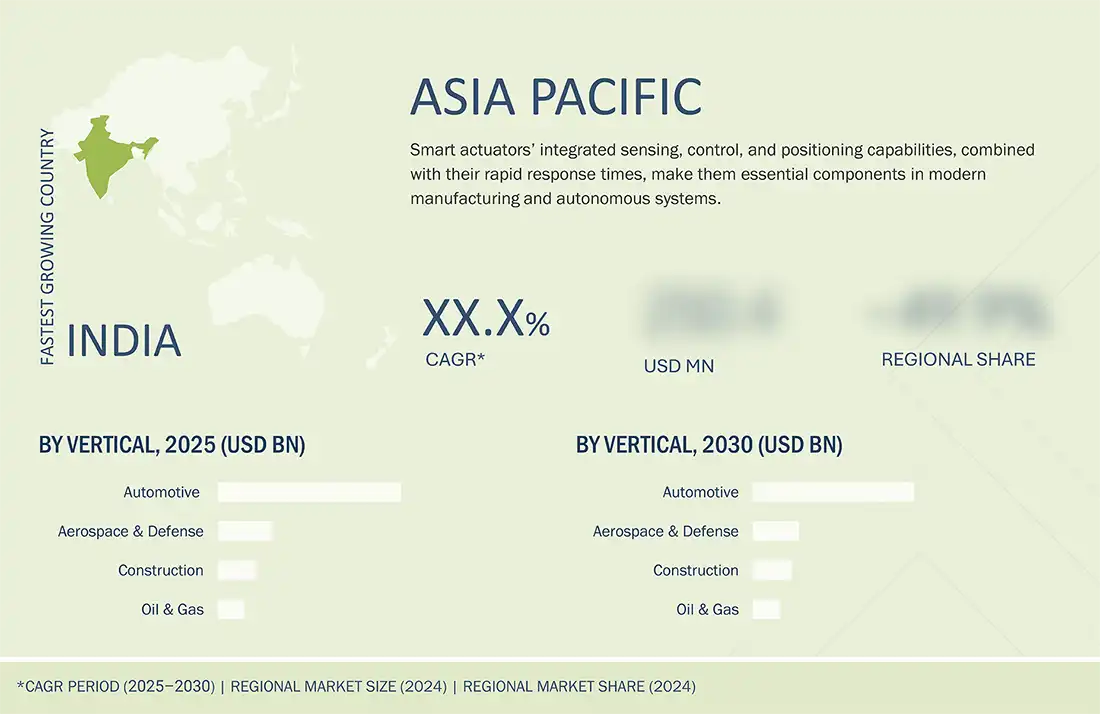
BY REGIONThe Asia Pacific region leads the actuators market due to extensive automation adoption, a strong automotive and electronics base, and supportive government initiatives.
-
COMPETITIVE LANDSCAPEMajor market players have adopted organic and inorganic strategies, including partnerships and investments. For instance, Emerson Electric Co., SMC Corporation, and Curtiss-Wright introduced actuators equipped with enhanced features and improved performance capabilities.
Actuators are integral components in various industries, converting energy into mechanical motion to drive systems and machinery. Their applications span manufacturing, automotive, aerospace, and healthcare, among other sectors. As industries continue to prioritize automation and efficiency, the actuators market growth is expected to experience sustained growth due to the ongoing technological innovations and expanding applications across various sectors.
Source: Secondary Research, Interviews with Experts, MarketsandMarkets Analysis
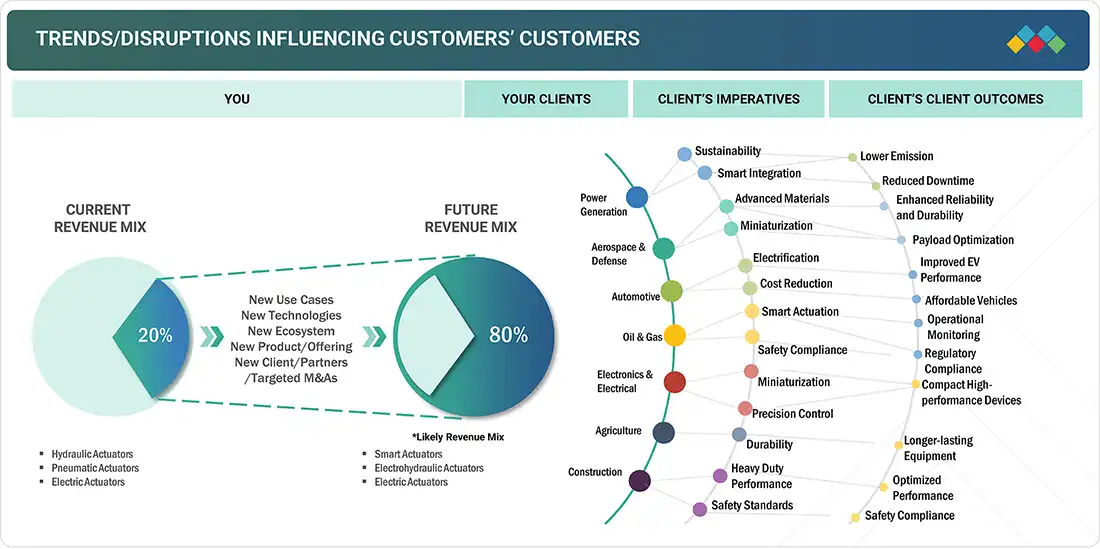
TRENDS & DISRUPTIONS IMPACTING CUSTOMERS' CUSTOMERS
It illustrates how companies’ revenue mix is expected to evolve over the next 4–5 years, moving from current offerings to new use cases, technologies, and markets. New market prospects for automotive, Industry 4.0, or concepts such as driverless vehicles are anticipated to lead to the growth of the actuators industry during the forecast period.
Source: Secondary Research, Interviews with Experts, MarketsandMarkets Analysis
ACTUATORS MARKET DYNAMICS
Level
-
Shift from hydraulic and pneumatic systems to electric actuation

-
Integration of sensors and embedded intelligence into actuators

Level
-
High switching costs in capital-intensive industries

Level
-
Harnessing industrial automation and AI

-
Capitalizing on retrofit demand and servitization of legacy systems

Level
-
Issues of leakage in pneumatic and hydraulic actuators

-
Ensuring cybersecurity and functional safety in smart actuators

Source: Secondary Research, Interviews with Experts, MarketsandMarkets Analysis
Driver: Integration of sensors and embedded intelligence into actuators
Technological advances are key drivers for the actuators market. Modern actuators are increasingly designed as smart systems, integrating sensors, controllers, and connectivity features that enable precise, real-time monitoring and control. These innovations allow actuators to respond more accurately to inputs and optimize energy usage, making them suitable for highly complex applications.
Restraint: High switching costs in capital-intensive industries
One of the primary restraints in the actuators market is the high switching cost associated with replacing existing systems in capital-intensive industries. The operational risks and potential costs of disruption often outweigh the perceived benefits of upgrading. Even modest changes in production infrastructure can lead to costly interruptions that these industries cannot afford.
Opportunity: Harnessing industrial automation and AI to unlock new value
The widespread adoption of industrial automation and artificial intelligence is creating significant opportunities for actuator manufacturers. Traditionally, actuators performed mechanical functions based on predetermined commands. However, as automation evolves into more complex and adaptive systems, actuators are becoming intelligent endpoints that interact with data networks and AI algorithms.
Challenge: Issues of leakage in pneumatic and hydraulic actuators
Pneumatic actuators use compressed air to create mechanical motion. They are easier to install but require multiple components, such as compressors, filters, dryers, and regulators, which make maintenance costly and introduce risks of air leaks and high noise. Hydraulic actuators use pressurized fluid to generate motion, offering higher force and precise control. However, they carry risks of fluid leakage, fire hazards, and system damage due to erosion.
Actuators Market Share: COMMERCIAL USE CASES ACROSS INDUSTRIES
| COMPANY | USE CASE DESCRIPTION | BENEFITS |
|---|---|---|
 |
Electric, pneumatic, and hydraulic actuators for valve and flow control in process industries | Precise control, improved reliability, and reduced emissions |
 |
Electric and pneumatic actuators for valve and damper automation in energy and manufacturing | High accuracy, energy efficiency, and predictive maintenance |
 |
Linear and rotary electromechanical actuators for motion control in automation and robotics | Compact design, high load capacity, and low maintenance |
 |
Pneumatic and electric actuators for packaging, assembly, and general automation | Fast response, versatility, and high reliability |
 |
Smart actuators integrated with control systems for industrial automation | Better monitoring, reduced downtime, and energy savings |
Logos and trademarks shown above are the property of their respective owners. Their use here is for informational and illustrative purposes only.
ACTUATORS MARKET GROWTH ECOSYSTEM
The actuators ecosystem involves identifying and analyzing interconnected relationships among various stakeholders, including manufacturers, distributors, and end users. Distributors establish contact between the manufacturing companies and end users to concentrate on the supply chain, increasing operational efficiency and profitability.
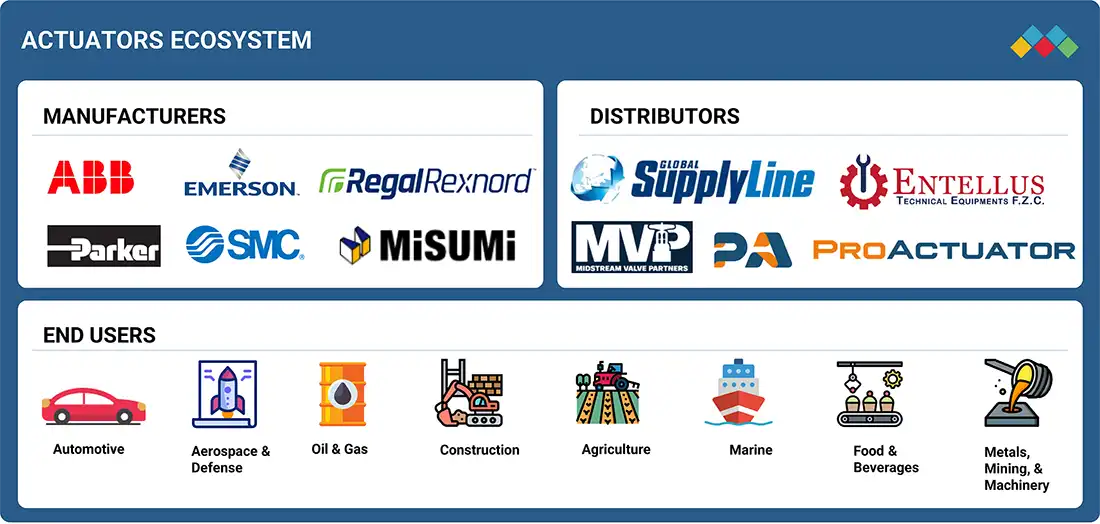
Logos and trademarks shown above are the property of their respective owners. Their use here is for informational and illustrative purposes only.
ACTUATORS MARKET SEGMENTS
Source: Secondary Research, Interviews with Experts, MarketsandMarkets Analysis
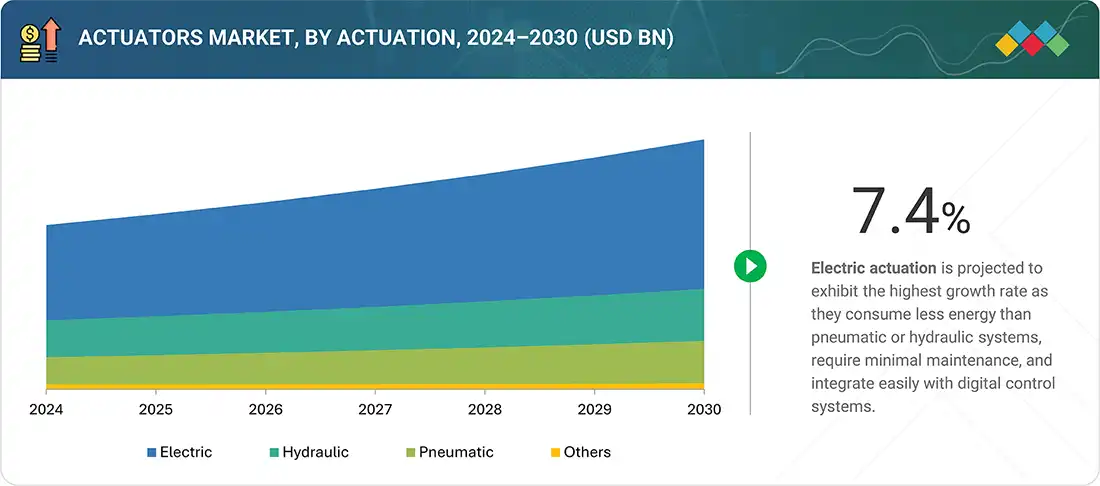
Actuators Market Trends, By Actuation
Electric actuation is expected to hold the largest market share in the actuation industry in 2025 due to its efficiency, precision, and low maintenance requirements. Its ability to provide accurate, automated control with energy efficiency and easy integration into digital systems makes it the preferred choice over pneumatic and hydraulic actuators, driving the market.
Actuators Market, By Application
The vehicle equipment application is expected to hold the largest market share in 2025 due to the growing demand for automation, safety, and efficiency in the automotive sector. Actuators are extensively used in vehicles for applications such as power steering, braking systems, and throttle control. The rise of electric and autonomous vehicles further boosts the need for precise and reliable actuation systems, making vehicle equipment the dominant segment in the actuator market.
Actuators Market, By Type
Linear actuators are expected to hold the larger market share in the actuator industry in 2025 due to their versatility and wide range of applications. They are used in the automotive, aerospace, healthcare, and industrial automation industries for tasks requiring precise linear motion, including valve operation, material handling, and medical devices.
Actuators Market, By Vertical
The automotive vertical is expected to hold the largest share in 2025 due to the high demand for automation, safety, and efficiency in vehicles. Actuators are widely used in applications such as power steering, braking systems, throttle control, and seat adjustments. The rapid growth of electric and autonomous vehicles further drives the adoption of precise and reliable actuation systems, making the automotive sector the dominant vertical in the actuator market.
ACTUATORS MARKET BY REGION
Asia Pacific to hold the largest share of the global actuators market share during the forecast period
Asia Pacific captured the largest share of the global actuators market in 2024 due to the widespread adoption of automation across multiple sectors. Increasing demand from the automotive, manufacturing, and aerospace industries is a major factor driving the market, as actuators are critical in enhancing operational efficiency and precision. The shift toward advanced technologies, including electric vehicles, robotics, and smart manufacturing systems, has further accelerated the need for reliable, high-performance actuators.
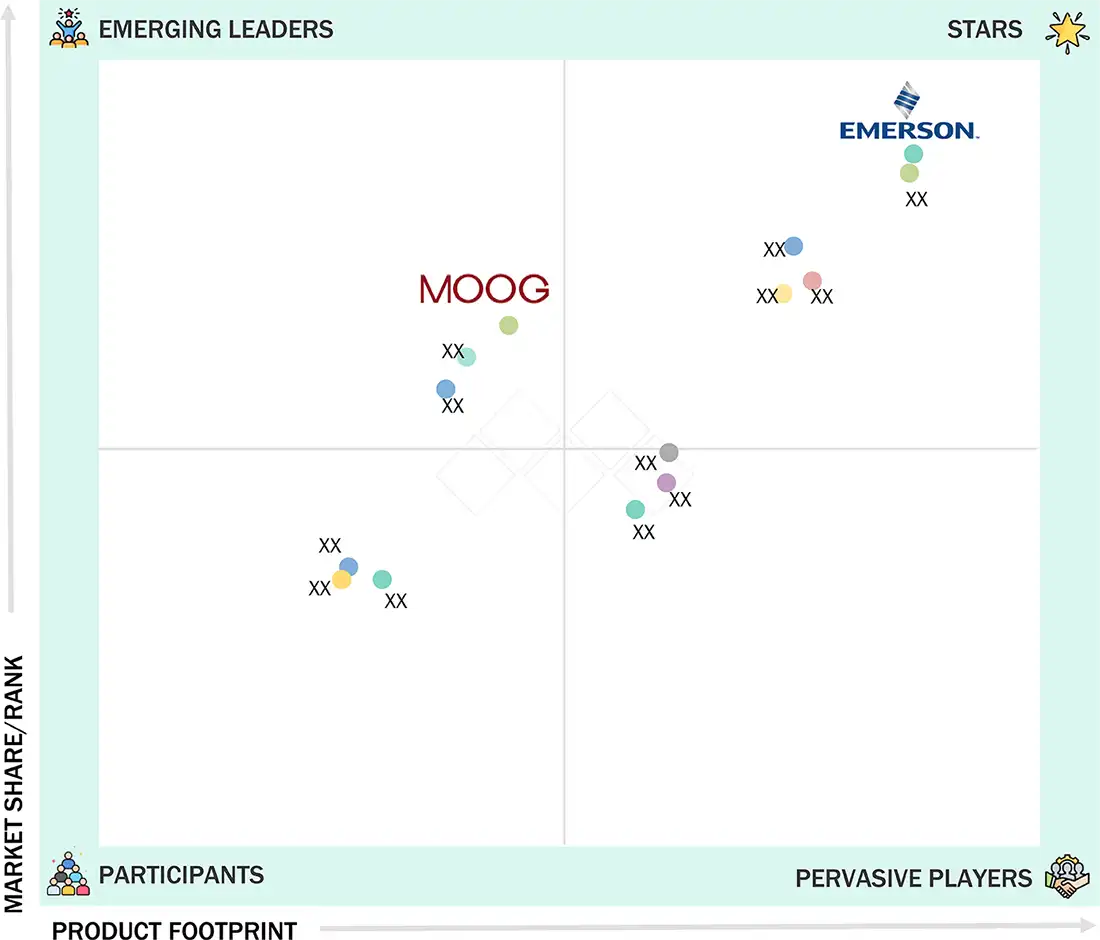
Actuators Market: COMPANY EVALUATION MATRIX
In the actuators market matrix, Emerson Electric Co. (Star) leads with a strong market presence and a wide product portfolio, driving large-scale adoption across industries such as automotive and aerospace & defense. Moog Inc. (Emerging Leader) is gaining traction with aircraft actuation systems.
Source: Secondary Research, Interviews with Experts, MarketsandMarkets Analysis
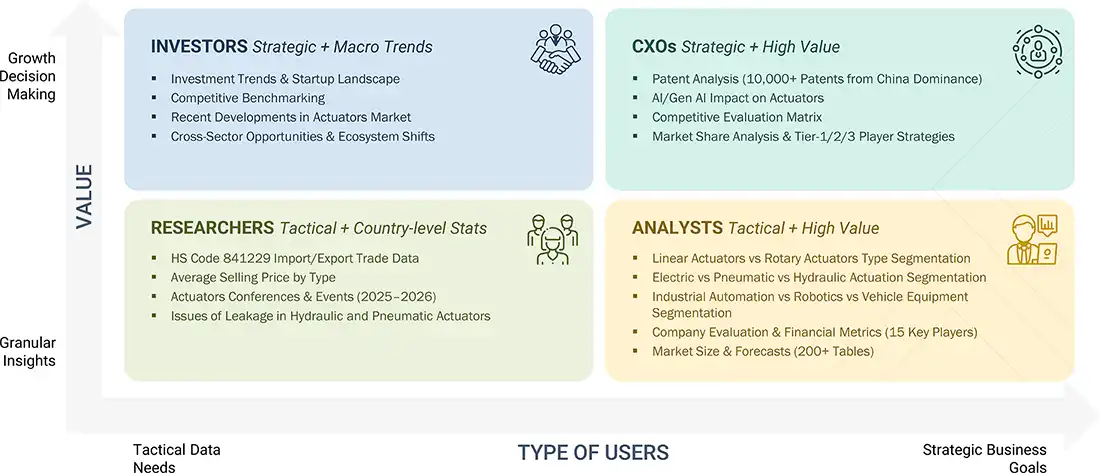
WHAT IS IN IT FOR YOU: Actuators Market REPORT CONTENT GUIDE
DELIVERED CUSTOMIZATIONS
We have successfully delivered the following deep-dive customizations:
| CLIENT REQUEST | CUSTOMIZATION DELIVERED | VALUE ADDS |
|---|---|---|
| Local Competitive Landscape | Profiles of key regional players, including market share, revenue, product portfolio, and strategic initiatives | • Facilitated competitive benchmarking and informed strategy development |
| Regional Market Entry Strategy | Country- or region-specific go-to-market strategies including barriers, regulations, and competitive landscape | • Minimized entry risk and accelerates market adoption |
| Local Risk & Opportunity Assessment | Identification of regional risks, barriers, and untapped opportunities by market or sector | • Enabled proactive risk mitigation and strategic investments |
| Technology Adoption by Region | Insights on local adoption of key actuator technologies (smart actuators, IoT, and automation) | • Guided R&D, product positioning, and investment decisions |
RECENT DEVELOPMENTS in ACTUATORS INDUSTRY
- June 2025 : Rotork and Rockwell Automation collaborated to feature the Rotork IQ3 Pro electric actuator with EtherNet/IP connectivity in the Rockwell Automation Technology Partner Program. This partnership makes it easier for engineers, system integrators, and end users to include Rotork’s actuator solutions in industrial automation projects.
- January 2025 : SMC Corporation introduced the Rotary Actuators CRB/CDRB Series, available in a double vane for sizes 10 to 40. The series features a compact body design equipped with a built-in angle adjustment unit and an auto switch unit, enhancing functionality and ease of use.
- November 2024 : Curtiss-Wright Corporation launched an expanded range of its popular Exlar electric actuators, introducing hygienic actuators made with FDA-approved materials and finishes. Designed for automation systems in the food & beverages, packaging, and pharmaceuticals industries, the GTF enables customers to achieve hygienic certifications, such as USDA, 3-A, BISSC, and EHEDG more cost-effectively than existing products in the market.
- April 2024 : Emerson Electric Co. launched the ASCO Series 148/149 safety valve and motorized actuator for industrial fuel oil burner recirculation and safety shutoff. Designed to prevent overpressure, leaks, and system failures, the solution offers a reliable, versatile configuration suitable for various combustion system applications.
Table of Contents
 Exclusive indicates content/data unique to MarketsandMarkets and not available with any competitors.
Methodology
The study involved major activities in estimating the current market size for the actuators market. Exhaustive secondary research was done to collect information on the industry. The next step was to validate these findings, assumptions, and sizing with industry experts across the value chain using primary research. Different approaches, such as top-down and bottom-up, were employed to estimate the total market size. After that, the market breakup and data triangulation procedures were used to estimate the market size of the segments and subsegments of the actuators market.
Secondary Research
The market size for companies offering actuators is arrived at by secondary data available through paid and unpaid sources, analyzing the product portfolios of the major companies in the ecosystem, and rating the companies by their performance and quality. Various sources were referred to in the secondary research process to identify and collect information for this study. The secondary sources include annual reports, press releases, investor presentations of companies, white papers, journals, certified publications, and articles from recognized authors, directories, and databases. In the secondary research process, various secondary sources were referred to to identify and collect information related to the study. Secondary sources included annual reports, press releases, and investor presentations of vendors, forums, certified publications, and whitepapers. The secondary research was used to obtain critical information on the industry’s value chain, the total pool of key players, market classification, and segmentation from the market and technology-oriented perspectives.
Primary Research
Extensive primary research has been conducted after understanding and analyzing the current scenario of the actuators market through secondary research. Several primary interviews have been conducted with key opinion leaders from the demand and supply sides across four main regions—North America, Europe, Asia Pacific, and RoW. Approximately 30% of the primary interviews were conducted with the demand-side respondents, while approximately 70% were conducted with the supply-side respondents. The primary data has been collected through questionnaires, emails, and telephone interviews.
After interacting with industry experts, brief sessions were conducted with highly experienced independent consultants to reinforce the findings from our primary research. Along with the in-house subject matter experts’ opinions, this led us to the findings described in the remainder of this report. The breakdown of primary respondents is as follows:

To know about the assumptions considered for the study, download the pdf brochure
Market Size Estimation
Both top-down and bottom-up approaches were used to estimate and validate the total size of the actuators market. These methods were also used extensively to estimate the size of various subsegments in the market. The research methodology used to estimate the market size includes the following:
Actuators Market : Top-Down and Bottom-Up Approach

Data Triangulation
The market was split into several segments and subsegments after arriving at the overall market size using the market size estimation processes as explained above. The data triangulation and market breakdown procedures were employed, wherever applicable, to complete the overall market engineering process and arrive at the exact statistics of each market segment and subsegment. The data was triangulated by studying various factors and trends from the demand and supply sides.
Market Definition
Actuators are devices that convert energy into motion and are used in moving or controlling mechanisms and systems. They are operated by an external source of energy, typically electric current, hydraulic fluid pressure, or pneumatic pressure, which is then converted to motion. Depending on the application area, they are available in various types and sizes. Actuators are used in manufacturing or industrial applications and devices such as valves, motors, switches, industrial fans, blowers, pumps, machine tools, household appliances, power tools, and disk drives.
Key Stakeholders
- Actuator Manufacturers
- Actuator Wholesalers, Retailers, and Distributors
- System Integrators
- Research Bodies
- Technology Support Providers
- Subcomponent Manufacturers
- Raw Material Suppliers
Report Objectives
- To describe and forecast the size of the actuators market, by type, actuation, application, and vertical, in terms of value
- To forecast the size of various segments of the actuators market across North America, Europe, Asia Pacific, the Middle East, and the Rest of the World (RoW), in terms of value
- To forecast the market size for aerospace, automotive, and marine end users in terms of volume
- To identify and analyze key drivers, restraints, opportunities, and challenges influencing the growth of the actuators market
- To provide ecosystem analysis, case study analysis, patent analysis, technology analysis, pricing analysis, Porter’s five forces analysis, key stakeholders and buying criteria, investment and funding scenario, trade analysis, trends/disruptions impacting customer business, the impact of AI/Gen AI and 2025 US tariff, key conferences and events, regulatory bodies, government agencies, and regulations pertaining to the market under study
- To analyze micromarkets with respect to their growth trends, prospects, and contribution to the overall market
- To provide a detailed competitive landscape of the market, along with the market share analysis of leading players
- To provide a comprehensive analysis of business and corporate strategies adopted by key players to strengthen their positions in the actuators market
- To provide the macroeconomic outlook for all regions covered in the report
- To strategically profile key players in the market and comprehensively analyze their core competencies
- To study the complete value chain of the actuators market
- To analyze opportunities for stakeholders by identifying high-growth segments of the actuators market
- To analyze competitive developments, such as product launches, acquisitions, partnerships, and expansions, in the global actuators market
Customization Options:
With the given market data, MarketsandMarkets offers customizations according to the specific requirements of companies. The following customization options are available for the report:
- Detailed analysis and profiling of additional market players based on various blocks of the supply chain
Key Questions Addressed by the Report
What is the current size of the global actuators market?
The global actuators market is estimated to be USD 71.22 billion in 2025. The market covers electric, hydraulic, and pneumatic actuators used across industrial automation, robotics, automotive, aerospace, energy, and other industries. (MarketsandMarkets)
What will be the projected size of the actuators market by 2030?
The actuators market is projected to reach USD 100.41 billion by 2030 due to increasing automation, electrification, and adoption of intelligent motion-control systems. (MarketsandMarkets)
What is the CAGR of the actuators market?
The global actuators market is expected to grow at a CAGR of 7.1% from 2025 to 2030. (MarketsandMarkets)
What are the major growth drivers of the actuators industry?
Key growth drivers include rising demand for industrial automation, robotics adoption, smart manufacturing, electric vehicle development, integration of IoT-enabled control systems, and demand for energy-efficient motion solutions. (MarketsandMarkets)
What are the major trends shaping the actuators market?
Major trends include smart actuators with sensors and connectivity, AI-enabled predictive maintenance, transition from hydraulic/pneumatic systems to electric actuators, miniaturized actuators, and Industry 4.0 automation solutions. (MarketsandMarkets)
Which industries and applications are driving actuator adoption?
Actuators are widely used in automotive, aerospace & defense, industrial automation, robotics, power generation, healthcare, energy, and manufacturing industries. Major applications include vehicle equipment, industrial automation systems, robotics, and control systems. (MarketsandMarkets)
Which companies are major players in the actuators market?
Key companies operating in the actuators market include Emerson Electric Co., Parker Hannifin Corp, ABB, Rockwell Automation, SMC Corporation, Bosch Rexroth, Flowserve, and Curtiss-Wright. (MarketsandMarkets)
Which actuator type and technology segment dominates the market?
The electric actuation segment held the largest share in 2024 due to advantages such as precision, efficiency, lower maintenance requirements, and compatibility with automation and digital control systems. (MarketsandMarkets)
Which region leads the global actuators market?
Asia Pacific is expected to lead the actuators market during 2025–2030 due to strong industrial automation adoption, automotive manufacturing growth, electronics production, and government initiatives supporting smart manufacturing. (MarketsandMarkets)
What does the MarketsandMarkets actuators market report cover?
The report covers market size forecasts, competitive landscape, growth drivers, trends, opportunities, and segmentation by actuation (electric, hydraulic, pneumatic), type (linear, rotary), application (industrial automation, robotics, vehicle equipment), verticals (automotive, aerospace & defense, power generation), and regions. The report includes 260+ pages and 280+ market tables with analysis for 2021–2030. (MarketsandMarkets)
Need a Tailored Report?
Customize this report to your needs
Get 10% FREE Customization
Customize This ReportPersonalize This Research
- Triangulate with your Own Data
- Get Data as per your Format and Definition
- Gain a Deeper Dive on a Specific Application, Geography, Customer or Competitor
- Any level of Personalization
Let Us Help You
- What are the Known and Unknown Adjacencies Impacting the Actuators Market
- What will your New Revenue Sources be?
- Who will be your Top Customer; what will make them switch?
- Defend your Market Share or Win Competitors
- Get a Scorecard for Target Partners

Custom Market Research Services
We Will Customise The Research For You, In Case The Report Listed Above Does Not Meet With Your Requirements
Get 10% Free CustomisationTESTIMONIALS

Tetsuya Ohhira
Business Development Manager-Technology Business
Nikon Corporation,
Leading Japanese MNC specializing in optics and imaging productswww.nikon.com
MarketsandMarkets™ response
is quick. Their attitude is flexible and positive. Analyst Insights are globally considered and
significant. Client Services quickly respond to our inquiry and demand. Their wide range of global
surveys help us make our strategic plan.
We hope Knowledge Store will be easier to search
for a report.
VP - Marketing & Business Development
Leading Provider of Process Control Solutions
We engaged with MarketsandMarkets on a study to perform an analysis and recommend a Go-To-Market strategy for metrology and process control in the semiconductor market. The study was tailored to our targets and needs with well-defined milestones. Our overall experience with the MarketsandMarkets team was very good throughout the project in all aspects including the analysis methodologies used, the quality and depth of primary and secondary data sets, the professionalism and flexibility of the team and the ability to meet the target schedule and milestones. We want to thank MarketsandMarkets team for a job well done.
- Canada Actuators Market
- US Actuators Market
- Germany Actuators Market
- UK Actuators Market
- France Actuators Market
- Italy Actuators Market
- Russia Actuators Market
- China Actuators Market
- India Actuators Market
- Japan Actuators Market
- South Korea Actuators Market
- Australia Actuators Market
- Saudi Arabia Actuators Market
- UAE Actuators Market
- Middle East Actuators Market
- Rest Of Europe Actuators Market
Growth opportunities and latent adjacency in Actuators Market


David
Apr, 2026
How is the shift from hydraulic and pneumatic systems to electric actuation transforming the global actuators market, and what are the long-term implications for industrial efficiency and sustainability?.
Gregory
Apr, 2026
Which regions (such as Asia Pacific, North America, and Europe) are expected to dominate the actuators market through 2030, and what macroeconomic and industrial factors are driving this growth?.
Natalia
Apr, 2026
What are the key technological advancements, including smart actuators, artificial muscles, and power electronics, shaping the future of actuator design and functionality?.
Michael
Jun, 2019
I am interested in this report as a demonstration to the Department of Defense that fluid power actuators continue to be a very viable solution within industry despite the proliferation of electric actuators..
Javier
Mar, 2019
I am researching the market potential of shape memory alloy actuators in the global actuator market and the aerospace market. .
Benjamin
Oct, 2019
We are interested in the worldwide growth and absolute revenue of electric alternatives instead of pneumatic actuators..
LEE
Jun, 2019
We developed an actuator product and we are doing a market research to sell this product. We need information for faster sales response and further development. I hope you will help me with market information related to actuators or market information related to sales. Thank you..