Microcatheters Market by Type (Delivery, Diagnostic, Aspiration, Steerable), Design (Single, Dual), Application (Cardiovascular, Neurovascular, Peripheral Vascular, Oncology), End-User (Hospitals, Ambulatory Surgical Centers) - Global Forecast to 2028
The global microcatheters market in terms of revenue was estimated to be worth $874 million in 2023 and is poised to reach $1,142 million by 2028, growing at a CAGR of 5.5% from 2023 to 2028. The new research study consists of an industry trend analysis of the market. The new research study consists of industry trends, pricing analysis, patent analysis, conference and webinar materials, key stakeholders, and buying behaviour in the market. Rising demand for image-guided interventions and Increasing investment in healthcare infrastructure are a few drivers that collectively contribute to the growth of the microcatheters industry, and as healthcare technologies continue to evolve, the demand for microcatheters is expected to rise further in the coming years. However, higher initial high investment cost limits the entry of new participants and market growth.
Attractive Opportunities in the Microcatheters Market
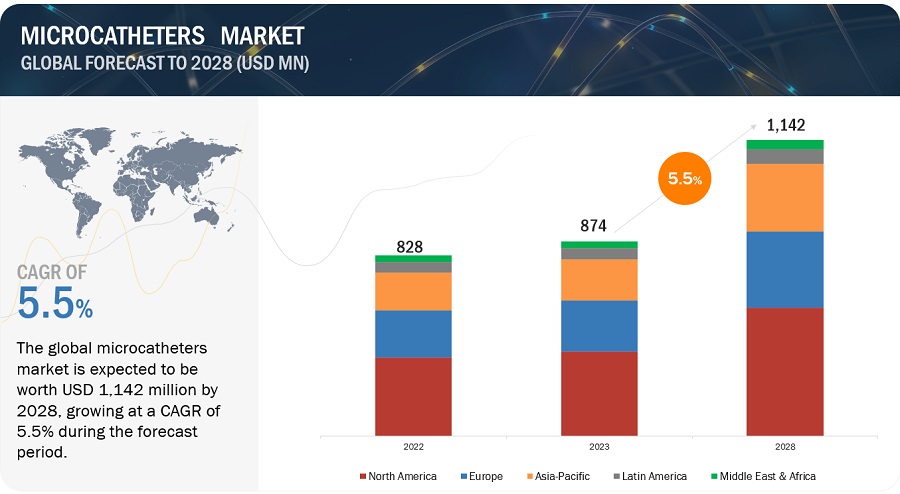
To know about the assumptions considered for the study, Request for Free Sample Report
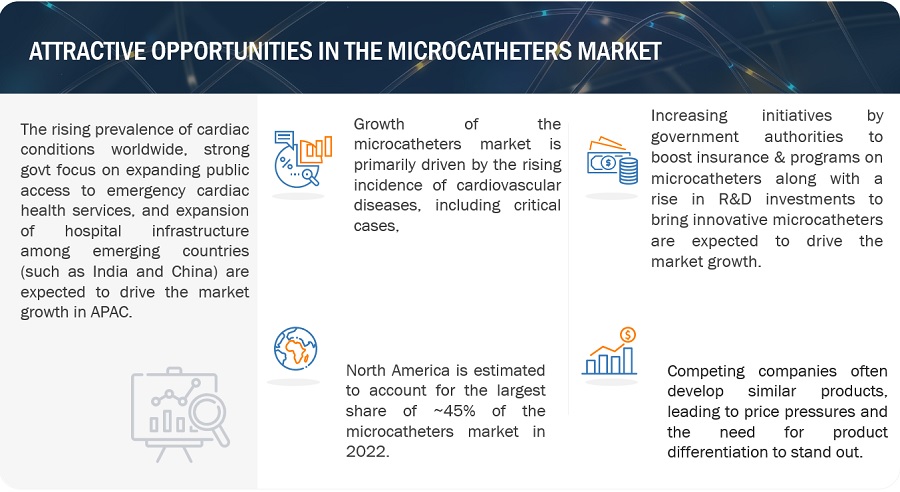
Microcatheters Market: Market Dynamics
Driver: Increasing Prevalence of Chronic Diseases
The rising incidence of chronic diseases such as cardiovascular diseases, neurovascular disorders, and cancer drives the demand for microcatheters. These conditions often require minimally invasive interventions, where microcatheters play a critical role.
Growing Aging Population:
The global aging population is a significant driver of the microcatheter industry. Older individuals are more susceptible to various medical conditions, including those that require interventional procedures. The aging demographic fuels the demand for microcatheters as a key tool for diagnosis and treatment.
Advancements in Minimally Invasive Techniques:
The development of advanced minimally invasive techniques has revolutionized medical procedures. Microcatheters enable physicians to navigate through intricate anatomical structures with precision and perform targeted interventions. The demand for microcatheters is driven by the desire for less invasive procedures that offer reduced patient trauma and faster recovery times.
Technological Innovations:
Ongoing advancements in microcatheter technology contribute to market growth. Manufacturers are continuously improving catheter design, materials, flexibility, and trackability. These innovations enhance the performance, safety, and efficacy of microcatheters, leading to increased adoption in medical procedures.
Restraint: Stringent Regulatory Requirements
Microcatheters are classified as medical devices and are subject to rigorous regulatory scrutiny and approval processes in many countries. Compliance with regulatory requirements, such as obtaining necessary certifications and clearances, can pose challenges and lead to delays in product launches or market entry.
High Cost of Microcatheters:
Microcatheters can be relatively expensive due to their advanced technology, specialized materials, and manufacturing processes. The high cost of microcatheters can limit their adoption, especially in regions with limited healthcare budgets or where reimbursement may be inadequate. Cost considerations can also affect the willingness of healthcare providers to invest in newer and more advanced microcatheter models.
Limited Availability in Developing Regions
Microcatheters may be less accessible in certain developing regions due to factors such as limited healthcare infrastructure, lack of trained healthcare professionals, and challenges in the distribution and supply chain. The availability and adoption of microcatheters may be constrained in these regions, impacting market growth.
Potential Risks and Complications
While microcatheters offer several advantages, there are potential risks and complications associated with their use. These can include vessel perforation, thrombosis, infection, or embolism. Concerns about these risks and complications may influence the adoption of microcatheters and lead to cautious utilization by healthcare providers.
Opportunity: Technological Advancements
Continued advancements in microcatheter technology offer opportunities for product innovation and differentiation. Companies can develop microcatheters with improved flexibility, trackability, and visibility under imaging guidance. Integration of technologies like robotics, advanced materials, and enhanced catheter navigation systems can further enhance the capabilities of microcatheters and open new avenues for growth.
Emerging Markets
There is significant growth potential for microcatheters in emerging markets. As healthcare infrastructure improves and disposable incomes rise in these regions, the demand for advanced medical procedures, including interventional treatments, is increasing. Companies can expand their presence in these markets by offering cost-effective, high-quality microcatheters tailored to local needs.
Expansion in Applications
Microcatheters have traditionally been used in cardiovascular and neurovascular interventions. However, there are opportunities to expand their applications into other medical specialties, such as urology, oncology, and gastroenterology. Companies can develop specialized microcatheters to address the specific needs of these fields and tap into new market segments.
Increasing Adoption of Minimally Invasive Procedures:
The trend towards minimally invasive procedures is expected to continue, driven by patient preference for less invasive treatments and healthcare cost containment. Microcatheters play a vital role in enabling these procedures, presenting opportunities for companies to provide innovative solutions that improve procedural outcomes and patient experiences.
Collaboration and Partnerships
Collaborations between medical device manufacturers, healthcare providers, and research institutions can drive innovation and accelerate market growth. Partnerships can facilitate the development of new microcatheter technologies, expand market reach, and foster knowledge exchange to address unmet clinical needs.
Challenge: Competitive Landscape
The microcatheters industry is highly competitive, with numerous manufacturers vying for market share. Competing companies often develop similar products, leading to price pressures and the need for product differentiation to stand out. The presence of established players with strong brand recognition can make it challenging for new entrants to gain market traction.
Cost Pressures
Microcatheters can be relatively expensive due to their advanced technology, specialized materials, and manufacturing processes. The high cost of microcatheters can limit their adoption, especially in regions with limited healthcare budgets or where reimbursement rates may not adequately cover the expenses. Cost considerations can also affect the willingness of healthcare providers to invest in newer and more advanced microcatheter models.
Product Complexity and Variability
Microcatheters come in various shapes, sizes, and specifications to address different clinical needs. The wide range of product options can lead to complexity in product selection, training, and inventory management for healthcare providers. The need to ensure proper product knowledge and compatibility with other devices can pose challenges for clinicians.
Training and Skill Requirements
The effective use of microcatheters requires specialized training and expertise. Healthcare professionals need to acquire the necessary skills to navigate through complex anatomical structures and perform procedures safely. Ensuring the availability of comprehensive training programs and opportunities for skill development can be a challenge, particularly in regions with limited access to training resources.
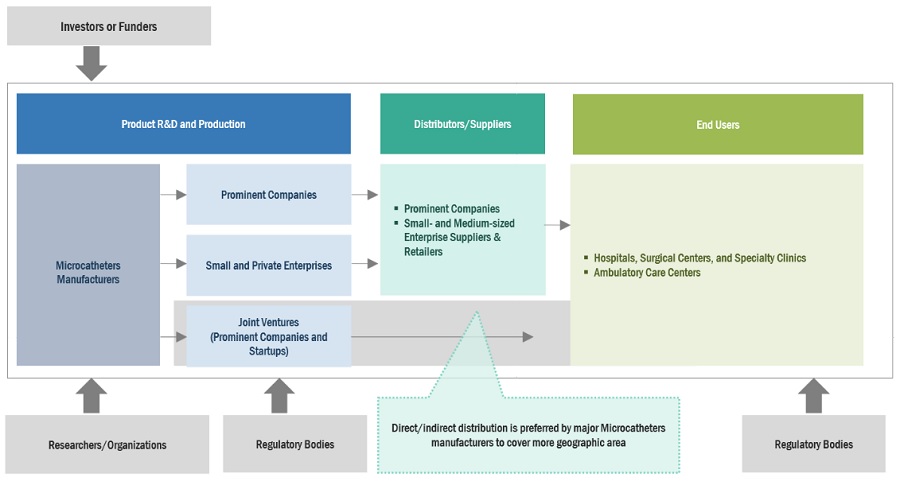
MICROCATHETERS MARKET ECOSYSTEM
Major companies in this market include well-established and financially stable suppliers of microcatheter systems, reagents, gel documentation systems, and software. Prominent companies in this market include Boston Scientific Corporation Massachusetts, US), Medtronic plc (Dublin, Ireland), Terumo Corporation (Tokyo, Japan), Johnson & Johnson (New Jersey, US), Cook Medical Inc. (Indiana, US), Abbott Laboratories (Illinois, US), B. Braun Melsungen AG (Melsungen, Germany), Cardinal Health, Inc. (Ohio, US) among several others.
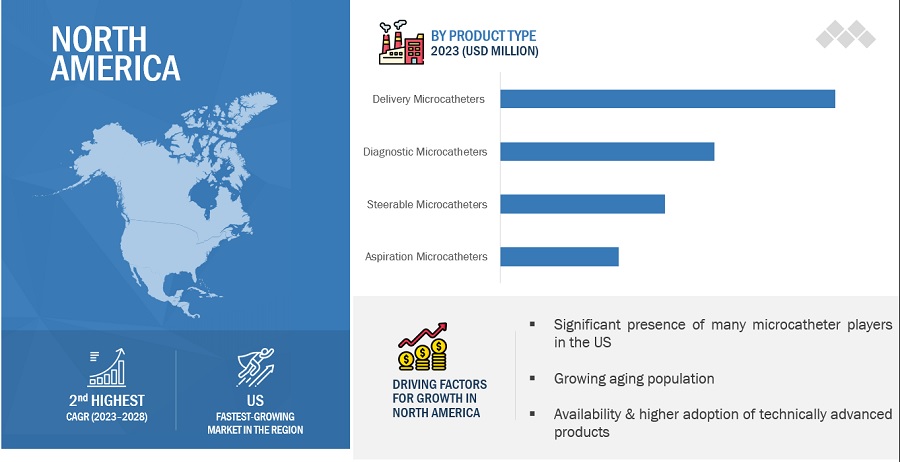
Delivery Microcatheters segment of the Microcatheters Industry to register significant growth rate over the forecast period of 2022-2028
Based on the product type, the microcatheters market is segmented into Delivery Microcatheter, Aspiration Microcatheter, Diagnostic Microcatheter, and Steerable Microcatheter. Delivery Microcatheters segment to register a significant growth rate over the forecast period of 2022-2028. delivery microcatheter drivers typically consist of the following components. Handling, the handle of the driver provides a comfortable grip for the physician or operator to hold and control the device. It may have ergonomic features or finger grips to enhance maneuverability. Steerable Tip: The distal end of the driver features a steerable tip that can be deflected or angled to navigate through tortuous vascular pathways. The tip may be made of flexible materials or contain shape-memory alloys that allow it to be shaped and re-shaped as needed. This, among other factors, is expected to drive the growth of the segment.
The cardiovascular application segment accounted for the largest share of the Microcatheters Industry in 2022-2028
Based on the application, the Microcatheters market is segmented into Cardiovascular, Neurovascular, Peripheral Vascular, Urology, Otolaryngology, and other applications. Microcatheters enable physicians to perform complex cardiovascular interventions using minimally invasive techniques. Compared to traditional open surgeries, minimally invasive procedures offer several advantages, including reduced trauma, shorter hospital stays, faster recovery, and improved patient outcomes. Microcatheters facilitate the delivery of therapeutic agents, devices, and embolic materials to precise locations within the cardiovascular system, allowing physicians to treat blockages, malformations, or other conditions without the need for extensive surgical procedures. The increasing preference for minimally invasive approaches in cardiovascular interventions drives the demand for microcatheters.
The single-lumen microcatheter segment accounted for the largest share of the microcatheters industry in 2022-2028
Based on the design, the microcatheters market is segmented into single-lumen microcatheter and Dual Lumen Microcatheter. The single-lumen microcatheter design segment is estimated to hold the largest market share of the microcatheters industry during the forecast period.
This segment held a share of 91.7% in 2022. As the global population continues to age, there is a rise in the incidence of age-related medical conditions, such as cardiovascular diseases and neurovascular disorders. Single-lumen microcatheters are frequently utilized in the diagnosis and treatment of these conditions. The expanding aging population contributes to the market growth of microcatheters.
Hospitals, Surgical Centers, and Specialty Clinics’ segment to register for the highest growth rate of the microcatheters industry in 2022-2028
The major end users in the microcatheters market are hospitals, surgical centers & specialty clinics, and ambulatory surgical centers. hospitals, surgical centers, and specialty clinics are expected to dominate the market during the forecast period. Microcatheters have become an integral part of many interventional procedures, such as angiography, embolization, and percutaneous interventions. As medical technology advances, there is an increasing trend towards less invasive procedures, and microcatheters play a vital role in enabling these minimally invasive techniques. Hospitals may expand their use of microcatheters to keep up with the growing demand for interventional procedures.
North America is expected to be the largest region of the Microcatheters Industry during the forecast period.
North America, comprising the US and Canada, held the largest share of the microcatheters market in 2022. This region is witnessing a surge in demand for microcatheters to address and manage cardiovascular diseases, which is further amplified by the growing number of surgical procedures involving microcatheters.
To know about the assumptions considered for the study, download the pdf brochure
As of 2021, prominent players in the market are Boston Scientific Corporation. (US), Stryker Corporation (US), Teleflex Incorporated (US), Cook Group (US), Becton Dickinson and Company (US), and Asahi Intecc Co.ltd (Japan), among others.
Scope of the Microcatheters Industry
|
Report Metric |
Details |
|
Market Revenue in 2023 |
$874 million |
|
Projected Revenue by 2028 |
$1,142 million |
|
Revenue Rate |
Poised to Grow at a CAGR of 5.5% |
|
Market Driver |
Increasing Prevalence of Chronic Diseases |
|
Market Opportunity |
Technological Advancements |
This report has segmented the global microcatheters market to forecast revenue and analyze trends in each of the following submarkets:
By Product Type
- Delivery Microcatheter
- Aspiration Microcatheter
- Diagnostic Microcatheter
- Steerable Microcatheter
By Application
- Cardiovascular
- Neurovascular
- Peripheral Vascular
- Urology
- Otolaryngology
- Other Applications
By Product Design
- Single Lumen Microcatheter
- Dual Lumen Microcatheter
By End User
- Hospitals and Clinics
- Ambulatory Surgical Centers
By Region
-
North America
- US
- Canada
-
Europe
- Germany
- France
- UK
- Italy
- Spain
- Rest of Europe
-
Asia Pacific
- Japan
- China
- India
- Australia
- South Korea
- Rest of Asia Pacific
-
Latin America
- Brazil
- Mexico
- MEA
Recent Developments of Microcatheters Industry
- In 2021, Terumo medical corporation introduced a new microcatheter named PG Pro Peripheral Microcatheter.
- In 2020, Tri Saslus introduced TriNav Microcatheter, globally.
Frequently Asked Questions (FAQ):
What is the projected market revenue value of the global microcatheters market?
The global microcatheters market boasts a total revenue value of $1,142 million by 2028.
What is the estimated growth rate (CAGR) of the global microcatheters market?
The global microcatheters market has an estimated compound annual growth rate (CAGR) of 5.5% and a revenue size in the region of $874 million in 2023.
To speak to our analyst for a discussion on the above findings, click Speak to Analyst


- 5.1 INTRODUCTION
-
5.2 MARKET DYNAMICSDRIVERS- Rising target patient population suffering from chronic diseases globally- Advancements in microcatheter technologies- Increase in government initiatives, healthcare funding, and health-related services- Increased preference for minimally invasive surgeries over traditional open surgeriesRESTRAINTS- Stringent regulatory guidelines in mature markets- High cost of microcatheters and budget constraints in healthcare facilitiesOPPORTUNITIES- Expansion of key players in emerging economies- Rising healthcare expenditure across emerging economiesCHALLENGES- Availability of alternative technologies for catheterization
-
5.3 KEY STAKEHOLDERS AND BUYING CRITERIAKEY STAKEHOLDERS IN BUYING PROCESS
-
5.4 PORTER’S FIVE FORCES ANALYSISTHREAT OF NEW ENTRANTSTHREAT OF SUBSTITUTESBARGAINING POWER OF SUPPLIERSBARGAINING POWER OF BUYERSINTENSITY OF COMPETITIVE RIVALRY
-
5.5 REGULATORY ANALYSISUSEUROPEJAPAN
- 5.6 PRICING ANALYSIS
- 5.7 REIMBURSEMENT SCENARIO ANALYSIS
-
5.8 ECOSYSTEM MAPPING
-
5.9 VALUE CHAIN ANALYSISRESEARCH & DEVELOPMENTPROCUREMENT AND PRODUCT DEVELOPMENTMARKETING, SALES AND DISTRIBUTION, AND POST-SALES SERVICES
-
5.10 SUPPLY CHAIN ANALYSISPROMINENT COMPANIESSMALL & MEDIUM-SIZED COMPANIESEND USERS
-
5.11 PATENT ANALYSIS
- 5.12 TECHNOLOGY ANALYSIS
- 5.13 CASE STUDY ANALYSIS
- 5.14 KEY CONFERENCES AND EVENTS IN 2023–2024
-
5.15 TRENDS/DISRUPTIONS IMPACTING CUSTOMERS’ BUSINESSES
- 5.16 IMPACT OF ECONOMIC RECESSION ON MICROCATHETERS MARKET
- 6.1 INTRODUCTION
-
6.2 DELIVERY MICROCATHETERSINCREASING NUMBER OF TARGET INTERVENTIONAL PROCEDURES TO DRIVE MARKET
-
6.3 ASPIRATION MICROCATHETERSGROWING BURDEN OF CARDIOVASCULAR DISEASES AND RELATED MEDICAL CONDITIONS TO DRIVE MARKET
-
6.4 DIAGNOSTIC MICROCATHETERSLARGE TARGET PATIENT POPULATION FOR VASCULAR DISEASES TO DRIVE MARKET
-
6.5 STEERABLE MICROCATHETERSGROWING NUMBER OF IMAGE-GUIDED AND MINIMALLY INVASIVE MEDICAL PROCEDURES TO DRIVE MARKET
- 7.1 INTRODUCTION
-
7.2 SINGLE-LUMEN MICROCATHETERSINCREASING NUMBER OF TARGET MEDICAL PROCEDURES AND OPERATIONAL ADVANTAGES TO DRIVE MARKET
-
7.3 DUAL AND MULTI-LUMEN MICROCATHETERSIMPROVED SURGICAL PRECISION AND INCREASED ADOPTION IN COMPLEX VASCULAR PROCEDURES TO DRIVE MARKET
- 8.1 INTRODUCTION
-
8.2 CARDIOVASCULAR APPLICATIONSEFFECTIVE DEVICE PLACEMENT DURING MINIMALLY INVASIVE PROCEDURES AND CRITICAL CARDIAC SURGERIES TO DRIVE MARKET
-
8.3 NEUROVASCULAR APPLICATIONSINCREASING INCIDENCE OF TARGET NEUROLOGICAL CONDITIONS TO DRIVE MARKET
-
8.4 PERIPHERAL VASCULAR APPLICATIONSRISING NUMBER OF DIAGNOSTIC AND INTERVENTIONAL PROCEDURES TO DRIVE MARKET
-
8.5 UROLOGY APPLICATIONSINCREASING PREVALENCE OF UROLOGICAL DISORDERS AND ADVANCEMENTS IN MINIMALLY INVASIVE TECHNIQUES TO DRIVE MARKET
-
8.6 ONCOLOGY APPLICATIONSINCREASING CLINICAL RESEARCH ON MINIMALLY INVASIVE CANCER TREATMENT TO DRIVE MARKET
-
8.7 OTOLARYNGOLOGY APPLICATIONSINCREASED NEED FOR DELICATE ACCESS AND PRECISE NAVIGATION IN DIAGNOSIS TO DRIVE MARKET
- 8.8 OTHER APPLICATIONS
- 9.1 INTRODUCTION
-
9.2 HOSPITALS, SURGICAL CENTERS, AND SPECIALTY CLINICSLARGE NUMBER OF SURGICAL AND DIAGNOSTIC PROCEDURES TO DRIVE MARKET
-
9.3 AMBULATORY CARE CENTERSGROWING PATIENT SUBMISSIONS FOR DIAGNOSTIC PROCEDURES IN EMERGING ECONOMIES TO DRIVE MARKET
- 10.1 INTRODUCTION
-
10.2 NORTH AMERICARECESSION IMPACT: NORTH AMERICAUS- US to dominate North American microcatheters market during forecast periodCANADA- Increasing prevalence of target diseases and high demand for timely diagnosis to drive market
- 10.3 EUROPE
-
10.4 RECESSION IMPACT: EUROPEGERMANY- Increasing aging population and rising life expectancy to drive marketFRANCE- Significant evolution of healthcare sector and growth in geriatric population to drive marketUK- High burden of chronic diseases and large volumes of surgeries to drive marketITALY- Increasing geriatric population to drive marketSPAIN- Increasing technological developments in healthcare sector to drive marketREST OF EUROPE
- 10.5 ASIA PACIFIC
-
10.6 RECESSION IMPACT: ASIA PACIFICJAPAN- Increasing geriatric population and surgical procedures to drive marketCHINA- Growing prevalence of chronic disorders and developing healthcare infrastructure to drive marketINDIA- Increasing target patient population with rising availability of advanced surgical treatments to drive marketAUSTRALIA- Developing healthcare sector and increasing availability of advanced surgical treatments to drive marketSOUTH KOREA- Growing target patient population to drive marketREST OF ASIA PACIFIC
- 10.7 LATIN AMERICA
-
10.8 RECESSION IMPACT: LATIN AMERICABRAZIL- Developing healthcare sector and increasing availability of advanced surgical treatments to drive marketMEXICO- Favorable government initiatives and rapidly growing healthcare sector to drive market
-
10.9 MIDDLE EAST & AFRICAINCREASING FOCUS OF MARKET PLAYERS AND ONGOING ECONOMIC GROWTH TO DRIVE MARKET
- 10.10 RECESSION IMPACT: MIDDLE EAST & AFRICA

- 11.1 OVERVIEW
-
11.2 KEY STRATEGIES ADOPTED BY MAJOR PLAYERSOVERVIEW OF STRATEGIES ADOPTED BY KEY PLAYERS IN MICROCATHETERS MARKET
- 11.3 REVENUE SHARE ANALYSIS OF KEY MARKET PLAYERS
- 11.4 MARKET RANKING ANALYSIS
-
11.5 COMPANY EVALUATION MATRIX FOR KEY PLAYERS (2022)STARSEMERGING LEADERSPERVASIVE PLAYERSPARTICIPANTS
-
11.6 COMPANY EVALUATION MATRIX FOR START-UPS/SMES (2022)PROGRESSIVE COMPANIESSTARTING BLOCKSRESPONSIVE COMPANIESDYNAMIC COMPANIES
- 11.7 COMPANY FOOTPRINT
- 11.8 COMPETITIVE SCENARIOS AND TRENDS
-
12.1 KEY PLAYERSMEDTRONIC- Business overview- Products offered- Recent developments- MnM viewBOSTON SCIENTIFIC CORPORATION- Business overview- Products offered- Recent developments- MnM viewTERUMO MEDICAL CORPORATION- Business overview- Products offered- Recent developments- MnM viewTELEFLEX INCORPORATED- Business overview- Products offered- Recent developments- MnM viewMERIT MEDICAL SYSTEMS, INC.- Business overview- Products offered- Recent developments- MnM viewASAHI INTECC CO., LTD.- Business overview- Products offered- Recent developments- MnM viewSTRYKER- Business overview- Products offered- Recent developmentsSURMODICS, INC.- Business overview- Products offered- Recent developmentsCARDINAL HEALTH, INC.- Business overview- Products offered- Recent developmentsJOHNSON & JOHNSON- Business overview- Products offered- Recent developmentsGUERBET LLC- Business overview- Products offered- Recent developmentsLEPU MEDICAL TECHNOLOGY (BEIJING) CO., LTD- Business overview- Products offered- Recent developmentsBECTON, DICKINSON AND COMPANY- Business overview- Products offered- Recent developmentsPENUMBRA, INC.- Business overview- Products offered- Recent developmentsKANEKA CORPORATION- Business overview- Products offered- Recent developmentsANGIODYNAMICS, INC.- Business overview- Products offered- Recent developmentsBIOCARDIA INC.- Business overview- Products offered- Recent developments
-
12.2 OTHER PLAYERSMILLAR, INC.- Products offeredBAYLIS MEDICAL COMPANY, INC.- Products offeredEMBOLX, INC.- Products offeredACANDIS GMBH- Products offeredACROSTAK- Products offeredCOOK MEDICAL- Products offeredREFLOW MEDICAL, INC.- Products offeredTZ MEDICAL, INC.- Products offeredORBUSNEICH MEDICAL- Products offeredSPARTAN MICRO, INC.- Products offeredTRANSIT SCIENTIFIC- Products offeredTOKAI MEDICAL PRODUCTS- Products offeredLIBATAPE PHARMACEUTICAL CO., LTD- Products offered
- 13.1 DISCUSSION GUIDE
- 13.2 KNOWLEDGESTORE: MARKETSANDMARKETS’ SUBSCRIPTION PORTAL
- 13.3 CUSTOMIZATION OPTIONS
- 13.4 RELATED REPORTS
- 13.5 AUTHOR DETAILS
- TABLE 1 MICROCATHETERS MARKET: RISK ASSESSMENT
- TABLE 2 NATIONAL AVERAGE MEDICARE REIMBURSEMENT CPT CODES, 2022
- TABLE 3 INFLUENCE OF STAKEHOLDERS ON BUYING PROCESS FOR KEY PRODUCT SEGMENTS (%)
- TABLE 4 MICROCATHETERS MARKET: PORTER’S FIVE FORCES ANALYSIS
- TABLE 5 US: MEDICAL DEVICE REGULATORY APPROVAL PROCESS
- TABLE 6 JAPAN: MEDICAL DEVICE CLASSIFICATION UNDER PMDA
- TABLE 7 PRICING ANALYSIS: MICROCATHETERS MARKET, 2023 (USD)
- TABLE 8 CPT CODES FOR MAJOR MICROCATHETERS
- TABLE 9 IMPORT DATA FOR MICROCATHETERS (HS CODE 9018), BY COUNTRY, 2018–2022 (USD THOUSAND)
- TABLE 10 EXPORT DATA FOR MICROCATHETERS (HS CODE 9018), BY COUNTRY, 2018–2022 (USD THOUSAND)
- TABLE 11 CASE STUDY: EMBOLIZATION FOR CHEST WALL HEMORRHAGE-DIREXION MICROCATHETER STORY
- TABLE 12 DETAILED LIST OF KEY CONFERENCES AND EVENTS IN 2023–2024
- TABLE 13 MICROCATHETERS MARKET, BY PRODUCT, 2020–2028 (USD MILLION)
- TABLE 14 MICROCATHETERS MARKET, BY APPLICATION, 2020–2028 (USD MILLION)
- TABLE 15 MICROCATHETERS MARKET, BY END USER, 2020–2028 (USD MILLION)
- TABLE 16 MICROCATHETERS MARKET, BY PRODUCT DESIGN, 2020–2028 (USD MILLION)
- TABLE 17 MICROCATHETERS MARKET FOR DELIVERY MICROCATHETERS, BY REGION, 2020–2028 (USD MILLION)
- TABLE 18 MICROCATHETERS MARKET FOR DELIVERY MICROCATHETERS, BY PRODUCT DESIGN, 2020–2028 (USD MILLION)
- TABLE 19 MICROCATHETERS MARKET FOR DELIVERY MICROCATHETERS, BY APPLICATION, 2020–2028 (USD MILLION)
- TABLE 20 MICROCATHETERS MARKET FOR DELIVERY MICROCATHETERS, BY END USER, 2020–2028 (USD MILLION)
- TABLE 21 MICROCATHETERS MARKET FOR ASPIRATION MICROCATHETERS, BY REGION, 2020–2028 (USD MILLION)
- TABLE 22 MICROCATHETERS MARKET FOR ASPIRATION MICROCATHETERS, BY PRODUCT DESIGN, 2020–2028 (USD MILLION)
- TABLE 23 MICROCATHETERS MARKET FOR ASPIRATION MICROCATHETERS, BY APPLICATION, 2020–2028 (USD MILLION)
- TABLE 24 MICROCATHETERS MARKET FOR ASPIRATION MICROCATHETERS, BY END USER, 2020–2028 (USD MILLION)
- TABLE 25 MICROCATHETERS MARKET FOR DIAGNOSTIC MICROCATHETERS, BY REGION, 2020–2028 (USD MILLION)
- TABLE 26 MICROCATHETERS MARKET FOR DIAGNOSTIC MICROCATHETERS, BY PRODUCT DESIGN, 2020–2028 (USD MILLION)
- TABLE 27 MICROCATHETERS MARKET FOR DIAGNOSTIC MICROCATHETERS, BY APPLICATION, 2020–2028 (USD MILLION)
- TABLE 28 MICROCATHETERS MARKET FOR DIAGNOSTIC MICROCATHETERS, BY END USER, 2020–2028 (USD MILLION)
- TABLE 29 MICROCATHETERS MARKET FOR STEERABLE MICROCATHETERS, BY REGION, 2020–2028 (USD MILLION)
- TABLE 30 MICROCATHETERS MARKET FOR STEERABLE MICROCATHETERS, BY PRODUCT DESIGN, 2020–2028 (USD MILLION)
- TABLE 31 MICROCATHETERS MARKET FOR STEERABLE MICROCATHETERS, BY APPLICATION, 2020–2028 (USD MILLION)
- TABLE 32 MICROCATHETERS MARKET FOR STEERABLE MICROCATHETERS, BY END USER, 2020–2028 (USD MILLION)
- TABLE 33 MICROCATHETERS MARKET, BY PRODUCT DESIGN, 2020–2028 (USD MILLION)
- TABLE 34 MICROCATHETERS MARKET FOR SINGLE-LUMEN MICROCATHETERS, BY REGION, 2020–2028 (USD MILLION)
- TABLE 35 MICROCATHETERS MARKET FOR DUAL AND MULTI-LUMEN MICROCATHETERS, BY REGION, 2020–2028 (USD MILLION)
- TABLE 36 MICROCATHETERS MARKET, BY APPLICATION, 2020–2028 (USD MILLION)
- TABLE 37 MICROCATHETERS MARKET FOR CARDIOVASCULAR APPLICATIONS, BY REGION, 2020–2028 (USD MILLION)
- TABLE 38 MICROCATHETERS MARKET FOR NEUROVASCULAR APPLICATIONS, BY REGION, 2020–2028 (USD MILLION)
- TABLE 39 MICROCATHETERS MARKET FOR PERIPHERAL VASCULAR APPLICATIONS, BY REGION, 2020–2028 (USD MILLION)
- TABLE 40 MICROCATHETERS MARKET FOR UROLOGY APPLICATIONS, BY REGION, 2020–2028 (USD MILLION)
- TABLE 41 MICROCATHETERS MARKET FOR ONCOLOGY APPLICATIONS, BY REGION, 2020–2028 (USD MILLION)
- TABLE 42 MICROCATHETERS MARKET FOR OTOLARYNGOLOGY APPLICATIONS, BY REGION, 2020–2028 (USD MILLION)
- TABLE 43 MICROCATHETERS MARKET FOR OTHER APPLICATIONS, BY REGION, 2020–2028 (USD MILLION)
- TABLE 44 MICROCATHETERS MARKET, BY END USER, 2020–2028 (USD MILLION)
- TABLE 45 MICROCATHETERS MARKET FOR HOSPITALS, SURGICAL CENTERS, AND SPECIALTY CLINICS, BY REGION, 2020–2028 (USD MILLION)
- TABLE 46 MICROCATHETERS MARKET FOR AMBULATORY CARE CENTERS, BY REGION, 2020–2028 (USD MILLION)
- TABLE 47 MICROCATHETERS MARKET, BY REGION, 2020–2028 (USD MILLION)
- TABLE 48 NORTH AMERICA: MICROCATHETERS MARKET, BY COUNTRY, 2020–2028 (USD MILLION)
- TABLE 49 NORTH AMERICA: MICROCATHETERS MARKET, BY PRODUCT, 2020–2028 (USD MILLION)
- TABLE 50 NORTH AMERICA: MICROCATHETERS MARKET, BY PRODUCT DESIGN, 2020–2028 (USD MILLION)
- TABLE 51 NORTH AMERICA: MICROCATHETERS MARKET, BY APPLICATION, 2020–2028 (USD MILLION)
- TABLE 52 NORTH AMERICA: MICROCATHETERS MARKET, BY END USER, 2020–2028 (USD MILLION)
- TABLE 53 US: MICROCATHETERS MARKET, BY PRODUCT, 2020–2028 (USD MILLION)
- TABLE 54 CANADA: MICROCATHETERS MARKET, BY PRODUCT, 2020–2028 (USD MILLION)
- TABLE 55 EUROPE: MICROCATHETERS MARKET, BY COUNTRY, 2020–2028 (USD MILLION)
- TABLE 56 EUROPE: MICROCATHETERS MARKET, BY PRODUCT, 2020–2028 (USD MILLION)
- TABLE 57 EUROPE: MICROCATHETERS MARKET, BY PRODUCT DESIGN, 2020–2028 (USD MILLION)
- TABLE 58 EUROPE: MICROCATHETERS MARKET, BY APPLICATION, 2020–2028 (USD MILLION)
- TABLE 59 EUROPE: MICROCATHETERS MARKET, BY END USER, 2020–2028 (USD MILLION)
- TABLE 60 GERMANY: MICROCATHETERS MARKET, BY PRODUCT, 2020–2028 (USD MILLION)
- TABLE 61 FRANCE: MICROCATHETERS MARKET, BY PRODUCT, 2020–2028 (USD MILLION)
- TABLE 62 UK: MICROCATHETERS MARKET, BY PRODUCT, 2020–2028 (USD MILLION)
- TABLE 63 ITALY: MICROCATHETERS MARKET, BY PRODUCT, 2020–2028 (USD MILLION)
- TABLE 64 SPAIN: MICROCATHETERS MARKET, BY PRODUCT, 2020–2028 (USD MILLION)
- TABLE 65 REST OF EUROPE: MICROCATHETERS MARKET, BY PRODUCT, 2020–2028 (USD MILLION)
- TABLE 66 ASIA PACIFIC: MICROCATHETERS MARKET, BY COUNTRY, 2020–2028 (USD MILLION)
- TABLE 67 ASIA PACIFIC: MICROCATHETERS MARKET, BY PRODUCT, 2020–2028 (USD MILLION)
- TABLE 68 ASIA PACIFIC: MICROCATHETERS MARKET, BY PRODUCT DESIGN, 2020–2028 (USD MILLION)
- TABLE 69 ASIA PACIFIC: MICROCATHETERS MARKET, BY APPLICATION, 2020–2028 (USD MILLION)
- TABLE 70 ASIA PACIFIC: MICROCATHETERS MARKET, BY END USER, 2020–2028 (USD MILLION)
- TABLE 71 JAPAN: MICROCATHETERS MARKET, BY PRODUCT, 2020–2028 (USD MILLION)
- TABLE 72 CHINA: MICROCATHETERS MARKET, BY PRODUCT, 2020–2028 (USD MILLION)
- TABLE 73 INDIA: MICROCATHETERS MARKET, BY PRODUCT, 2020–2028 (USD MILLION)
- TABLE 74 AUSTRALIA: MICROCATHETERS MARKET, BY PRODUCT, 2020–2028 (USD MILLION)
- TABLE 75 SOUTH KOREA: MICROCATHETERS MARKET, BY PRODUCT, 2020–2028 (USD MILLION)
- TABLE 76 REST OF ASIA PACIFIC: MICROCATHETERS MARKET, BY PRODUCT, 2020–2028 (USD MILLION)
- TABLE 77 LATIN AMERICA: MICROCATHETERS MARKET, BY COUNTRY, 2020–2028 (USD MILLION)
- TABLE 78 LATIN AMERICA: MICROCATHETERS MARKET, BY PRODUCT, 2020–2028 (USD MILLION)
- TABLE 79 LATIN AMERICA: MICROCATHETERS MARKET, BY PRODUCT DESIGN, 2020–2028 (USD MILLION)
- TABLE 80 LATIN AMERICA: MICROCATHETERS MARKET, BY APPLICATION, 2020–2028 (USD MILLION)
- TABLE 81 LATIN AMERICA: MICROCATHETERS MARKET, BY END USER, 2020–2028 (USD MILLION)
- TABLE 82 BRAZIL: MICROCATHETERS MARKET, BY PRODUCT, 2020–2028 (USD MILLION)
- TABLE 83 MEXICO: MICROCATHETERS MARKET, BY PRODUCT, 2020–2028 (USD MILLION)
- TABLE 84 MIDDLE EAST & AFRICA: MICROCATHETERS MARKET, BY PRODUCT, 2020–2028 (USD MILLION)
- TABLE 85 MIDDLE EAST & AFRICA: MICROCATHETERS MARKET, BY PRODUCT DESIGN, 2020–2028 (USD MILLION)
- TABLE 86 MIDDLE EAST & AFRICA: MICROCATHETERS MARKET, BY APPLICATION, 2020–2028 (USD MILLION)
- TABLE 87 MIDDLE EAST & AFRICA: MICROCATHETERS MARKET, BY END USER, 2020–2028 (USD MILLION)
- TABLE 88 OVERVIEW OF MAJOR STRATEGIES ADOPTED BY KEY PLAYERS IN MICROCATHETERS MARKET
- TABLE 89 PRODUCT AND REGIONAL FOOTPRINT ANALYSIS OF TOP PLAYERS IN MICROCATHETERS MARKET
- TABLE 90 COMPANY PRODUCT FOOTPRINT
- TABLE 91 COMPANY GEOGRAPHICAL FOOTPRINT
- TABLE 92 KEY PRODUCT LAUNCHES
- TABLE 93 KEY DEALS
- TABLE 94 OTHER KEY DEVELOPMENTS
- TABLE 95 MEDTRONIC: COMPANY OVERVIEW
- TABLE 96 BOSTON SCIENTIFIC CORPORATION: COMPANY OVERVIEW
- TABLE 97 TERUMO MEDICAL CORPORATION: COMPANY OVERVIEW
- TABLE 98 TELEFLEX INCORPORATED: COMPANY OVERVIEW
- TABLE 99 MERIT MEDICAL SYSTEMS, INC.: COMPANY OVERVIEW
- TABLE 100 ASAHI INTECC CO., LTD.: COMPANY OVERVIEW
- TABLE 101 STRYKER: COMPANY OVERVIEW
- TABLE 102 SURMODICS, INC.: COMPANY OVERVIEW
- TABLE 103 CARDINAL HEALTH, INC.: COMPANY OVERVIEW
- TABLE 104 JOHNSON & JOHNSON: COMPANY OVERVIEW
- TABLE 105 GUERBET LLC: COMPANY OVERVIEW
- TABLE 106 LEPU MEDICAL TECHNOLOGY (BEIJING) CO., LTD.: COMPANY OVERVIEW
- TABLE 107 BECTON, DICKINSON AND COMPANY: COMPANY OVERVIEW
- TABLE 108 PENUMBRA, INC.: COMPANY OVERVIEW
- TABLE 109 KANEKA CORPORATION: COMPANY OVERVIEW
- TABLE 110 ANGIODYNAMICS, INC.: COMPANY OVERVIEW
- TABLE 111 BIOCARDIA INC.: COMPANY OVERVIEW
- FIGURE 1 RESEARCH DESIGN: MICROCATHETERS MARKET
- FIGURE 2 RESEARCH DESIGN
- FIGURE 3 KEY DATA FROM SECONDARY SOURCES
- FIGURE 4 BREAKDOWN OF PRIMARY INTERVIEWS: SUPPLY-SIDE AND DEMAND-SIDE PARTICIPANTS
- FIGURE 5 BREAKDOWN OF PRIMARY INTERVIEWS: BY COMPANY TYPE, DESIGNATION, AND REGION
- FIGURE 6 RESEARCH METHODOLOGY: HYPOTHESIS BUILDING
- FIGURE 7 MICROCATHETERS MARKET: COMPANY REVENUE ESTIMATION APPROACH
- FIGURE 8 MICROCATHETERS MARKET: CUSTOMER-BASED MARKET SIZE ESTIMATION APPROACH
- FIGURE 9 MICROCATHETERS MARKET: TOP-DOWN APPROACH
- FIGURE 10 DATA TRIANGULATION METHODOLOGY
- FIGURE 11 MICROCATHETERS MARKET, BY PRODUCT, 2023 VS. 2028 (USD MILLION)
- FIGURE 12 MICROCATHETERS MARKET, BY APPLICATION, 2023 VS. 2028 (USD MILLION)
- FIGURE 13 MICROCATHETERS MARKET, BY PRODUCT DESIGN, 2023 VS. 2028 (USD MILLION)
- FIGURE 14 MICROCATHETERS MARKET, BY END USER, 2023 VS. 2028 (USD MILLION)
- FIGURE 15 GEOGRAPHICAL SNAPSHOT OF MICROCATHETERS MARKET
- FIGURE 16 INCREASING GERIATRIC POPULATION AND GROWING R&D INVESTMENTS BY GOVERNMENT TO DRIVE MARKET
- FIGURE 17 DELIVERY MICROCATHETERS TO DOMINATE MICROCATHETERS MARKET IN 2028
- FIGURE 18 HOSPITALS, SURGICAL CENTERS, AND SPECIALTY CLINICS SEGMENT DOMINATED MICROCATHETERS MARKET IN 2022
- FIGURE 19 INDIA TO BE FASTEST-GROWING COUNTRY IN GLOBAL MICROCATHETERS MARKET DURING STUDY PERIOD
- FIGURE 20 MICROCATHETERS MARKET: DRIVERS, RESTRAINTS, OPPORTUNITIES, AND CHALLENGES
- FIGURE 21 NUMBER OF NEW CANCER CASES (GLOBAL), BY CANCER SITE (2018 VS. 2020)
- FIGURE 22 GOVERNMENT HEALTH EXPENDITURE (% OF GDP)
- FIGURE 23 GOVERNMENT HEALTH EXPENDITURE [AS % OF GENERAL GOVERNMENT EXPENDITURE]
- FIGURE 24 INFLUENCE OF STAKEHOLDERS ON BUYING PROCESS FOR MICROCATHETERS MARKET
- FIGURE 25 VALUE CHAIN ANALYSIS: MICROCATHETERS MARKET
- FIGURE 26 SUPPLY CHAIN ANALYSIS: MICROCATHETERS MARKET
- FIGURE 27 EMERGING TRENDS AND OPPORTUNITIES AFFECTING FUTURE REVENUE MIX
- FIGURE 28 NORTH AMERICA: MICROCATHETERS MARKET SNAPSHOT
- FIGURE 29 ASIA PACIFIC: MICROCATHETERS MARKET SNAPSHOT
- FIGURE 30 REVENUE SHARE ANALYSIS OF KEY PLAYERS IN MICROCATHETERS MARKET
- FIGURE 31 MICROCATHETERS MARKET RANKING, BY KEY PLAYER (2022)
- FIGURE 32 MICROCATHETERS MARKET: COMPANY EVALUATION MATRIX FOR KEY PLAYERS, 2022
- FIGURE 33 MICROCATHETERS MARKET: COMPANY EVALUATION MATRIX FOR START-UPS/ SMES, 2022
- FIGURE 34 MEDTRONIC: COMPANY SNAPSHOT (2022)
- FIGURE 35 BOSTON SCIENTIFIC CORPORATION: COMPANY SNAPSHOT (2022)
- FIGURE 36 TERUMO MEDICAL CORPORATION: COMPANY SNAPSHOT (2022)
- FIGURE 37 TELEFLEX INCORPORATED: COMPANY SNAPSHOT (2022)
- FIGURE 38 MERIT MEDICAL SYSTEMS, INC.: COMPANY SNAPSHOT (2022)
- FIGURE 39 ASAHI INTECC CO., LTD.: COMPANY SNAPSHOT (2022)
- FIGURE 40 STRYKER: COMPANY SNAPSHOT (2022)
- FIGURE 41 SURMODICS, INC.: COMPANY SNAPSHOT (2022)
- FIGURE 42 CARDINAL HEALTH, INC.: COMPANY SNAPSHOT (2022)
- FIGURE 43 JOHNSON & JOHNSON: COMPANY SNAPSHOT (2022)
- FIGURE 44 GUERBET LLC: COMPANY SNAPSHOT (2022)
- FIGURE 45 LEPU MEDICAL TECHNOLOGY (BEIJING) CO., LTD.: COMPANY SNAPSHOT (2022)
- FIGURE 46 BECTON, DICKINSON AND COMPANY: COMPANY SNAPSHOT (2022)
- FIGURE 47 PENUMBRA, INC.: COMPANY SNAPSHOT (2022)
- FIGURE 48 KANEKA CORPORATION: COMPANY SNAPSHOT (2022)
- FIGURE 49 ANGIODYNAMICS, INC.: COMPANY SNAPSHOT (2022)
This study involved the extensive use of both primary and secondary sources. The research process involved the study of various factors affecting the industry to identify the segmentation types, industry trends, key players, competitive landscape, key market dynamics, and key player strategies.
Secondary Research
The secondary research process involves the widespread use of secondary sources, directories, databases (such as Bloomberg Businessweek, Factiva, and D&B Hoovers), white papers, annual reports, company house documents, investor presentations, and SEC filings of companies. Secondary research was used to identify and collect information useful for the extensive, technical, market-oriented, and commercial study of the microcatheters market. It was also used to obtain important information about the key players and market classification & segmentation according to industry trends to the bottom-most level and key developments related to market and technology perspectives. A database of the key industry leaders was also prepared using secondary research.
Primary Research
In the primary research process, various sources from both the supply and demand sides were interviewed to obtain qualitative and quantitative information for this report. The primary sources from the supply side include industry experts such as CEOs, vice presidents, marketing and sales directors, technology & innovation directors, and related key executives from various key companies and organizations in the microcatheters market. The primary sources from the demand side include medical OEMs, Analytical instrument OEMs, CDMOs, and service providers, among others. Primary research was conducted to validate the market segmentation, identify key players in the market, and gather insights on key industry trends & key market dynamics.
A breakdown of the primary respondents is provided below:
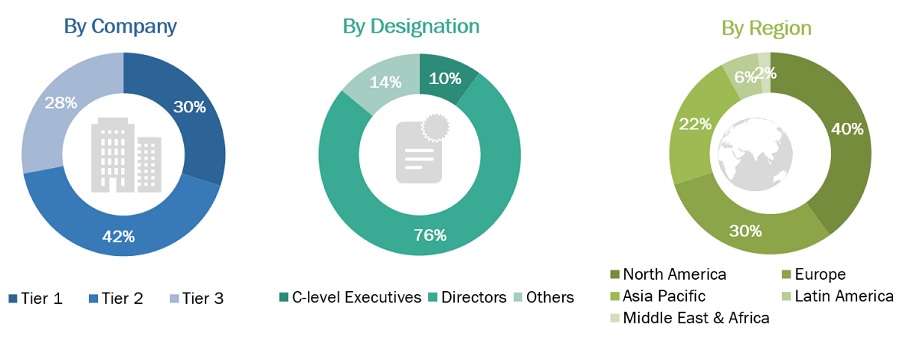
*Others include sales managers, marketing managers, business development managers, product managers, distributors, and suppliers.
Note: Companies are classified into tiers based on their total revenue. As of 2021, Tier 1 = >USD 2 billion, Tier 2 = USD 50 million to USD 2 billion, and Tier 3 = <USD 50 million.
To know about the assumptions considered for the study, download the pdf brochure
Market Estimation Methodology
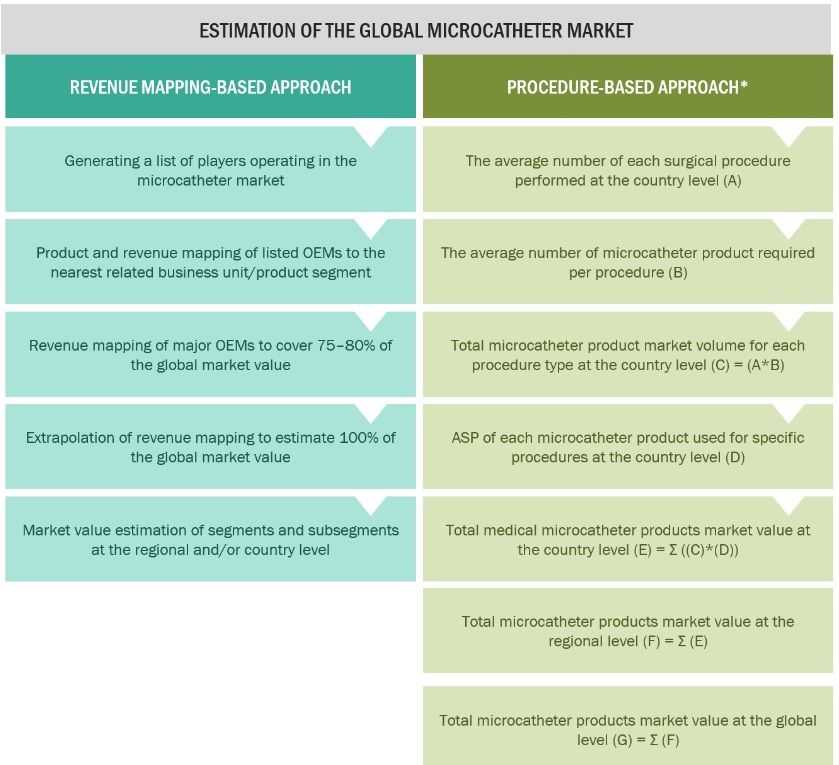
In this report, the global microcatheters market size was arrived at by using the revenue share analysis of leading players. For this purpose, key players in the market were identified, and their revenues from the microcatheter business were determined through various insights gathered during the primary and secondary research phases. Secondary research included the study of the annual and financial reports of the top market players. In contrast, primary research included extensive interviews with key opinion leaders, such as CEOs, directors, and key marketing executives.
To calculate the global market value, segmental revenues were calculated based on the revenue mapping of major solution/service providers. This process involved the following steps:
- Generating a list of major global players operating in the microcatheters industry
- Mapping annual revenues generated by major global players from the microcatheters industry segment (or nearest reported business unit/product category)
- Revenue mapping of key players to cover a major share of the global market, as of 2021
- Extrapolating the global value of the microcatheter industry
Data Triangulation
After arriving at the overall market size from the market size estimation process explained above, the global microcatheters market was split into segments and subsegments. Data triangulation and market breakdown procedures were employed to complete the overall market engineering process and arrive at the exact statistics for all segments and subsegments. The data was triangulated by studying various factors and trends from both the demand and supply sides. Additionally, the microcatheter industry was validated using both top-down and bottom-up approaches.
Market Definition
Microcatheters are small 0.70-1.30mm diameter catheters that are used for guidewire support, exchanges, to access distal anatomy, cross lesions, deliver therapeutic embolic, inject contrast media and perform other procedures in complex endovascular procedures.
Key Stakeholders
- Manufacturers of microcatheter
- Distributors of microcatheter
- Hospitals, Clinics, Cardiac Centers
- Non-government organizations
- Government regulatory authorities
- Contract manufacturers and third-party suppliers
- Research laboratories and academic institutes
- Clinical research organizations (CROs)
- Government and non-governmental regulatory authorities
Objectives of the Study
- To define, describe, and forecast the microcatheters market on the basis of product, type, application, end-user, and region
- To provide detailed information regarding the major factors influencing the growth potential of the global microcatheter industry (drivers, restraints, opportunities, challenges, and trends)
- To analyze the micro markets with respect to individual growth trends, future prospects, and contributions to the global microcatheters industry
- To analyze key growth opportunities in the global microcatheters industry for key stakeholders and provide details of the competitive landscape for market leaders
- To forecast the size of market segments and/or subsegments with respect to five major regions, namely, North America (US and Canada), Europe (Germany, France, the UK, Italy, Spain, and the RoE), Asia Pacific (Japan, China, India, Australia, South Korea, and the RoAPAC), and rest of the world.
- To profile the key players in the global microcatheters industry and comprehensively analyze their market shares and core competencies.
- To track and analyze the competitive developments undertaken in the global microcatheters market, such as product launches, agreements, expansions, and & acquisitions.
Available Customizations
With the given market data, MarketsandMarkets offers customizations as per the company’s specific needs. The following customization options are available for the present global microcatheters market report:
Product Analysis
- Product matrix, which gives a detailed comparison of the product portfolios of the top fifteen companies.
Company Information
- Detailed analysis and profiling of additional market players (up to 15)
Geographic Analysis
- Further breakdown of the Rest of Europe microcatheters industry into Russia, Belgium, the Netherlands, Switzerland, Austria, Finland, Sweden, Poland, and Portugal among other
- Further breakdown of the Rest of Asia Pacific microcatheters industry into Singapore, Taiwan, New Zealand, Philippines, Malaysia, and other APAC countries
- Further breakdown of the Rest of the world microcatheters industry into Latin America, MEA, and Africa


 Generating Response ...


Growth opportunities and latent adjacency in Microcatheters Market