Thrombectomy Devices Market by Type (Hydrodynamic, Ultrasound, Aspiration, Mechanical Thrombectomy), Application (Cardiovascular, Peripheral, Neurovascular), End User (Hospitals, Surgical Centers, Ambulatory, Academia, CROs)- Global Forecast to 2022


[174 Pages Report] The global thrombectomy devices market is estimated to reach USD 1.45 billion by 2022; growing at a CAGR of 6.7% during the forecast period.
The global thrombectomy devices market has been segmented on the basis of type, application, end user, and region. Based on application, the cardiovascular segment commanded the largest share of the global market in 2016. This large market share is mainly attributed to factors such as increasing prevalence of cardiovascular diseases across major markets, procedural benefits offered by mechanical thrombectomy in cardiac surgeries, higher prevalence of thrombotic diseases among geriatric individuals, and growing preference of surgeons for image-guided and minimally invasive cardiac surgeries.
Rising number of minimally invasive procedures, The growing target patient population, ongoing technological advancements, favorable medical reimbursements, rising demand for minimally invasive thrombectomy procedures, and increasing healthcare expenditure across emerging markets are some key factors propelling the growth of this market.
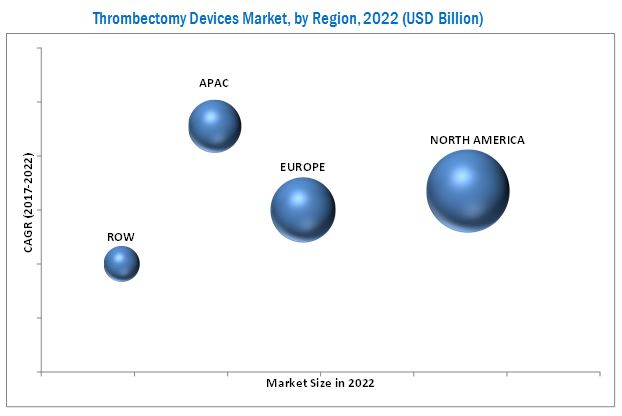
In 2016, North America held the largest share of the market. However, the developing Asia-Pacific countries including China and India are expected to emerge as the new revenue-generating regions for prominent market players during 2017-2022. The growth of this Asia-Pacific market is attributed to the presence of a large patient population for target diseases, rising awareness among surgeons related to the benefits offered by thrombectomy devices, increasing healthcare expenditure, and rising adoption of these devices due to their decreasing costs.
In 2016, Stryker Corporation (U.S.) held the leading position in the Thrombectomy Devices Market. Over the past three years, the company has adopted product launches & enhancements, strategic acquisitions, and market expansion as its key business strategies to ensure its dominance in this market. Medtronic plc (Ireland), Boston Scientific Corporation (U.S.), Johnson & Johnson (U.S.), Terumo Corporation (Japan), Penumbra, Inc. (U.S.), Spectranetics Corporation (U.S.), Edwards Lifesciences Corporation (U.S.), Argon Medical Devices, Inc. (U.S.), and Teleflex Incorporated (U.S.), were few other key players operating in the market.
Target Audience
- Healthcare service providers (hospitals and surgical centers)
- Non-government organizations
- Government regulatory authorities
- Research laboratories and academic institutes
- Clinical research organizations (CROs)
- Research and development companies
- Market research and consulting firms
Scope of the report
This research report categorizes the market into the following segments:
Thrombectomy Devices Market, by Type
- Mechanical/Fragmentation Thrombectomy Devices
- Stent Retrievers
- Basket/Brush Retrievers
- Coil Retrievers
- Aspiration Thrombectomy Devices
- Rheolytic/Hydrodynamic Thrombectomy Devices
- Ultrasonic Thrombectomy Devices
Thrombectomy Devices Market, by Application
- Cardiovascular Application
- Peripheral Vascular Application
- Neurovascular Application
Thrombectomy Devices Market, by End User
- Hospitals and Surgical Centers
- Ambulatory Surgical Centers
- Research Laboratories & Academic Institutes
- Other End Users
Thrombectomy Devices Market, by Region
-
North America
- U.S.
- Canada
-
Europe
- Germany
- France
- U.K.
- RoE
-
Asia-Pacific
- Japan
- China
- India
- RoAPAC
-
Rest of the World
- Latin America
- Middle East & Africa
Available Customizations
With the given market data, MarketsandMarkets offers customizations as per the company’s specific needs. The following customization options are available for market report:
Product Analysis
- Product Matrix, which gives a detailed comparison of the product portfolios of the top five companies
Company Information
- Detailed analysis and profiling of additional market players (Up to 5)
Growing demand of stent retrievers to drive the global thrombectomy devices market to reach USD 1.45 billion by 2022
Stent retrievers are second-generation mechanical thrombectomy products utilized for the treatment of thrombotic disorders. Stent retrieval devices comprise of a self-expanding or balloon-expanding stent attached to a Guidewire (for the accurate placement of the stent at occlusion site). The stent is inserted at the occlusion site to cover the thrombus by expanding the stent body. It is then extracted by a stent retrieval device to remove the thrombus entirely.
The stent retrievers market is projected to reach 59.0% of overall mechanical thrombectomy devices market by 2022, largely due to increasing availability of reimbursement for thrombectomy procedures, increasing public-private investments for product development & commercialization, and increasing patient emphasis on minimally invasive therapeutic procedures. Ongoing product developments by leading companies and expansion of the presence in emerging countries by the key market players through the establishment of manufacturing facilities, research & development facilities, and distribution networks are likely to propel further growth of the thrombectomy devices during the forecast period.
The implementations of localized manufacturing across emerging markets (such as China, India, and Brazil) by major market players are expected to increase the availability of thrombectomy devices at competitive prices.
Market Dynamics
Increasing availability of medical reimbursements to drive the thrombectomy devices industry across developed countries during the forecast period
Hospitals & Surgical Centres
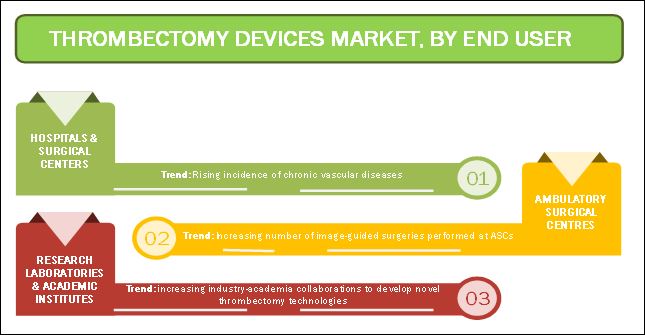
With ongoing technological advancements in the field of minimally invasive surgeries, thrombectomy systems are increasingly being utilized with diagnostic technologies for image-guided thrombectomy procedures in hospitals & surgical centres. The number of thrombectomy procedures performed in hospitals and surgical centers is growing due to increasing adoption of stent & clot retrievers for acute ischemic stroke treatment and rising incidence of chronic vascular diseases.
Hospitals & surgical centers to register the highest CAGR during the forecast period
Ambulatory Surgical Centres
Ambulatory surgical centers (ASCs) are healthcare facilities wherein selected surgical and medical services are provided outside the hospital setting. Positive demand growth of thrombectomy products in ASCs is driven by the ongoing advancements in minimally invasive surgical techniques and increasing number of image-guided surgeries performed at ASCs
Major vendors active in the market are collaborating with academic and research institutes to support their ongoing clinical programs and expand clinical applications of their existing thrombectomy systems by using advanced imaging modalities. Increasing public-private funding to support research activities in the field of thrombectomy and increasing industry-academia collaborations to develop novel thrombectomy technologies are the key factors propelling the demand for market products in research laboratories and academic institutes.
Key Questions
- What are the business growth strategies adopted by key market players to maintain their market position across key geographies?
- What is the existing developmental pipeline of major thrombectomy technologies aqmong Medtech manufacturers as well as academia?
- Growing number of minimally invasive procedures is a key trend in clinical management. What impact MIS procedures will have on thrombectomy devices market during the forecast period?
- What alternative technologies/therapies are currently being used for clot management worldwide? What competition they pose for key market players.
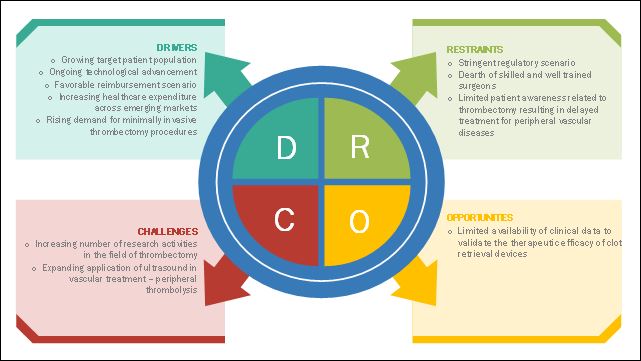
The global thrombectomy devices market is expected to reach a value of USD 1.45 Billion by 2022; growing at a CAGR of 6.7% during the forecast period. A number of factors such as growing target patient population, ongoing technological advancements, favorable medical reimbursements, rising demand for minimally invasive thrombectomy procedures, and increasing healthcare expenditure across emerging markets are driving the growth of the thrombectomy devices market. However, the stringent regulatory scenario, limited patient awareness resulting in delayed treatment for peripheral vascular diseases, and dearth of skilled & well-trained surgeons to perform thrombectomy procedures are the key challenges faced by majority of the thrombectomy devices manufacturers across the globe in the global market.
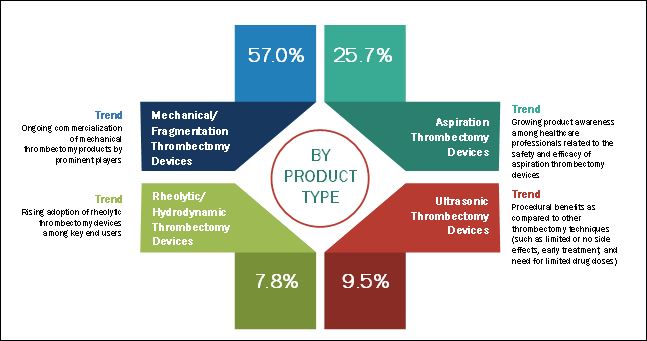
On the basis of type, the market is segmented into aspiration, mechanical/fragmentation, rheolytic/hydrodynamic, and ultrasonic thrombectomy devices. Based on type, the market is segmented into aspiration, mechanical, rheolytic, and ultrasonic thrombectomy devices. The ultrasonic thrombectomy devices segment is poised to be the fastest growing during the forecast period. The growing demand for ultrasonic thrombectomy devices can primarily be attributed to factors such as rising adoption of ultrasonic thrombectomy products by medical professionals, higher therapeutic efficacy for the treatment of deep vein thrombosis and pulmonary embolism, and its affordability.
On the basis of application, the global thrombectomy devices market is segmented into cardiovascular, peripheral vascular, and neurovascular applications. Peripheral vascular segment is expected to be the fastest growing in the market during the forecast period. This growth can be attributed to the rising availability of medical reimbursements for peripheral thrombectomy procedures across major markets, rising incidence of vascular disorders across the globe, growing geriatric population, ongoing technological advancements in the field of vascular ultrasound treatment, and rising awareness related to clinical efficacy of thrombectomy procedures in PVD treatment.
On the basis of end user, the global market is segmented into hospitals and surgical centers, ambulatory care centers, research laboratories & academic institutes, and other end users. The hospitals and surgical centers segment accounted for the largest share of the global thrombectomy devices market in 2017. The large share of this segment is attributed to the growing adoption of stent & clot retrievers for acute ischemic stroke treatment, expansion in clinical applications of ultrasonic thrombectomy for peripheral vascular treatment, rising incidence of chronic vascular diseases, and growing number of hospitals and surgical centers across emerging countries.
On the basis of region, North America accounted for the largest share of the market in 2017, while Asia-Pacific is projected to register the highest CAGR during the forecast period. Factors such as increasing adoption of technologically advanced thrombectomy products among surgeons, growing number of clinical trials, and medical reimbursements available in the U.S. for thrombectomy procedures are driving the growth of the North American thrombectomy devices market.
To speak to our analyst for a discussion on the above findings, click Speak to Analyst
 Exclusive indicates content/data unique to MarketsandMarkets and not available with any competitors.
Table of Contents
1 Introduction (Page No. - 17)
1.1 Objectives of the Study
1.2 Thrombectomy Devices Market Definition
1.3 Market Scope
1.3.1 Markets Covered
1.3.2 Geographic Scope
1.3.3 Years Considered for the Study
1.4 Currency
1.5 Limitations
1.6 Stakeholders
2 Research Methodology (Page No. - 21)
2.1 Research Data
2.1.1 Secondary Data
2.1.1.1 Key Data From Secondary Sources
2.1.2 Primary Data
2.1.2.1 Key Data From Primary Sources
2.2 Opportunity Indicators
2.2.1.1 Rising Geriatric Population
2.2.1.2 Number of Hospitals and Surgical Centers
2.2.1.3 Increased Prevalence of Cardiovascular Diseases
2.3 Thrombectomy Devices Market Size Estimation
2.3.1 Bottom-Up Approach
2.3.2 Top-Down Approach
2.4 Market Breakdown and Data Triangulation
2.5 Assumptions for the Study
3 Executive Summary (Page No. - 32)
4 Premium Insights (Page No. - 36)
4.1 Thrombectomy Devices: Market Snapshot (2017-2022)
4.2 Regional Analysis Thrombectomy Devices Market, By Application (2016)
4.3 Regional Analysis: Market Size, By Type (2017 vs 2022)
4.4 Regional Analysis: Market Size, By End User (2017 vs 2022)
4.5 Geographic Analysis: Market, By Country (2017-2022)
5 Thrombectomy Devices Market Overview (Page No. - 41)
5.1 Introduction
5.2 Market Dynamics
5.2.1 Key Thrombectomy Devices Market Drivers
5.2.1.1 Growing Target Patient Population
5.2.1.2 Ongoing Technological Advancements
5.2.1.3 Favorable Medical Reimbursement Scenario
5.2.1.4 Increasing Healthcare Expenditure Across Emerging Markets
5.2.1.5 Rising Demand for Minimally Invasive Thrombectomy Procedures
5.2.2 Key Market Restraints
5.2.2.1 Stringent Regulatory Scenario
5.2.2.2 Limited Patient Awareness Related to Thrombectomy Resulting in Delayed Treatment for Peripheral Vascular Diseases
5.2.3 Key Thrombectomy Devices Market Opportunities
5.2.3.1 Increasing Number of Research Activities in the Field of Thrombectomy
5.2.3.2 Expanding Application of Ultrasound in Vascular Treatment
5.2.4 Key Market Challenges
5.2.4.1 Limited Availability of Clinical Data to Validate the Therapeutic Efficacy of Clot Retrieval Devices
5.2.4.2 Dearth of Skilled and Well-Trained Surgeons
5.3 Research Pipeline Analysis
5.3.1 Aspiration Thrombectomy
5.3.2 Mechanical Thrombectomy
5.3.3 Rheolytic Thrombectomy
5.3.4 Ultrasonic Thrombectomy
6 Industry Insights (Page No. - 58)
6.1 Introduction
6.2 Supply Chain Analysis
6.2.1 Major Stakeholders
6.2.2 Key Influencers
6.3 Industry Trends
6.3.1 Growing Adoption of Laser-Assisted Thrombectomy
6.4 Porter’s Five Forces Analysis
6.5 Current Reimbursement Scenario in US and Germany (As of December 2016)
7 Global Thrombectomy Devices Market, By Type (Page No. - 64)
7.1 Introduction
7.2 Aspiration Thrombectomy Devices
7.3 Mechanical/Fragmentation Thrombectomy Devices
7.3.1 Stent Retrievers
7.3.2 Coil Retrievers
7.3.3 Basket/Brush Retrievers
7.4 Rheolytic/Hydrodynamic Thrombectomy Devices
7.5 Ultrasonic Thrombectomy Devices
8 Global Thrombectomy Devices Market, By Application (Page No. - 75)
8.1 Introduction
8.2 Cardiovascular Applications
8.3 Neurovascular Applications
8.4 Peripheral Vascular Applications
9 Global Thrombectomy Devices Market, By End User (Page No. - 82)
9.1 Introduction
9.2 Hospitals and Surgical Centers
9.3 Ambulatory Surgical Centers
9.4 Research Laboratories and Academic Institutes
9.5 Other End Users
10 Thrombectomy Devices Market, By Region (Page No. - 89)
10.1 Introduction
10.2 North America
10.2.1 U.S.
10.2.2 Canada
10.3 Europe
10.3.1 Germany
10.3.2 France
10.3.3 U.K.
10.3.4 Rest of Europe
10.4 Asia-Pacific
10.4.1 Japan
10.4.2 China
10.4.3 India
10.4.4 Rest of Asia-Pacific
10.5 Rest of the World
10.5.1 Latin America
10.5.2 Middle East and Africa (MEA)
11 Competitive Landscape (Page No. - 121)
11.1 Introduction
11.2 Vendor Dive Overview
11.2.1 Vanguards
11.2.2 Innovators
11.2.3 Dynamic
11.2.4 Emerging
*Top 25 Companies Analyzed for This Studies are - Stryker Corporation (U.S.), Boston Scientific Corporation (U.S.), Medtronic PLC (Ireland), Terumo Corporation (Japan), Johnson & Johnson (U.S.), Penumbra, Inc. (U.S.), Spectranetics Corporation (U.S.), Teleflex Incorporated (U.S.), Argon Medical Devices, Inc. (U.S.), Edwards Lifesciences Corporation (U.S.), Straub Medical AG (Switzerland), BTG International (U.K.), Phenox GmbH (Germany), Acandis GmbH Co. & Kg (Germany), Merit Medical Systems, Inc. (U.S.), Minnetronix, Inc. (U.S.) Nexgen Medical Systems, Inc. (U.S.), Capture Vascular (U.S.), Applied Medical (U.S.), Claret Medical (U.S.), Lemaitre Vascular (U.S.), Stentys (France), Dispomedical GmbH( Germany), Control Medical Tecyhnology (U.S.), and Natec Medical Ltd (Mauritius)
12 Company Profiles (Page No. - 125)
(Introduction, Products & Services, Strategy, & Analyst Insights, Developments, MnM View)*
12.1 Introduction
12.1.1 Geographic Benchmarking
12.2 Top Market Players
12.2.1 Stryker Corporation
12.2.2 Medtronic PLC
12.2.3 Johnson & Johnson
12.2.4 Terumo Corporation
12.2.5 Boston Scientific Corporation
12.2.6 Spectranetics Corporation
12.2.7 Penumbra, Inc.
12.2.8 Argon Medical Devices, Inc.
12.2.9 Edwards Lifesciences Corporation
12.2.10 Teleflex Incorporated
12.3 Emerging Players
12.3.1 Straub Medical AG
12.3.2 BTG International Ltd.
12.3.3 Phenox GmbH
12.3.4 Acandis GmbH & Co. Kg
*Details on Marketsandmarkets View, Introduction, Product & Services, Strategy, & Analyst Insights, New Developments Might Not Be Captured in Case of Unlisted Companies.
13 Appendix (Page No. - 164)
13.1 Primary Insights
13.2 Discussion Guide
13.3 Knowledge Store: Marketsandmarkets’ Subscription Portal
13.4 Introducing RT: Real-Time Market Intelligence
13.5 Available Customizations
13.6 Related Reports
13.7 Author Details
List of Tables (67 Tables)
Table 1 Aspiration Thrombectomy Catheters: Ongoing Clinical Trials (As of December 2016)
Table 2 Clot Retrievers: Ongoing Clinical Trials (As of December 2016)
Table 3 Stent Retrievers: Ongoing Clinical Trials (As of December 2016)
Table 4 Rheolytic Thrombectomy Devices: Ongoing Clinical Trials (As of December 2016)
Table 5 Ultrasonic Thrombectomy Devices: Ongoing Clinical Trials (As of December 2016)
Table 6 Medical Reimbursements for Thrombectomy Procedures (As of December 2016)
Table 7 Global Thrombectomy Devices Market Size, By Type, 2015–2022 (USD Million)
Table 8 Aspiration Market Size, By Region, 2015–2022 (USD Million)
Table 9 Mechanical/Fragmentation Thrombectomy Devices Market Size, By Product, 2015–2022 (USD Million)
Table 10 Mechanical/Fragmentation Market Size, By Region, 2015–2022 (USD Million)
Table 11 Stent Retrievers Market Size, By Region, 2015–2022 (USD Million)
Table 12 Coil Retrievers Market Size, By Region, 2015–2022 (USD Million)
Table 13 Basket/Brush Retrievers Market Size, By Region, 2015–2022 (USD Million)
Table 14 Rheolytic/Hydrodynamic Thrombectomy Devices Market Size,
Table 15 Ultrasonic Market Size, By Region, 2015–2022 (USD Million)
Table 16 Global Thrombectomy Devices Market Size, By Application, 2015–2022 (USD Million)
Table 17 Market Size, By Region, 2015–2022 (USD Million)
Table 18 Thrombectomy Devices Market Size for Cardiovascular Applications, By Region, 2015–2022 (USD Million)
Table 19 Market Size for Neurovascular Applications, By Region, 2015-2022 (USD Million)
Table 20 Thrombectomy Devices Market Size for Peripheral Vascular, By Region, 2015-2022 (USD Million)
Table 21 Thrombectomy Devices Market Size, By End User, 2015–2022 (USD Million)
Table 22 Market Size, By Region, 2015–2022 (USD Million)
Table 23 Thrombectomy Devices Market Size for Hospitals and Surgical Centers, By Region, 2015–2022 (USD Million)
Table 24 Market Size for Ambulatory Surgical Centers, By Region, 2015–2022 (USD Million)
Table 25 Thrombectomy Devices Market Size for Research Laboratories and Academic Institutes, By Region, 2015–2022 (USD Million)
Table 26 Market Size for Other End Users, By Region, 2015–2022 (USD Million)
Table 27 Market Size, By Region, 2015–2022 (USD Million)
Table 28 North America: Thrombectomy Devices Market Size, By Country, 2015–2022 (USD Million)
Table 29 North America: Market Size, By Type, 2015–2022 (USD Million)
Table 30 North America: Market Size, By End User, 2015–2022 (USD Million)
Table 31 North America: Market Size, By Application, 2015–2022 (USD Million)
Table 32 U.S.: Thrombectomy Devices Market Size, By Type, 2015–2022 (USD Million)
Table 33 U.S.: Market Size, By Application, 2015–2022 (USD Million)
Table 34 Canada: Market Size, By Type, 2015–2022 (USD Million)
Table 35 Canada: Market Size, By Application, 2015–2022 (USD Million)
Table 36 Europe: Thrombectomy Devices Market Size, By Country, 2015–2022 (USD Million)
Table 37 Europe: Market Size, By Type, 2015–2022 (USD Million)
Table 38 Europe: Market Size, By End User, 2015–2022 (USD Million)
Table 39 Europe: Market Size, By Application, 2015–2022 (USD Million)
Table 40 Germany: Market Size, By Type, 2015–2022 (USD Million)
Table 41 Germany: Market Size, By Application, 2015–2022 (USD Million)
Table 42 France: Thrombectomy DevicesMarket Size, By Type, 2015–2022 (USD Million)
Table 43 France: Thrombectomy Devices Market Size, By Application, 2015–2022 (USD Million)
Table 44 U.K.: Market Size, By Type, 2015–2022 (USD Million)
Table 45 U.K.: Market Size, By Application, 2015–2022 (USD Million)
Table 46 RoE: Market Size, By Type, 2015–2022 (USD Million)
Table 47 RoE: Market Size, By Application, 2015–2022 (USD Million)
Table 48 Asia-Pacific: Market Size, By Country, 2015–2022 (USD Million)
Table 49 Asia-Pacific: Market Size, By Type, 2015–2022 (USD Million)
Table 50 Asia-Pacific: Thrombectomy Devices Market Size, By End User, 2015–2022 (USD Million)
Table 51 Asia-Pacific: Market Size, By Application, 2015–2022 (USD Million)
Table 52 Japan: Market Size, By Type, 2015–2022 (USD Million)
Table 53 Japan: Thrombectomy Devices Market Size, By Application, 2015–2022 (USD Million)
Table 54 China: Market Size, By Type, 2015–2022 (USD Million)
Table 55 China: Market Size, By Application, 2015–2022 (USD Million)
Table 56 India: Market Size, By Type, 2015–2022 (USD Million)
Table 57 India: Thrombectomy Devices Market Size, By Application, 2015–2022 (USD Million)
Table 58 RoAPAC: Market Size, By Type, 2015–2022 (USD Million)
Table 59 RoAPAC: Market Size, By Application, 2015–2022 (USD Million)
Table 60 RoW: Market Size, By Country, 2015–2022 (USD Million)
Table 61 RoW: Thrombectomy Devices Market Size, By Type, 2015–2022 (USD Million)
Table 62 RoW: Market Size, By End User, 2015–2022 (USD Million)
Table 63 RoW: Market Size, By Application, 2015–2022 (USD Million)
Table 64 Latin America: Thrombectomy Devices Market Size, By Type, 2015–2022 (USD Million)
Table 65 Latin America: Market Size, By Application, 2015–2022 (USD Million)
Table 66 Middle East & Africa: Market Size, By Type, 2015–2022 (USD Million)
Table 67 Middle East & Africa: Market Size, By Application, 2015–2022 (USD Million)
List of Figures (75 Figures)
Figure 1 Research Design
Figure 2 Breakdown of Primaries
Figure 3 Increase in Geriatric Population: By Country (2010 vs 2015)
Figure 4 Increase in the Proportion of Geriatric Individuals in the Overall Population: By Country (2011 vs 2015 vs 2030)
Figure 5 Percentage Increase in Geriatric Population, By Region (1980-2010 vs 2010–2040)
Figure 6 Bottom-Up Approach
Figure 7 Top-Down Approach
Figure 8 Data Triangulation
Figure 9 Global Market Size, By Type, 2017 vs 2022
Figure 10 Global Thrombectomy Devices Market Size, By Application, 2017 vs 2022
Figure 11 Global Market Size, By End User, 2017 vs 2022
Figure 12 Geographic Snapshot of the Global Thrombectomy Devices Market
Figure 13 Growing Target Patient Population to Propel the Demand for Thrombectomy Devices During the Forecast Period
Figure 14 North America Dominated the Market for All Application Segments in 2016
Figure 15 Mechanical Thrombectomy Devices Segment Will Continue to Dominate the Thrombectomy Devices Market Across All Regions in 2022
Figure 16 Hospitals & Surgical Centers Will Dominate the Thrombectomy Devices Market Across All Regions in 2017
Figure 17 China & India Estimated to Be the Fastest-Growing Countries in the Global Market
Figure 18 Market: Drivers, Restraints, Opportunities, and Challenges
Figure 19 Proportion of Geriatric Population to Total Population, By Country, (2012 vs 2020)
Figure 20 Government Healthcare Expenditure: Developed vs Developing Countries (2010–2015)
Figure 21 Ongoing Clinical Trials Across the Globe (As of December 2016)
Figure 22 Supply Chain Analysis: Thrombectomy Devices Industry
Figure 23 Porter’s Five Forces Analysis (2016)
Figure 24 Mechanical Thrombectomy Devices Segment to Witness Highest Market Growth During the Forecast Period
Figure 25 Stent Retrievers Segment to Dominate the Mechanical Thrombectomy Devices Market During the Forecast Period
Figure 26 North America to Hold Largest Share of the Ultrasonic Market During the Forecast Period
Figure 27 Cardiovascular Applications to Dominate the Thrombectomy Devices Market During the Forecast Period
Figure 28 North America to Hold Largest Share of the Peripheral Vascular Application Market During the Forecast Period
Figure 29 Hospitals & Surgical Centers to Register the Highest CAGR During the Forecast Period
Figure 30 North America: Market Snapshot
Figure 31 Europe: Market Snapshot
Figure 32 Asia-Pacific: Market Snapshot
Figure 33 RoW: Market Snapshot
Figure 34 MnM Dive – Vendor Comparison Matrix : Market
Figure 35 Analysis of Product Portfolio of Major Players in the Thrombectomy Devices Market (25 Players)
Figure 36 Business Strategy Adopted By Major Players in the Market (25 Players)
Figure 37 Geographic Revenue Mix of the Top Four Market Players (As of 2016)
Figure 38 Stryker Corporation: Company Snapshot (2016)
Figure 39 Stryker Corporation: Product Offering Scorecard
Figure 40 Stryker Corporation: Business Strategy Scorecard
Figure 41 Medtronic PLC: Company Snapshot (2016)
Figure 42 Medtronic PLC: Product Offering Scorecard
Figure 43 Medtronic PLC: Business Strategy Scorecard
Figure 44 Johnson & Johnson: Company Snapshot (2015)
Figure 45 Johnson & Johnson: Product Offering Scorecard
Figure 46 Johnson & Johnson: Business Strategy Scorecard
Figure 47 Terumo Corporation: Company Snapshot (2015)
Figure 48 Terumo Corporation: Product Offering Scorecard
Figure 49 Terumo Corporation: Business Strategy Scorecard
Figure 50 Boston Scientific Corporation: Company Snapshot (2016)
Figure 51 Boston Scientific Corporation: Product Offering Scorecard
Figure 52 Boston Scientific Corporation: Business Strategy Scorecard
Figure 53 Spectranetics Corporation: Company Snapshot (2016)
Figure 54 Spectranetics Corporation: Product Offering Scorecard
Figure 55 Spectranetics Corporation: Business Strategy Scorecard
Figure 56 Penumbra, Inc.: Company Snapshot (2016)
Figure 57 Penumbra, Inc.: Product Offering Scorecard
Figure 58 Penumbra, Inc.: Business Strategy Scorecard
Figure 59 Argon Medical Devices, Inc.: Product Offering Scorecard
Figure 60 Argon Medical Devices, Inc.: Business Strategy Scorecard
Figure 61 Edwards Lifesciences Corporation: Company Snapshot (2016)
Figure 62 Edwards Lifesciences Corporation: Product Offering Scorecard
Figure 63 Edwards Lifesciences Corporation: Business Strategy Scorecard
Figure 64 Teleflex Incorporated: Company Snapshot (2016)
Figure 65 Teleflex Incorporated: Product Offering Scorecard
Figure 66 Teleflex Incorporated: Business Strategy Scorecard
Figure 67 Straub Medical AG: Product Offering Scorecard
Figure 68 Straub Medical AG: Business Strategy Scorecard
Figure 69 BTG International Ltd.: Company Snapshot (2016)
Figure 70 BTG International Ltd.: Product Offering Scorecard
Figure 71 BTG International Ltd.: Business Strategy Scorecard
Figure 72 Phenox GmbH: Product Offering Scorecard
Figure 73 Phenox GmbH: Business Strategy Scorecard
Figure 74 Acandis GmbH: Product Offering Scorecard
Figure 75 Acandis GmbH: Business Strategy Scorecard

 Generating Response ...


Growth opportunities and latent adjacency in Thrombectomy Devices Market