Automotive HUD Market

Automotive HUD Market by Technology (2D HUD, AR HUD, 3D HUD), HUD Type (Combiner, Windshield), Offering (Hardware, Software), Vehicle Class, Level of Autonomy, Vehicle Type, Propulsion Type, EV Type and Region - Global Forecast to 2030

Report Code: AT 2973 May, 2024, by marketsandmarkets.com

[289 Pages Report] The global automotive HUD market size is projected to grow from USD 1.2 billion in 2024 to USD 2.4 billion by 2030, at a CAGR of 12.3%. With the increase in awareness of the safety of vehicles and passengers Demand for better In-vehicle experience, growing preference towards connected vehicles steady increase in the market for premium and luxury vehicles, primarily in emerging markets are expected to increase the demand for automotive HUD solutions all over the world. Moreover, increasing adoption of electric vehicles along with growing demand for semi-autonomous vehicles are also expected to create lucrative opportunities for the automotive HUD market in the coming years globally.

Automotive HUD Market

To know about the assumptions considered for the study, Request for Free Sample Report

Automotive HUD Market Opportunities

To know about the assumptions considered for the study, download the pdf brochure

Automotive HUD Market Dynamics:

Driver: Steady growth in demand for luxury and high-end segment cars, mainly in emerging markets

The revenue growth of the automotive HUD market is expected to be supported by the consistent growth in demand for luxury vehicles during the forecast period. Automotive HUD technology was first introduced by luxury cars. Luxury car manufacturers have integrated HUDs into their top-of-the-line models after realizing how valuable they are for enhancing the driving experience. For example, automotive HUDs are available for the Audi Q4 e-tron, BMW iX, BMW iX3 (RR), and Mercedes-Benz EQE. Furthermore, cutting-edge features and technologies are frequently introduced into luxury cars. As a result, technological developments in car HUDs for luxury vehicles have continued. Wider viewing angles, enhanced display clarity, augmented reality capabilities, and interaction with other cutting-edge systems like adaptive cruise control and night vision are some of these innovations. All these aforementioned parameters are expected to support the growth of the market.

Restraint: Requirement for greater space in automotive cockpits

The automotive industry is undergoing a significant shift toward creating more spacious vehicle cockpits, driven by several factors. This shift includes integrating advanced technologies such as larger displays, augmented reality (AR) HUDs, and sophisticated driver assistance systems (ADAS), all of which require additional space to prevent cockpit overcrowding. Concurrently, manufacturers are focusing on improving overall comfort and convenience, leading to enhancements in seating arrangements and legroom. There is a noticeable trend driven by consumer preferences for personalized interiors, resulting in more spacious cockpits that can be customized according to individual tastes. The windshield-projected HUD demands substantial space in the cockpit. Advanced HUDs, such as AR HUDs, enhance driving comfort and safety by overlaying the exterior view of traffic conditions with virtual information for the driver. This reflected information appears to be part of the driving situation itself. Additionally, companies are developing next-generation HUD technology and researching related areas like Holographic Optical Elements (HOE) and optical waveguides, which require significant dashboard space and necessitate cockpit redesigns by OEMs. For example, the initial AR HUD model developed by Continental AG (Germany) requires 10 liters of cockpit space, presenting a challenge for OEMs to incorporate.

Opportunity: Increasing demand for semi-autonomous vehicles

The increased level of autonomy in cars presents a significant opportunity for developing and adopting automotive heads-up displays (HUDs). With higher levels of autonomy, HUDs can enhance safety and awareness by providing real-time contextual information, such as speed, navigation directions, and proximity warnings, directly in the driver’s line of sight. Advanced HUDs with augmented reality (AR) capabilities can highlight potential hazards and optimal driving paths, thereby improving situational awareness. HUDs also provide real-time feedback and alerts, enhancing the driver’s ability to respond to dynamic driving conditions. Thus, the upcoming shift of reducing non-autonomous vehicle market share to semi-autonomous vehicles will create new opportunities for the automotive HUD market. Such parameters are expected to augment revenue for the market during the forecast period.

Challenge: Optical Challenges in head-up disp lay systems

Automotive HUD systems encounter several difficulties, including glare, distortion, visibility in bad weather, readability in sunshine, and integration with augmented reality. Glare reflects information off the windshield, which can reduce visibility. Glare is especially common in strong sunshine. Reducing glare requires careful optic design and may involve anti-glare coatings. Image clarity is compromised by distortion, which results from optical aberrations or misalignment within the HUD system. Advanced optical design and calibration procedures are essential to reduce distortion. Unfavorable meteorological conditions like rain, fog, or snow make visibility problems worse by distorting light or producing a diffused background that makes it difficult to read. To overcome these obstacles, developing HUD systems with improved contrast and brightness capabilities is necessary. Sunlight readability is crucial for driver safety and convenience, making high-brightness display technology and HUD optic optimization crucial.

Automotive HUD Market Ecosystem

The ecosystem analysis highlights various players in the automotive HUD ecosystem, which OEMs, HUD providers, HUD suppliers, and software providers primarily represent. Prominent companies in this market include Continental AG (Germany), Foryou Corporation (China), DENSO Corporation (Japan), Yazaki Corporation (Japan), Panasonic Holdings Corporation (Japan), and Nippon Seiki Co., Ltd. (Japan), among others.

Top Companies in Automotive HUD Market


Passenger car segment is projected to witness significant growth rate in the global automotive HUD market during the forecast period.

The passenger cars segment is expected to dominate the automotive HUD market during the forecast period. This is due to the widespread adoption of cutting-edge technologies continues to be high for passenger cars due to the higher production and sales of passenger cars worldwide compared to commercial vehicles. For example, the most recent Passenger HUDS (P-HUDs) have transformed vehicle HUD technologies by seamlessly integrating external traffic views with augmented visuals. One of its primary objectives is to improve driving and facilitate objective passenger interactions. OEMs face the need to include these elements in their cars as a result of consumers' growing demand for luxury and convenience amenities.

Leading manufacturers such as Audi AG (Germany), Geely (China), BMW AG (Germany), Great Wall Motor (China), NIO (China), and Hongqi (China) have increasingly integrated HUDs into their vehicles. Companies such as Nippon Seiki Co., Ltd (Japan), Continental AG (Germany), Foryou Corporation (China) Yazaki Corporation (Japan), Panasonic Holdings Corporation (Japan), and WayRay AG (Switzerland), among others, offer automotive HUDs for passenger cars.

By propulsion type, ICE vehicles segment is expected to be the largest in automotive HUD market during the forecast period.

Modern ICE vehicles are equipped with many connected features in addition to ADAS technology. Automotive HUDs can be easily integrated with advanced driver assistance systems (ADAS) used in internal combustion engine (ICE) automobiles. Critical information like as lane departure alerts, adaptive cruise control information, and collision warnings are then sent to the driver or owner of the car. Buyers of internal combustion engine (ICE) vehicles may find HUDs appealing due to their ability to improve overall safety when combined with driver assistance technologies. These elements are expected to support the automotive HUD market's ICE cars segment during the forecast period. Because of the increased demand for passenger cars, the Asia Pacific region is anticipated to hold the highest share in this market.

AR HUD segment is expected to have significant growth opportunities in automotive HUD market during the forecast period.

AR HUD segment is expected to be driven by technological improvements and growing consumer desire for better safety features. Road accidents can occur when a driver is distracted by various in-car displays. Vehicle distraction can be decreased, and driving safety can be increased using AR HUD systems. AR HUDs, for example, can be used to enhance driving experience by highlighting impediments on the displayed image and pointing to nearby roadways during guidance routing. Advancements in AR-based HUD technology are expected to create significant revenue opportunities for HUD manufacturers. These AR HUDs are more interactive and capable of projecting complex graphics that align with real-world objects. By overlaying AR graphics onto real-world scenes, drivers can quickly identify and respond to threats, such as braking for obstacles on the road. These innovations are expected to drive demand for AR HUDs in the premium vehicle segment during the forecast period.

“The Asia Pacific automotive HUD market is projected to hold the largest share by 2030.”

Asia Pacific is estimated to be the largest market for automotive HUDs by 2030. In this region, leading countries such as China, Japan, India, and South Korea are expected to develop autonomous driving technology in the coming years. Leading OEMs in this region, such as Toyota, Honda, and Hyundai, have utilized the advantages of in-vehicle experiences and safety systems features as a standard across their models. China is expected to be the most significant factor in the Asia Pacific automotive HUD market growth in terms of value & volume. China leads the region in terms of value and volume for market, which can also be attributed to the increased demand for EVs and increased sales of vehicles equipped with HUD technology. For example, BYD Song L, Changan Raeton PLUS, Changan CS75, and Haval H6 are some of the models in China equipped with automotive HUDs.

Asia Pacific Automotive HUD Market Size, and Share

Key Market Players

The global automotive HUD market is dominated by major players such as Nippon Seiki Co. Ltd. (Japan), Continental AG (Germany), DENSO Corporation (Japan), Panasonic Holdings Corporation (Japan), Foryou Corporation (China), Yazaki Corporation (Japan), and Valeo (France), and among others. These companies have strengthened distribution networks at a global level and offer a wide range of HUD products such as combiner HUDs, and windshield HUDs. The key strategies adopted by these companies to sustain their market position are collaborations, new product developments, acquisitions, etc.

Get online access to the report on the World's First Market Intelligence Cloud

  • Easy to Download Historical Data & Forecast Numbers
  • Company Analysis Dashboard for high growth potential opportunities
  • Research Analyst Access for customization & queries
  • Competitor Analysis with Interactive dashboard
  • Latest News, Updates & Trend analysis
Request Sample

Scope of the Report

Report Metric

Details

Market size available for years

2020–2030

Base year considered

2023

Forecast period

2024-2030

Forecast units

Volume (Thousand Units) & Value (USD Million)

Segments Covered

HUD Type, Technology, Level of Autonomy, Offering, Vehicle Type, Propulsion Type, EV Type, Vehicle Class, and Region

Geographies covered

Asia Pacific, North America, and Europe.

Companies Covered

Nippon Seiki Co. Ltd. (Japan), Continental AG (Germany), DENSO Corporation (Japan), Panasonic Holdings Corporation (Japan), Foryou Corporation (China), Yazaki Corporation (Japan), and Valeo (France).
More than 20 major players are covered under the report.

This research report categorizes the automotive HUD market based on HUD type, technology, vehicle class, vehicle type, EV type, propulsion type, level of autonomy, offering, and region.

Automotive HUD Market, By Technology

  • AR HUD
  • 3D HUD
  • 2D HUD

Automotive HUD Market, By HUD Type

  • Combiner HUD
  • Windshield HUD

Automotive HUD Market, By Vehicle Class

  • Economy Car
  • Mid-segment Car
  • Luxury Car

Automotive HUD Market, By Vehicle Type

  • Passenger Car
  • Commercial Vehicle

Automotive HUD Market, By Electric Vehicle Type

  • BEVs
  • PHEVs
  • HEVs
  • FCEVs

Automotive HUD Market, By Propulsion Type

  • ICE Vehicles
  • Electric Vehicles

Automotive HUD Market, By Level of Autonomy

  • Non-autonomous car
  • Semi-autonomous car
  • Autonomous car

Automotive HUD Market, By Offering

  • Software
  • Hardware

Automotive HUD Market, By Region

  • North America
    • US
    • Canada
    • Mexico
  • Europe
    • France
    • Germany
    • UK
    • Spain
    • Italy
  • Asia Pacific
    • China
    • Japan
    • India
    • South Korea

Recent Developments

  • In March 2024, Panasonic Holdings Corporation and Mazda Motor Corporation partnered and installed full-display meters for the CX-70 model of Mazda Motor Corporation. The CX-70 integrates a large 12.3-inch display, showcasing graphics of the vehicle conditions, such as speed and warnings. It adapts in real-time to offer drivers timely and pertinent information, enhancing their safety and driving experience.
  • In February 2024, Nippon Seiki Co., Ltd. and FPT Software partnered to develop automotive HUD platforms and applications for automobiles and motorcycles.
  • In July 2023, Panasonic Automotive Systems Co., Ltd., Holding of Panasonic Holdings Corporation, announced that its intelligent room mirror (electronic mirror), linked with a drive recorder and HUD, has been adopted for the new Nissan Serena e-Power. The HUD linked with the mirror uses a 2-megapixel camera, a high-resolution display, and proprietary image processing technology to achieve high-definition images and improved nighttime visibility.
  • In June 2023, Continental AG introduced its Smart Cockpit High-performance Computer (HPC), which offers ideally adapted system performance for a pre-integrated set of functions in vehicles. This Smart Cockpit HPC integrates various domains and functions, such as cluster, infotainment with an interface to an Android Operating System, and Advanced Driver-Assistance Systems (ADAS), in one box. This system is designed for the typical configuration of two displays for the center stack and the instrument cluster and can be expanded to include up to three displays, such as a head-up display.
  • In January 2023, N.S. Computer Service Co., Ltd., a subsidiary of Nippon Seiki Co., Ltd with Akita City, Akita Prefecture, to open Akita Development Center, a new software development center to strengthen its software development system for advanced driver assistance systems (ADAS) and other applications. This center develops software for automotive electric control units (ECUs) used in meters, HUDs, and drive system parts.

Frequently Asked Questions (FAQ):

To speak to our analyst for a discussion on the above findings, click Speak to Analyst

TABLE OF CONTENTS
 
1 INTRODUCTION (Page No. - 26)
    1.1 STUDY OBJECTIVES 
    1.2 MARKET DEFINITION 
    1.3 MARKET SCOPE 
           1.3.1 MARKETS COVERED
           1.3.2 REGIONS COVERED
           1.3.3 YEARS CONSIDERED
    1.4 INCLUSIONS AND EXCLUSIONS 
    1.5 CURRENCY CONSIDERED 
    1.6 STAKEHOLDERS 
    1.7 SUMMARY OF CHANGES 
 
2 RESEARCH METHODOLOGY (Page No. - 36)
    2.1 RESEARCH DATA 
           2.1.1 SECONDARY DATA
                    2.1.1.1 Secondary sources
                    2.1.1.2 Key data from secondary sources
           2.1.2 PRIMARY DATA
                    2.1.2.1 Primary interview participants
                    2.1.2.2 Key industry insights
                    2.1.2.3 Breakdown of primary interviews
                    2.1.2.4 List of primary participants
    2.2 MARKET SIZE ESTIMATION 
           2.2.1 RECESSION IMPACT ANALYSIS
           2.2.2 BOTTOM-UP APPROACH
           2.2.3 TOP-DOWN APPROACH
    2.3 DATA TRIANGULATION 
    2.4 FACTOR ANALYSIS 
    2.5 RESEARCH ASSUMPTIONS 
    2.6 RESEARCH LIMITATIONS 
    2.7 RISK ASSESSMENT 
 
3 EXECUTIVE SUMMARY (Page No. - 53)
 
4 PREMIUM INSIGHTS (Page No. - 58)
    4.1 ATTRACTIVE OPPORTUNITIES FOR PLAYERS IN AUTOMOTIVE HUD MARKET 
    4.2 AUTOMOTIVE HUD MARKET, BY REGION 
    4.3 AUTOMOTIVE HUD MARKET, BY HUD TYPE 
    4.4 AUTOMOTIVE HUD MARKET, BY TECHNOLOGY 
    4.5 AUTOMOTIVE HUD MARKET, BY ELECTRIC VEHICLE TYPE 
    4.6 AUTOMOTIVE HUD MARKET, BY VEHICLE TYPE 
    4.7 AUTOMOTIVE HUD MARKET, BY LEVEL OF AUTONOMY 
    4.8 AUTOMOTIVE HUD MARKET, BY PROPULSION TYPE 
    4.9 AUTOMOTIVE HUD MARKET, BY VEHICLE CLASS 
    4.1 AUTOMOTIVE HUD MARKET, BY OFFERING 
 
5 MARKET OVERVIEW (Page No. - 64)
    5.1 INTRODUCTION 
    5.2 MARKET DYNAMICS 
           5.2.1 DRIVERS
                    5.2.1.1 Increasing awareness about passenger and vehicle safety
                    5.2.1.2 Growing inclination toward enhanced in-vehicle experience
                    5.2.1.3 Booming demand for connected vehicles
                    5.2.1.4 Surge in demand for luxury and high-end cars
           5.2.2 RESTRAINTS
                    5.2.2.1 Space constraints in automotive cockpits
                    5.2.2.2 Lack of luminance and high-power consumption
           5.2.3 OPPORTUNITIES
                    5.2.3.1 Increasing adoption of self-driving technology
                    5.2.3.2 Growing utilization of head-up displays in electric vehicles
                    5.2.3.3 Thriving investments in automotive head-up displays
           5.2.4 CHALLENGES
                    5.2.4.1 Optical challenges
                    5.2.4.2 Complex integration process
    5.3 TRENDS AND DISRUPTIONS IMPACTING CUSTOMER BUSINESS 
    5.4 KEY OEM HEAD-UP DISPLAY OFFERINGS, BY HUD TYPE 
    5.5 AR HUD PROVIDERS, BY SHARE OF SUPPLY CONTRACTS 
    5.6 AUTOMOTIVE HUD MARKET: WHO SUPPLIES WHOM 
    5.7 PRICING ANALYSIS 
           5.7.1 AVERAGE SELLING PRICE TREND, BY TECHNOLOGY
           5.7.2 AVERAGE SELLING PRICE TREND OF COMBINER HUD, BY KEY PLAYERS IN AFTERMARKET
           5.7.3 AVERAGE SELLING PRICE TREND, BY REGION
    5.8 ECOSYSTEM ANALYSIS 
           5.8.1 OEMS
           5.8.2 HUD PROVIDERS
           5.8.3 HUD COMPONENT PROVIDERS
           5.8.4 HUD SOFTWARE PROVIDERS
    5.9 SUPPLY CHAIN ANALYSIS 
    5.1 BILL OF MATERIALS 
    5.11 CASE STUDY ANALYSIS 
           5.11.1 DEVELOPMENT OF EFFECTIVE THERMAL SOLUTION FOR AUTOMOTIVE HEAD-UP DISPLAYS
           5.11.2 IMPROVED DATA MONITORING CAPABILITIES WITH HUD DEMONSTRATOR
           5.11.3 ENHANCED PERFORMANCE AND DELIVERY TIME WITH HUDSON TEST SYSTEM
           5.11.4 DRIVERLESS AUTOMATED VALET PARKING SYSTEM AND AR-HUD TECHNOLOGY FOR AUTOMOTIVE SAFETY AND COMFORT
           5.11.5 BETTER HUD VISUAL QUALITY USING PROMETRIC IMAGING SYSTEMS AND TT-HUD SOFTWARE PLATFORM
    5.12 PATENT ANALYSIS 
           5.12.1 INTRODUCTION
           5.12.2 LEGAL STATUS OF PATENTS
           5.12.3 HS CODE
                    5.12.3.1 Import/Export Scenario (HS Code 870390)
    5.13 KEY STAKEHOLDERS AND BUYING CRITERIA 
           5.13.1 KEY STAKEHOLDERS IN BUYING PROCESS
           5.13.2 BUYING CRITERIA
    5.14 TECHNOLOGY ANALYSIS 
           5.14.1 INTRODUCTION
           5.14.2 KEY TECHNOLOGIES
                    5.14.2.1 3D HUD
                    5.14.2.2 3D AR HUD
           5.14.3 COMPLEMENTARY TECHNOLOGIES
                    5.14.3.1 Advanced sensors
                               5.14.3.1.1 Radar
                               5.14.3.1.2 LiDAR
                               5.14.3.1.3 Image sensors
                    5.14.3.2 Light-emitting diode technology
                    5.14.3.3 Laser beam scanning
                    5.14.3.4 Biometric driver monitoring
           5.14.4 ADJACENT TECHNOLOGIES
                    5.14.4.1 Connected vehicles
                    5.14.4.2 Advanced driver-assistance system
           5.14.5 UPCOMING TECHNOLOGICAL TRENDS
    5.15 EMERGING TRENDS 
           5.15.1 MOTORCYCLE WINDSHIELD HUDS
           5.15.2 MOTORCYCLE HELMET HUDS
           5.15.3 AR HUDS
    5.16 TARIFF AND REGULATORY LANDSCAPE 
           5.16.1 REGULATORY BODIES, GOVERNMENT AGENCIES, AND OTHER ORGANIZATIONS
    5.17 KEY CONFERENCES AND EVENTS 
    5.18 INVESTMENT AND FUNDING SCENARIO 
 
6 AUTOMOTIVE HUD MARKET, BY HUD TYPE (Page No. - 121)
    6.1 INTRODUCTION 
           6.1.1 OPERATIONAL DATA
    6.2 WINDSHIELD HUD 
           6.2.1 INCREASED CONSUMER WILLINGNESS TO PAY FOR SAFETY FUNCTIONS TO DRIVE MARKET
    6.3 COMBINER HUD 
           6.3.1 GROWING AFTERMARKET INSTALLATION TO DRIVE MARKET
    6.4 KEY INDUSTRY INSIGHTS 
 
7 AUTOMOTIVE HUD MARKET, BY TECHNOLOGY (Page No. - 128)
    7.1 INTRODUCTION 
           7.1.1 OPERATIONAL DATA
    7.2 2D HUD 
           7.2.1 INCREASING FOCUS ON CAR SAFETY TO DRIVE MARKET
    7.3 AR HUD 
           7.3.1 RISING ADOPTION OF ADAS TECHNOLOGY TO DRIVE MARKET
    7.4 3D HUD 
           7.4.1 NEED TO REDUCE ACCIDENT RATES TO DRIVE MARKET
    7.5 KEY INDUSTRY INSIGHTS 
 
8 AUTOMOTIVE HUD MARKET, BY VEHICLE CLASS (Page No. - 140)
    8.1 INTRODUCTION 
    8.2 ECONOMY CAR 
           8.2.1 INCREASING ADOPTION OF ADAS AND CONNECTED FEATURES TO DRIVE MARKET
    8.3 MID-SEGMENT CAR 
           8.3.1 GROWING REQUIREMENT FOR COMPACT SPACE AND LIMITED COLOR DEFINITION TO DRIVE MARKET
    8.4 LUXURY CAR 
           8.4.1 RISING DEMAND FOR ADVANCED SAFETY AND IN-VEHICLE FEATURES TO DRIVE MARKET
    8.5 KEY INDUSTRY INSIGHTS 
 
9 AUTOMOTIVE HUD MARKET, BY VEHICLE TYPE (Page No. - 148)
    9.1 INTRODUCTION 
    9.2 PASSENGER CAR 
           9.2.1 BOOMING SALES OF HUD-EQUIPPED PASSENGER CARS TO DRIVE MARKET
    9.3 COMMERCIAL VEHICLE 
           9.3.1 EXPANDING E-COMMERCE AND LAST-MILE DELIVERY SERVICES TO DRIVE MARKET
    9.4 KEY INDUSTRY INSIGHTS 
 
10 AUTOMOTIVE HUD MARKET, BY ELECTRIC VEHICLE TYPE (Page No. - 156)
     10.1 INTRODUCTION 
             10.1.1 OPERATIONAL DATA
     10.2 BATTERY ELECTRIC VEHICLE 
             10.2.1 GROWING FOCUS ON ADVANCED BATTERY TECHNOLOGY TO DRIVE MARKET
     10.3 FUEL CELL ELECTRIC VEHICLE 
             10.3.1 INCREASING DEMAND FOR HYDROGEN PROPULSION TO DRIVE MARKET
     10.4 HYBRID ELECTRIC VEHICLE 
             10.4.1 ENHANCED ENERGY-SAVING CAPABILITIES TO DRIVE MARKET
     10.5 PLUG-IN HYBRID ELECTRIC VEHICLE 
             10.5.1 INCREASING NEED FOR LONGER ELECTRIC RANGE TO DRIVE MARKET
     10.6 KEY INDUSTRY INSIGHTS 
 
11 AUTOMOTIVE HUD MARKET, BY LEVEL OF AUTONOMY (Page No. - 164)
     11.1 INTRODUCTION 
     11.2 NON-AUTONOMOUS CAR 
             11.2.1 L0
                       11.2.1.1 Rising production of cars in Asia Pacific to drive market
     11.3 SEMI-AUTONOMOUS CAR 
             11.3.1 L1
                       11.3.1.1 Increasing adoption of autonomous driving features to drive market
             11.3.2 L2
                       11.3.2.1 Growing integration of automatic emergency braking, cross-traffic alert, and blind spot detection to drive market
             11.3.3 L2+
                       11.3.3.1 Surge in adoption of driver support systems to drive market
             11.3.4 L3
                       11.3.4.1 Growing shift to self-driving vehicles and driver support systems to drive market
     11.4 AUTONOMOUS CAR 
             11.4.1 L4
                       11.4.1.1 Growing inclination toward autonomous mobility solutions to drive market
             11.4.2 L5
                       11.4.2.1 Rising demand for reduced manual control to drive market
             11.4.3 KEY INDUSTRY INSIGHTS
 
12 AUTOMOTIVE HUD MARKET, BY PROPULSION TYPE (Page No. - 171)
     12.1 INTRODUCTION 
             12.1.1 OPERATIONAL DATA
     12.2 ICE VEHICLE 
             12.2.1 RISING ADOPTION OF ADAS IN ICE VEHICLES TO DRIVE MARKET
     12.3 ELECTRIC VEHICLE 
             12.3.1 GROWING FOCUS ON STRICT VEHICLE EMISSIONS TO DRIVE MARKET
     12.4 KEY INDUSTRY INSIGHTS 
 
13 AUTOMOTIVE HUD MARKET, BY OFFERING (Page No. - 176)
     13.1 INTRODUCTION 
     13.2 HARDWARE 
             13.2.1 INCREASING FOCUS ON ENHANCED DRIVING SAFETY AND CONVENIENCE TO DRIVE MARKET
     13.3 SOFTWARE 
             13.3.1 RISING ADOPTION OF ADAS-EQUIPPED VEHICLES TO DRIVE MARKET
     13.4 KEY INDUSTRY INSIGHTS 
 
14 AUTOMOTIVE HUD MARKET, BY REGION (Page No. - 180)
     14.1 INTRODUCTION 
     14.2 NORTH AMERICA 
             14.2.1 RECESSION IMPACT ANALYSIS
             14.2.2 CANADA
                       14.2.2.1 Rising sales of connected cars to drive market
             14.2.3 MEXICO
                       14.2.3.1 Growing demand for premium in-vehicle experiences, safety, and comfort features to drive market
             14.2.4 US
                       14.2.4.1 Increasing demand for advanced features in vehicles to drive market
     14.3 ASIA PACIFIC 
             14.3.1 RECESSION IMPACT ANALYSIS
             14.3.2 CHINA
                       14.3.2.1 High investment by major OEMs in autonomous and semi-autonomous vehicles to drive market
             14.3.3 INDIA
                       14.3.3.1 Increasing population and smart city initiatives to drive market
             14.3.4 JAPAN
                       14.3.4.1 Growing demand for connected and semi-autonomous cars to drive market
             14.3.5 SOUTH KOREA
                       14.3.5.1 Increasing demand for vehicle electronics and safety features to drive market
     14.4 EUROPE 
             14.4.1 RECESSION IMPACT ANALYSIS
             14.4.2 FRANCE
                       14.4.2.1 Growing installation of lane departure warning systems in heavy trucks to drive market
             14.4.3 GERMANY
                       14.4.3.1 Presence of domestic automotive sector players to drive market
             14.4.4 SPAIN
                       14.4.4.1 Increasing production and export from OEMs to drive market
             14.4.5 UK
                       14.4.5.1 Surging demand for advanced safety systems and driving convenience features to drive market
             14.4.6 ITALY
                       14.4.6.1 Growing demand for mid-segment and luxury cars to drive market
 
15 COMPETITIVE LANDSCAPE (Page No. - 210)
     15.1 OVERVIEW 
     15.2 KEY PLAYER STRATEGIES 
     15.3 MARKET SHARE ANALYSIS 
     15.4 REVENUE ANALYSIS 
     15.5 COMPANY VALUATION AND FINANCIAL METRICS 
     15.6 BRAND/PRODUCT COMPARISON 
     15.7 COMPANY EVALUATION MATRIX 
             15.7.1 STARS
             15.7.2 EMERGING LEADERS
             15.7.3 PERVASIVE PLAYERS
             15.7.4 PARTICIPANTS
             15.7.5 COMPANY FOOTPRINT
     15.8 STARTUP/SME EVALUATION MATRIX 
             15.8.1 PROGRESSIVE COMPANIES
             15.8.2 RESPONSIVE COMPANIES
             15.8.3 DYNAMIC COMPANIES
             15.8.4 STARTING BLOCKS
             15.8.5 COMPETITIVE BENCHMARKING
     15.9 COMPETITIVE SCENARIOS AND TRENDS 
             15.9.1 PRODUCT LAUNCHES/DEVELOPMENTS
             15.9.2 DEALS
             15.9.3 OTHER DEVELOPMENTS
 
16 COMPANY PROFILES (Page No. - 227)
     16.1 KEY PLAYERS 
             16.1.1 NIPPON SEIKI CO., LTD.
                       16.1.1.1 Business overview
                       16.1.1.2 Products/Solutions offered
                       16.1.1.3 Recent developments
                       16.1.1.4 MnM view
                                   16.1.1.4.1 Key strengths
                                   16.1.1.4.2 Strategic choices
                                   16.1.1.4.3 Weaknesses and competitive threats
             16.1.2 CONTINENTAL AG
                       16.1.2.1 Business overview
                       16.1.2.2 Products/Solutions offered
                       16.1.2.3 Recent developments
                       16.1.2.4 MnM view
                                   16.1.2.4.1 Key strengths
                                   16.1.2.4.2 Strategic choices
                                   16.1.2.4.3 Weaknesses and competitive threats
             16.1.3 PANASONIC HOLDINGS CORPORATION
                       16.1.3.1 Products/Solutions offered
                       16.1.3.2 Recent developments
                       16.1.3.3 MnM view
                                   16.1.3.3.1 Key strengths
                                   16.1.3.3.2 Strategic choices
                                   16.1.3.3.3 Weaknesses and competitive threats
             16.1.4 DENSO CORPORATION
                       16.1.4.1 Business overview
                       16.1.4.2 Products/Solutions offered
                       16.1.4.3 Recent developments
                       16.1.4.4 MnM view
                                   16.1.4.4.1 Key strengths
                                   16.1.4.4.2 Strategic choices
                                   16.1.4.4.3 Weaknesses and competitive threats
             16.1.5 FORYOU CORPORATION
                       16.1.5.1 Business overview
                       16.1.5.2 Products/Solutions offered
                       16.1.5.3 Recent developments
                       16.1.5.4 MnM view
                                   16.1.5.4.1 Key strengths
                                   16.1.5.4.2 Strategic choices
                                   16.1.5.4.3 Weaknesses and competitive threats
             16.1.6 YAZAKI CORPORATION
                       16.1.6.1 Business overview
                       16.1.6.2 Products/Solutions offered
                       16.1.6.3 Recent developments
             16.1.7 VISTEON CORPORATION
                       16.1.7.1 Business overview
                       16.1.7.2 Products/Solutions offered
                       16.1.7.3 Recent developments
             16.1.8 HUAWEI TECHNOLOGIES CO., LTD.
                       16.1.8.1 Business overview
                       16.1.8.2 Products/Solutions offered
                       16.1.8.3 Recent developments
             16.1.9 VALEO
                       16.1.9.1 Business overview
                       16.1.9.2 Recent developments
               16.1.10 JIANGSU ZEJING AUTOMOTIVE ELECTRONICS CO., LTD.
            16.1.10.1 Business overview
            16.1.10.2 Products/Solutions offered
               16.1.11 HYUNDAI MOBIS
            16.1.11.1 Business overview
            16.1.11.2 Products/Solutions offered
               16.1.12 LG ELECTRONICS
            16.1.12.1 Business overview
            16.1.12.2 Products/Solutions offered
            16.1.12.3 Recent developments
     16.2 OTHER PLAYERS 
             16.2.1 HARMAN INTERNATIONAL
             16.2.2 WAYRAY AG
             16.2.3 FUTURUS
             16.2.4 HUDWAY, LLC
             16.2.5 HUDLY
             16.2.6 CY VISION
             16.2.7 ENVISICS
             16.2.8 ZHEJIANG CRYSTAL-OPTECH CO., LTD.
             16.2.9 YILI ELECTRONICS CO., LTD.
               16.2.10 MAXELL, LTD.
               16.2.11 NEUSOFT CORPORATION
 
17 RECOMMENDATIONS BY MARKETSANDMARKETS (Page No. - 281)
     17.1 ASIA PACIFIC TO BE LARGEST MARKET DURING FORECAST PERIOD 
     17.2 INCREASING FOCUS ON SEMI-AUTONOMOUS VEHICLES TO DRIVE DEMAND FOR AUTOMOTIVE HUD SOLUTIONS 
     17.3 AR AND 3D HUDS TO EMERGE AS KEY TECHNOLOGIES 
     17.4 CONCLUSION 
 
18 APPENDIX (Page No. - 283)
     18.1 KEY INSIGHTS FROM INDUSTRY EXPERTS 
     18.2 DISCUSSION GUIDE 
     18.3 KNOWLEDGESTORE: MARKETSANDMARKETS’ SUBSCRIPTION PORTAL 
     18.4 CUSTOMIZATION OPTIONS 
             18.4.1 AUTOMOTIVE HUD MARKET, BY EV TYPE, AT A REGIONAL LEVEL
             18.4.2 AUTOMOTIVE HUD MARKET, BY LEVEL OF AUTONOMY, AT A REGIONAL LEVEL
             18.4.3 PROFILING OF ADDITIONAL MARKET PLAYERS (UP TO 5)
     18.5 RELATED REPORTS 
     18.6 AUTHOR DETAILS 
 
 
LIST OF TABLES (260 Tables) 
 
TABLE 1 AUTOMOTIVE HUD MARKET DEFINITION, BY HUD TYPE
TABLE 2 AUTOMOTIVE HUD MARKET DEFINITION, BY VEHICLE TYPE
TABLE 3 AUTOMOTIVE HUD MARKET DEFINITION, BY LEVEL OF AUTONOMY
TABLE 4 AUTOMOTIVE HUD MARKET DEFINITION, BY TECHNOLOGY
TABLE 5 AUTOMOTIVE HUD MARKET DEFINITION, BY VEHICLE CLASS
TABLE 6 AUTOMOTIVE HUD MARKET DEFINITION, BY OFFERING
TABLE 7 AUTOMOTIVE HUD MARKET DEFINITION, BY PROPULSION TYPE
TABLE 8 AUTOMOTIVE HUD MARKET DEFINITION, BY ELECTRIC VEHICLE TYPE
TABLE 9 INCLUSIONS AND EXCLUSIONS
TABLE 10 USD EXCHANGE RATES
TABLE 11 ROAD ACCIDENTS IN EUROPE, 2020–2023
TABLE 12 HEAD-UP DISPLAY APPLICATIONS
TABLE 13 VEHICLES EQUIPPED WITH HEAD-UP DISPLAYS, 2021–2024
TABLE 14 LEVEL OF AUTONOMY IN ELECTRIC VEHICLES, 2019–2024
TABLE 15 MONETARY INCENTIVES FOR ELECTRIC VEHICLES IN WESTERN EUROPE, 2023
TABLE 16 MAJOR ANNOUNCEMENTS ON AUTOMOTIVE ELECTRIFICATION, 2021–2023
TABLE 17 AUTOMOTIVE HUD MARKET: IMPACT OF MARKET DYNAMICS
TABLE 18 AUTOMOTIVE HUD MARKET: WHO SUPPLIES WHOM
TABLE 19 AVERAGE SELLING PRICE OF COMBINER HUD, BY KEY PLAYERS IN AFTERMARKET, 2024 (USD)
TABLE 20 AR HUD: AVERAGE SELLING PRICE TREND, BY REGION, 2020–2024
TABLE 21 2D HUD: AVERAGE SELLING PRICE TREND, BY REGION, 2020–2024
TABLE 22 ROLE OF COMPANIES IN ECOSYSTEM
TABLE 23 INNOVATIONS AND PATENT REGISTRATIONS, 2020–2024
TABLE 24 IMPORT DATA FOR HS CODE 870390, BY COUNTRY, 2020–2023 (USD MILLION)
TABLE 25 EXPORT DATA FOR HS CODE 870390, BY COUNTRY, 2020–2023 (USD MILLION)
TABLE 26 INFLUENCE OF STAKEHOLDERS ON BUYING PROCESS, BY HUD TYPE (%)
TABLE 27 KEY BUYING CRITERIA, BY HUD TYPE
TABLE 28 NORTH AMERICA: REGULATORY BODIES, GOVERNMENT AGENCIES, AND OTHER ORGANIZATIONS
TABLE 29 EUROPE: REGULATORY BODIES, GOVERNMENT AGENCIES, AND OTHER ORGANIZATIONS
TABLE 30 ASIA PACIFIC: REGULATORY BODIES, GOVERNMENT AGENCIES, AND OTHER ORGANIZATIONS
TABLE 31 AUTOMOTIVE HUD MARKET: KEY CONFERENCES AND EVENTS, 2024–2025
TABLE 32 COMBINER HUD VS. WINDSHIELD HUD
TABLE 33 AUTOMOTIVE HUD MARKET, BY HUD TYPE, 2020–2023 (USD MILLION)
TABLE 34 AUTOMOTIVE HUD MARKET, BY HUD TYPE, 2024–2030 (USD MILLION)
TABLE 35 PRODUCT OFFERINGS BY LEADING AUTOMOTIVE HUD MANUFACTURERS
TABLE 36 MODELS EQUIPPED WITH WINDSHIELD HEAD-UP DISPLAYS, 2022–2024
TABLE 37 WINDSHIELD: AUTOMOTIVE HUD MARKET, BY REGION, 2020–2023 (USD MILLION)
TABLE 38 WINDSHIELD: AUTOMOTIVE HUD MARKET, BY REGION, 2024–2030 (USD MILLION)
TABLE 39 AUTOMOTIVE HUD MARKET, BY TECHNOLOGY, 2020–2023 (THOUSAND UNITS)
TABLE 40 AUTOMOTIVE HUD MARKET, BY TECHNOLOGY, 2024–2030 (THOUSAND UNITS)
TABLE 41 AUTOMOTIVE HUD MARKET, BY TECHNOLOGY, 2020–2023 (USD MILLION)
TABLE 42 AUTOMOTIVE HUD MARKET, BY TECHNOLOGY, 2024–2030 (USD MILLION)
TABLE 43 TECHNOLOGY OFFERINGS BY LEADING AUTOMOTIVE HUD MANUFACTURERS
TABLE 44 2D VS. AR VS. 3D HEAD-UP DISPLAYS
TABLE 45 MODELS EQUIPPED WITH 2D HEAD-UP DISPLAYS, 2022–2024
TABLE 46 2D HUD: AUTOMOTIVE HUD MARKET, BY REGION, 2020–2023 (THOUSAND UNITS)
TABLE 47 2D HUD: AUTOMOTIVE HUD MARKET, BY REGION, 2024–2030 (THOUSAND UNITS)
TABLE 48 2D HUD: AUTOMOTIVE HUD MARKET, BY REGION, 2020–2023 (USD MILLION)
TABLE 49 2D HUD: AUTOMOTIVE HUD MARKET, BY REGION, 2024–2030 (USD MILLION)
TABLE 50 MODELS EQUIPPED WITH AR-HUDS, 2021–2024
TABLE 51 AR HUD: AUTOMOTIVE HUD MARKET, BY REGION, 2020–2023 (THOUSAND UNITS)
TABLE 52 AR HUD: AUTOMOTIVE HUD MARKET, BY REGION, 2024–2030 (THOUSAND UNITS)
TABLE 53 AR HUD: AUTOMOTIVE HUD MARKET, BY REGION, 2020–2023 (USD MILLION)
TABLE 54 AR HUD: AUTOMOTIVE HUD MARKET, BY REGION, 2024–2030 (USD MILLION)
TABLE 55 3D HUD: AUTOMOTIVE HUD MARKET, BY REGION, 2020–2023 (THOUSAND UNITS)
TABLE 56 3D HUD: AUTOMOTIVE HUD MARKET, BY REGION, 2024–2030 (THOUSAND UNITS)
TABLE 57 3D HUD: AUTOMOTIVE HUD MARKET, BY REGION, 2020–2023 (USD MILLION)
TABLE 58 3D HUD: AUTOMOTIVE HUD MARKET, BY REGION, 2024–2030 (USD MILLION)
TABLE 59 AUTOMOTIVE HUD MARKET, BY VEHICLE CLASS, 2020–2023 (THOUSAND UNITS)
TABLE 60 AUTOMOTIVE HUD MARKET, BY VEHICLE CLASS, 2024–2030 (THOUSAND UNITS)
TABLE 61 AUTOMOTIVE HUD MARKET, BY VEHICLE CLASS, 2020–2023 (USD MILLION)
TABLE 62 AUTOMOTIVE HUD MARKET, BY VEHICLE CLASS, 2024–2030 (USD MILLION)
TABLE 63 ECONOMY CAR: AUTOMOTIVE HUD MARKET, BY REGION, 2020–2023 (THOUSAND UNITS)
TABLE 64 ECONOMY CAR: AUTOMOTIVE HUD MARKET, BY REGION, 2024–2030 (THOUSAND UNITS)
TABLE 65 ECONOMY CAR: AUTOMOTIVE HUD MARKET, BY REGION, 2020–2023 (USD MILLION)
TABLE 66 ECONOMY CAR: AUTOMOTIVE HUD MARKET, BY REGION, 2024–2030 (USD MILLION)
TABLE 67 MID-SEGMENT CAR: AUTOMOTIVE HUD MARKET, BY REGION, 2020–2023 (THOUSAND UNITS)
TABLE 68 MID-SEGMENT CAR: AUTOMOTIVE HUD MARKET, BY REGION, 2024–2030 (THOUSAND UNITS)
TABLE 69 MID-SEGMENT CAR: AUTOMOTIVE HUD MARKET, BY REGION, 2020–2023 (USD MILLION)
TABLE 70 MID-SEGMENT CAR: AUTOMOTIVE HUD MARKET, BY REGION, 2024–2030 (USD MILLION)
TABLE 71 LUXURY CAR: AUTOMOTIVE HUD MARKET, BY REGION, 2020–2023 (THOUSAND UNITS)
TABLE 72 LUXURY CAR: AUTOMOTIVE HUD MARKET, BY REGION, 2024–2030 (THOUSAND UNITS)
TABLE 73 LUXURY CAR: AUTOMOTIVE HUD MARKET, BY REGION, 2020–2023 (USD MILLION)
TABLE 74 LUXURY CAR: AUTOMOTIVE HUD MARKET, BY REGION, 2024–2030 (USD MILLION)
TABLE 75 HUD-ENABLED VEHICLES, 2021–2024
TABLE 76 AUTOMOTIVE HUD MARKET, BY VEHICLE TYPE, 2020–2023 (THOUSAND UNITS)
TABLE 77 AUTOMOTIVE HUD MARKET, BY VEHICLE TYPE, 2024–2030 (THOUSAND UNITS)
TABLE 78 AUTOMOTIVE HUD MARKET, BY VEHICLE TYPE, 2020–2023 (USD MILLION)
TABLE 79 AUTOMOTIVE HUD MARKET, BY VEHICLE TYPE, 2024–2030 (USD MILLION)
TABLE 80 PASSENGER CARS EQUIPPED WITH AUTOMOTIVE HUDS
TABLE 81 PASSENGER CAR: AUTOMOTIVE HUD MARKET, BY REGION, 2020–2023 (THOUSAND UNITS)
TABLE 82 PASSENGER CAR: AUTOMOTIVE HUD MARKET, BY REGION, 2024–2030 (THOUSAND UNITS)
TABLE 83 PASSENGER CAR: AUTOMOTIVE HUD MARKE, BY REGION, 2020–2023 (USD MILLION)
TABLE 84 PASSENGER CAR: AUTOMOTIVE HUD MARKET, BY REGION, 2024–2030 (USD MILLION)
TABLE 85 COMMERCIAL VEHICLE: AUTOMOTIVE HUD MARKET, BY REGION, 2024–2030 (THOUSAND UNITS)
TABLE 86 COMMERCIAL VEHICLE: AUTOMOTIVE HUD MARKET, BY REGION, 2024–2030 (USD MILLION)
TABLE 87 AUTOMOTIVE HUD MARKET, BY EV TYPE, 2020-2023 (THOUSAND UNITS)
TABLE 88 AUTOMOTIVE HUD MARKET, BY EV TYPE, 2024–2030 (THOUSAND UNITS)
TABLE 89 AUTOMOTIVE HUD MARKET, BY EV TYPE, 2020-2023 (USD MILLION)
TABLE 90 AUTOMOTIVE HUD MARKET, BY EV TYPE, 2024–2030 (USD MILLION)
TABLE 91 BEST-SELLING EVS AND ICE VEHICLES IN 2023
TABLE 92 ELECTRIC VEHICLES EQUIPPED WITH AUTOMOTIVE HUDS
TABLE 93 AUTOMOTIVE HUD MARKET, BY LEVEL OF AUTONOMY, 2020–2023 (THOUSAND UNITS)
TABLE 94 AUTOMOTIVE HUD MARKET, BY LEVEL OF AUTONOMY, 2024–2030 (THOUSAND UNITS)
TABLE 95 POPULAR AUTONOMOUS VEHICLES WORLDWIDE
TABLE 96 VEHICLE MODELS EQUIPPED WITH HEAD-UP DISPLAYS, BY PROPULSION TYPE
TABLE 97 AUTOMOTIVE HUD MARKET, BY PROPULSION TYPE, 2020–2023 (THOUSAND UNITS)
TABLE 98 AUTOMOTIVE HUD MARKET, BY PROPULSION TYPE, 2024–2030 (THOUSAND UNITS)
TABLE 99 AUTOMOTIVE HUD MARKET, BY PROPULSION TYPE, 2020–2023 (USD MILLION)
TABLE 100 AUTOMOTIVE HUD MARKET, BY PROPULSION TYPE, 2024–2030 (USD MILLION)
TABLE 101 HARDWARE VS. SOFTWARE OFFERINGS
TABLE 102 AUTOMOTIVE HUD MARKET, BY OFFERING, 2020–2023 (USD MILLION)
TABLE 103 AUTOMOTIVE HUD MARKET, BY OFFERING, 2024–2030 (USD MILLION)
TABLE 104 AUTOMOTIVE HUD MARKET, BY REGION, 2020–2023 (THOUSAND UNITS)
TABLE 105 AUTOMOTIVE HUD MARKET, BY REGION, 2024–2030 (THOUSAND UNITS)
TABLE 106 AUTOMOTIVE HUD MARKET, BY REGION, 2020–2023 (USD MILLION)
TABLE 107 AUTOMOTIVE HUD MARKET, BY REGION, 2024–2030 (USD MILLION)
TABLE 108 NORTH AMERICA: AUTOMOTIVE HUD MARKET, BY COUNTRY, 2020–2023 (THOUSAND UNITS)
TABLE 109 NORTH AMERICA: AUTOMOTIVE HUD MARKET, BY COUNTRY, 2024–2030 (THOUSAND UNITS)
TABLE 110 NORTH AMERICA: AUTOMOTIVE HUD MARKET, BY COUNTRY, 2020–2023 (USD MILLION)
TABLE 111 NORTH AMERICA: AUTOMOTIVE HUD MARKET, BY COUNTRY, 2024–2030 (USD MILLION)
TABLE 112 CANADA: AUTOMOTIVE HUD MARKET, BY TECHNOLOGY, 2020–2023 (THOUSAND UNITS)
TABLE 113 CANADA: AUTOMOTIVE HUD MARKET, BY TECHNOLOGY, 2024–2030 (THOUSAND UNITS)
TABLE 114 CANADA: AUTOMOTIVE HUD MARKET, BY TECHNOLOGY, 2020–2023 (USD MILLION)
TABLE 115 CANADA: AUTOMOTIVE HUD MARKET, BY TECHNOLOGY, 2024–2030 (USD MILLION)
TABLE 116 MEXICO: AUTOMOTIVE HUD MARKET, BY TECHNOLOGY, 2020–2023 (THOUSAND UNITS)
TABLE 117 MEXICO: AUTOMOTIVE HUD MARKET, BY TECHNOLOGY, 2024–2030 (THOUSAND UNITS)
TABLE 118 MEXICO: AUTOMOTIVE HUD MARKET, BY TECHNOLOGY, 2020–2023 (USD MILLION)
TABLE 119 MEXICO: AUTOMOTIVE HUD MARKET, BY TECHNOLOGY, 2024–2030 (USD MILLION)
TABLE 120 US: AUTOMOTIVE HUD MARKET, BY TECHNOLOGY, 2020–2023 (THOUSAND UNITS)
TABLE 121 US: AUTOMOTIVE HUD MARKET, BY TECHNOLOGY, 2024–2030 (THOUSAND UNITS)
TABLE 122 US: AUTOMOTIVE HUD MARKET, BY TECHNOLOGY, 2020–2023 (USD MILLION)
TABLE 123 US: AUTOMOTIVE HUD MARKET, BY TECHNOLOGY, 2024–2030 (USD MILLION)
TABLE 124 ASIA PACIFIC: AUTOMOTIVE HUD MARKET, BY COUNTRY, 2020–2023 (THOUSAND UNITS)
TABLE 125 ASIA PACIFIC: AUTOMOTIVE HUD MARKET, BY COUNTRY, 2024–2030 (THOUSAND UNITS)
TABLE 126 ASIA PACIFIC: AUTOMOTIVE HUD MARKET, BY COUNTRY, 2020–2023 (USD MILLION)
TABLE 127 ASIA PACIFIC: AUTOMOTIVE HUD MARKET, BY COUNTRY, 2024–2030 (USD MILLION)
TABLE 128 CHINA: AUTOMOTIVE HUD MARKET, BY TECHNOLOGY, 2020–2023 (THOUSAND UNITS)
TABLE 129 CHINA: AUTOMOTIVE HUD MARKET, BY TECHNOLOGY, 2024–2030 (THOUSAND UNITS)
TABLE 130 CHINA: AUTOMOTIVE HUD MARKET, BY TECHNOLOGY, 2020–2023 (USD MILLION)
TABLE 131 CHINA: AUTOMOTIVE HUD MARKET, BY TECHNOLOGY, 2024–2030 (USD MILLION)
TABLE 132 INDIA: AUTOMOTIVE HUD MARKET, BY TECHNOLOGY, 2020–2023 (THOUSAND UNITS)
TABLE 133 INDIA: AUTOMOTIVE HUD MARKET, BY TECHNOLOGY, 2024–2030 (THOUSAND UNITS)
TABLE 134 INDIA: AUTOMOTIVE HUD MARKET, BY TECHNOLOGY, 2020–2023 (USD MILLION)
TABLE 135 INDIA: AUTOMOTIVE HUD MARKET, BY TECHNOLOGY, 2024–2030 (USD MILLION)
TABLE 136 JAPAN: AUTOMOTIVE HUD MARKET, BY TECHNOLOGY, 2020–2023 (THOUSAND UNITS)
TABLE 137 JAPAN: AUTOMOTIVE HUD MARKET, BY TECHNOLOGY, 2024–2030 (THOUSAND UNITS)
TABLE 138 JAPAN: AUTOMOTIVE HUD MARKET, BY TECHNOLOGY, 2020–2023 (USD MILLION)
TABLE 139 JAPAN: AUTOMOTIVE HUD MARKET, BY TECHNOLOGY, 2024–2030 (USD MILLION)
TABLE 140 SOUTH KOREA: AUTOMOTIVE HUD MARKET, BY TECHNOLOGY, 2020–2023 (THOUSAND UNITS)
TABLE 141 SOUTH KOREA: AUTOMOTIVE HUD MARKET, BY TECHNOLOGY, 2024–2030 (THOUSAND UNITS)
TABLE 142 SOUTH KOREA: AUTOMOTIVE HUD MARKET, BY TECHNOLOGY, 2020–2023 (USD MILLION)
TABLE 143 SOUTH KOREA: AUTOMOTIVE HUD MARKET, BY TECHNOLOGY, 2024–2030 (USD MILLION)
TABLE 144 EUROPE: AUTOMOTIVE HUD MARKET, BY COUNTRY, 2020–2023 (THOUSAND UNITS)
TABLE 145 EUROPE: AUTOMOTIVE HUD MARKET, BY COUNTRY, 2024–2030 (THOUSAND UNITS)
TABLE 146 EUROPE: AUTOMOTIVE HUD MARKET, BY COUNTRY, 2020–2023 (USD MILLION)
TABLE 147 EUROPE: AUTOMOTIVE HUD MARKET, BY COUNTRY, 2024–2030 (USD MILLION)
TABLE 148 FRANCE: AUTOMOTIVE HUD MARKET, BY TECHNOLOGY, 2020–2023 (THOUSAND UNITS)
TABLE 149 FRANCE: AUTOMOTIVE HUD MARKET, BY TECHNOLOGY, 2024–2030 (THOUSAND UNITS)
TABLE 150 FRANCE: AUTOMOTIVE HUD MARKET, BY TECHNOLOGY, 2020–2023 (USD MILLION)
TABLE 151 FRANCE: AUTOMOTIVE HUD MARKET, BY TECHNOLOGY, 2024–2030 (USD MILLION)
TABLE 152 GERMANY: AUTOMOTIVE HUD MARKET, BY TECHNOLOGY, 2020–2023 (THOUSAND UNITS)
TABLE 153 GERMANY: AUTOMOTIVE HUD MARKET, BY TECHNOLOGY, 2024–2030 (THOUSAND UNITS)
TABLE 154 GERMANY: AUTOMOTIVE HUD MARKET, BY TECHNOLOGY, 2020–2023 (USD MILLION)
TABLE 155 GERMANY: AUTOMOTIVE HUD MARKET, BY TECHNOLOGY, 2024–2030 (USD MILLION)
TABLE 156 SPAIN: AUTOMOTIVE HUD MARKET, BY TECHNOLOGY, 2020–2023 (THOUSAND UNITS)
TABLE 157 SPAIN: AUTOMOTIVE HUD MARKET, BY TECHNOLOGY, 2024–2030 (THOUSAND UNITS)
TABLE 158 SPAIN: AUTOMOTIVE HUD MARKET, BY TECHNOLOGY, 2020–2023 (USD MILLION)
TABLE 159 SPAIN: AUTOMOTIVE HUD MARKET, BY TECHNOLOGY, 2024–2030 (USD MILLION)
TABLE 160 UK: AUTOMOTIVE HUD MARKET, BY TECHNOLOGY, 2020–2023 (THOUSAND UNITS)
TABLE 161 UK: AUTOMOTIVE HUD MARKET, BY TECHNOLOGY, 2024–2030 (THOUSAND UNITS)
TABLE 162 UK: AUTOMOTIVE HUD MARKET, BY TECHNOLOGY, 2020–2023 (USD MILLION)
TABLE 163 UK: AUTOMOTIVE HUD MARKET, BY TECHNOLOGY, 2024–2030 (USD MILLION)
TABLE 164 ITALY: AUTOMOTIVE HUD MARKET, BY TECHNOLOGY, 2020–2023 (THOUSAND UNITS)
TABLE 165 ITALY: AUTOMOTIVE HUD MARKET, BY TECHNOLOGY, 2024–2030 (THOUSAND UNITS)
TABLE 166 ITALY: AUTOMOTIVE HUD MARKET, BY TECHNOLOGY, 2020–2023 (USD MILLION)
TABLE 167 ITALY: AUTOMOTIVE HUD MARKET, BY TECHNOLOGY, 2024–2030 (USD MILLION)
TABLE 168 KEY PLAYER STRATEGIES, 2021–2024
TABLE 169 AUTOMOTIVE HUD MARKET: DEGREE OF COMPETITION
TABLE 170 AUTOMOTIVE HUD MARKET: COMPANY FOOTPRINT, 2023
TABLE 171 AUTOMOTIVE HUD MARKET: REGION FOOTPRINT, 2023
TABLE 172 AUTOMOTIVE HUD MARKET: HUD TYPE FOOTPRINT, 2023
TABLE 173 AUTOMOTIVE HUD MARKET: KEY STARTUPS/SMES
TABLE 174 AUTOMOTIVE HUD MARKET: COMPETITIVE BENCHMARKING OF KEY STARTUPS/SMES
TABLE 175 AUTOMOTIVE HUD MARKET: PRODUCT LAUNCHES/DEVELOPMENTS, JANUARY 2021–MARCH 2024
TABLE 176 AUTOMOTIVE HUD MARKET: DEALS, JANUARY 2021–MARCH 2024
TABLE 177 AUTOMOTIVE HUD MARKET: OTHER DEVELOPMENTS, JANUARY 2021–MARCH 2024
TABLE 178 NIPPON SEIKI CO., LTD.: COMPANY OVERVIEW `
TABLE 179 NIPPON SEIKI CO., LTD.: SHAREHOLDERS (AS OF MARCH 2023)
TABLE 180 NIPPON SEIKI CO., LTD.: SALES RATIO TO MAJOR CUSTOMERS (AS OF MARCH 2023)
TABLE 181 NIPPON SEIKI CO., LTD.: MAJOR SUPPLY CONTRACTS
TABLE 182 NIPPON SEIKI CO., LTD.: PRODUCTS/SOLUTIONS OFFERED
TABLE 183 NIPPON SEIKI CO., LTD.: DEALS
TABLE 184 NIPPON SEIKI CO., LTD.: OTHER DEVELOPMENTS
TABLE 185 NIPPON SEIKI CO., LTD.: EXPANSIONS
TABLE 186 CONTINENTAL AG: COMPANY OVERVIEW
TABLE 187 CONTINENTAL AG: MAJOR SUPPLY AGREEMENTS
TABLE 188 CONTINENTAL AG: KEY CUSTOMERS (AS OF MARCH 2023)
TABLE 189 CONTINENTAL AG: PRODUCTS/SOLUTIONS OFFERED
TABLE 190 CONTINENTAL AG: PRODUCT LAUNCHES/DEVELOPMENTS
TABLE 191 CONTINENTAL AG: EXPANSIONS
TABLE 192 PANASONIC HOLDINGS CORPORATION: COMPANY OVERVIEW
TABLE 193 PANASONIC HOLDINGS CORPORATION: KEY CUSTOMERS
TABLE 194 PANASONIC HOLDINGS CORPORATION: SUPPLY CONTRACTS
TABLE 195 PANASONIC HOLDINGS CORPORATION: PRODUCTS/SOLUTIONS OFFERED
TABLE 196 PANASONIC HOLDINGS CORPORATION: PRODUCT LAUNCHES/DEVELOPMENTS
TABLE 197 PANASONIC HOLDINGS CORPORATION: DEALS
TABLE 198 PANASONIC HOLDINGS CORPORATION: EXPANSIONS
TABLE 199 PANASONIC HOLDINGS CORPORATION: OTHER DEVELOPMENTS
TABLE 200 DENSO CORPORATION: COMPANY OVERVIEW
TABLE 201 DENSO CORPORATION: KEY CUSTOMERS
TABLE 202 DENSO CORPORATION: SALES BREAKDOWN, BY OEMS (AS OF MARCH 2022)
TABLE 203 DENSO CORPORATION: MAJOR SUBSIDIARIES AND AFFILIATES
TABLE 204 DENSO CORPORATION: MAJOR SUPPLY AGREEMENTS
TABLE 205 DENSO CORPORATION: PRODUCTS/SOLUTIONS OFFERED
TABLE 206 DENSO CORPORATION: EXPANSIONS
TABLE 207 DENSO CORPORATION: OTHER DEVELOPMENTS
TABLE 208 FORYOU CORPORATION: COMPANY OVERVIEW
TABLE 209 FORYOU CORPORATION: KEY CUSTOMERS
TABLE 210 FORYOU CORPORATION: MAJOR SUPPLY AGREEMENTS
TABLE 211 FORYOU CORPORATION: PRODUCTS/SOLUTIONS OFFERED
TABLE 212 FORYOU CORPORATION: DEALS
TABLE 213 FORYOU CORPORATION: OTHER DEVELOPMENTS
TABLE 214 YAZAKI CORPORATION: COMPANY OVERVIEW
TABLE 215 YAZAKI CORPORATION: KEY CUSTOMERS
TABLE 216 YAZAKI CORPORATION: PRODUCTS/SOLUTIONS OFFERED
TABLE 217 YAZAKI CORPORATION: PRODUCT LAUNCHES/DEVELOPMENTS
TABLE 218 YAZAKI CORPORATION: DEALS
TABLE 219 YAZAKI CORPORATION: EXPANSIONS
TABLE 220 YAZAKI CORPORATION: OTHER DEVELOPMENTS
TABLE 221 VISTEON CORPORATION: COMPANY OVERVIEW
TABLE 222 VISTEON CORPORATION: KEY CUSTOMERS
TABLE 223 VISTEON CORPORATION: SUPPLY CONTRACTS
TABLE 224 VISTEON CORPORATION: PRODUCTS/SOLUTIONS OFFERED
TABLE 225 VISTEON CORPORATION: PRODUCT LAUNCHES/DEVELOPMENTS
TABLE 226 VISTEON CORPORATION: EXPANSIONS
TABLE 227 HUAWEI TECHNOLOGIES CO., LTD.: COMPANY OVERVIEW
TABLE 228 HUAWEI TECHNOLOGIES CO., LTD.: MAJOR SUPPLY AGREEMENTS
TABLE 229 HUAWEI TECHNOLOGIES CO., LTD.: KEY CUSTOMERS
TABLE 230 HUAWEI TECHNOLOGIES CO., LTD.: PRODUCTS/SOLUTIONS OFFERED
TABLE 231 HUAWEI TECHNOLOGIES CO., LTD.: PRODUCT LAUNCHES/DEVELOPMENTS
TABLE 232 HUAWEI TECHNOLOGIES CO., LTD.: DEALS
TABLE 233 HUAWEI TECHNOLOGIES CO., LTD.: OTHER DEVELOPMENTS
TABLE 234 VALEO: COMPANY OVERVIEW
TABLE 235 VALEO: PRODUCTS/SOLUTIONS OFFERED
TABLE 236 VALEO: KEY CUSTOMERS
TABLE 237 VALEO: BUSINESS GROUPS WITH MAJOR COMPETITORS
TABLE 238 VALEO.: PRODUCT LAUNCHES/DEVELOPMENTS
TABLE 239 VALEO: EXPANSIONS
TABLE 240 JIANGSU ZEJING AUTOMOTIVE ELECTRONICS CO., LTD.: COMPANY OVERVIEW
TABLE 241 JIANGSU ZEJING AUTOMOTIVE ELECTRONICS CO., LTD.: PRODUCTS/SOLUTIONS OFFERED
TABLE 242 HYUNDAI MOBIS: COMPANY OVERVIEW
TABLE 243 HYUNDAI MOBIS: SUPPLY CONTRACTS
TABLE 244 HYUNDAI MOBIS: PRODUCTS/SOLUTIONS OFFERED
TABLE 245 HYUNDAI MOBIS: OTHER DEVELOPMENTS
TABLE 246 LG ELECTRONICS: COMPANY OVERVIEW
TABLE 247 LG ELECTRONICS: KEY CUSTOMERS
TABLE 248 LG ELECTRONICS: PRODUCTS/SOLUTIONS OFFERED
TABLE 249 LG ELECTRONICS: PRODUCT LAUNCHES/DEVELOPMENTS
TABLE 250 HARMAN INTERNATIONAL: COMPANY OVERVIEW
TABLE 251 WAYRAY AG: COMPANY OVERVIEW
TABLE 252 FUTURUS: COMPANY OVERVIEW
TABLE 253 HUDWAY, LLC: COMPANY OVERVIEW
TABLE 254 HUDLY: COMPANY OVERVIEW
TABLE 255 CY VISION: COMPANY OVERVIEW
TABLE 256 ENVISICS: COMPANY OVERVIEW
TABLE 257 ZHEJIANG CRYSTAL-OPTECH CO., LTD.: COMPANY OVERVIEW
TABLE 258 YILI ELECTRONICS CO., LTD.: COMPANY OVERVIEW
TABLE 259 MAXELL, LTD.: COMPANY OVERVIEW
TABLE 260 NEUSOFT CORPORATION: COMPANY OVERVIEW
 
  
LIST OF FIGURES (87 Figures) 
 
FIGURE 1 AUTOMOTIVE HUD MARKET SEGMENTATION
FIGURE 2 RESEARCH DESIGN
FIGURE 3 RESEARCH PROCESS FLOW
FIGURE 4 BREAKDOWN OF PRIMARY INTERVIEWS: BY COMPANY TYPE, DESIGNATION, AND REGION
FIGURE 5 RESEARCH METHODOLOGY: HYPOTHESIS BUILDING
FIGURE 6 BOTTOM-UP APPROACH
FIGURE 7 TOP-DOWN APPROACH
FIGURE 8 RESEARCH DESIGN AND METHODOLOGY
FIGURE 9 DATA TRIANGULATION
FIGURE 10 MARKET GROWTH PROJECTIONS FROM DEMAND-SIDE DRIVERS
FIGURE 11 FACTOR ANALYSIS FOR MARKET SIZING: DEMAND AND SUPPLY SIDES
FIGURE 12 AUTOMOTIVE HUD MARKET OUTLOOK
FIGURE 13 AUTOMOTIVE HUD MARKET, BY REGION, 2024–2030
FIGURE 14 AUTOMOTIVE HUD MARKET, BY VEHICLE TYPE, 2024–2030
FIGURE 15 AUTOMOTIVE HUD MARKET, BY TECHNOLOGY, 2024–2030
FIGURE 16 KEY PLAYERS IN AUTOMOTIVE HUD MARKET
FIGURE 17 INCREASING DEMAND FOR ROAD SAFETY AND ENHANCED DRIVING EXPERIENCE TO DRIVE MARKET
FIGURE 18 ASIA PACIFIC TO ACCOUNT FOR LARGEST MARKET SHARE IN 2024
FIGURE 19 WINDSHIELD HUD TO BE DOMINANT SEGMENT DURING FORECAST PERIOD
FIGURE 20 3D HUD TO BE FASTEST-GROWING SEGMENT DURING FORECAST PERIOD
FIGURE 21 BEV SEGMENT TO LEAD MARKET DURING FORECAST PERIOD
FIGURE 22 PASSENGER CAR SEGMENT TO DOMINATE MARKET DURING FORECAST PERIOD
FIGURE 23 SEMI-AUTONOMOUS CAR SEGMENT TO HAVE LARGEST MARKET SHARE DURING FORECAST PERIOD
FIGURE 24 ELECTRIC VEHICLE SEGMENT TO GROW AT FASTER RATE THAN ICE VEHICLE SEGMENT DURING FORECAST PERIOD
FIGURE 25 ECONOMY CAR SEGMENT TO GROW AT HIGHEST RATE DURING FORECAST PERIOD
FIGURE 26 SOFTWARE SEGMENT TO REGISTER HIGHER CAGR THAN HARDWARE DURING FORECAST PERIOD
FIGURE 27 AUTOMOTIVE HUD MARKET: DRIVERS, RESTRAINTS, OPPORTUNITIES, AND CHALLENGES
FIGURE 28 GLOBAL STATUS REPORT ON ROAD SAFETY
FIGURE 29 HUD BENEFITS FOR END USERS
FIGURE 30 CATEGORIES OF HUD DESIGNS
FIGURE 31 GLOBAL BEV AND PHEV SALES, 2020–2023
FIGURE 32 TRENDS AND DISRUPTIONS IMPACTING CUSTOMER BUSINESS
FIGURE 33 KEY OEM HEAD-UP DISPLAY OFFERINGS, BY HUD TYPE, 2023
FIGURE 34 AR HUD PROVIDERS, BY SHARE OF SUPPLY CONTRACTS, 2023
FIGURE 35 AVERAGE SELLING PRICE, BY TECHNOLOGY, 2020–2024 (USD)
FIGURE 36 ECOSYSTEM ANALYSIS
FIGURE 37 SUPPLY CHAIN ANALYSIS
FIGURE 38 COMPARISON OF BILL OF MATERIALS OF 2D HUD VS. AR HUD IN 2024
FIGURE 39 COMPARISON OF BILL OF MATERIALS OF 2D HUD VS. AR HUD IN 2030
FIGURE 40 PATENT ANALYSIS, 2014–2023
FIGURE 41 LEGAL STATUS OF PATENTS FILED FOR AUTOMOTIVE HUDS, 2012–2024
FIGURE 42 INFLUENCE OF STAKEHOLDERS ON BUYING PROCESS, BY HUD TYPE
FIGURE 43 KEY BUYING CRITERIA, BY HUD TYPE
FIGURE 44 TECHNOLOGICAL TRENDS
FIGURE 45 EVOLUTION OF AUTOMOTIVE HUD
FIGURE 46 TECHNOLOGY ROADMAP
FIGURE 47 3D HUD
FIGURE 48 3D AR HUD
FIGURE 49 LIGHT EMITTING DIODE DISPLAY
FIGURE 50 LASER BEAM SCANNING
FIGURE 51 BIOMETRIC DRIVER MONITORING
FIGURE 52 CONNECTED VEHICLE
FIGURE 53 DIFFERENT TYPES OF ADAS SENSORS
FIGURE 54 CONVENTIONAL AND AR HEAD-UP DISPLAY DEVELOPMENTS, 2017–2023
FIGURE 55 INVESTMENT AND FUNDING SCENARIO, 2020–2024
FIGURE 56 AUTOMOTIVE HUD MARKET, BY HUD TYPE, 2024 VS. 2030 (USD MILLION)
FIGURE 57 AUTOMOTIVE HUD MARKET, BY TECHNOLOGY, 2024 VS. 2030 (USD MILLION)
FIGURE 58 AUTOMOTIVE HUD MARKET, BY VEHICLE CLASS, 2024 VS. 2030 (USD MILLION)
FIGURE 59 AUTOMOTIVE HUD MARKET, BY VEHICLE TYPE, 2024 VS. 2030 (USD MILLION)
FIGURE 60 ELECTRIC VEHICLE COMPARISON, BY PROPULSION
FIGURE 61 AUTOMOTIVE HUD MARKET, BY ELECTRIC VEHICLE TYPE, 2024 VS. 2030 (USD MILLION)
FIGURE 62 LEVELS OF AUTONOMY IN CARS
FIGURE 63 AUTOMOTIVE HUD MARKET, BY LEVEL OF AUTONOMY, 2024 VS. 2030 (THOUSAND UNITS)
FIGURE 64 AUTOMOTIVE HUD MARKET, BY PROPULSION TYPE, 2024 VS. 2030 (USD MILLION)
FIGURE 65 AUTOMOTIVE HUD MARKET, BY OFFERING, 2024 VS. 2030 (USD MILLION)
FIGURE 66 AUTOMOTIVE HUD MARKET, BY REGION, 2024 VS. 2030 (USD MILLION)
FIGURE 67 NORTH AMERICA: AUTOMOTIVE HUD MARKET SNAPSHOT
FIGURE 68 ASIA PACIFIC: AUTOMOTIVE HUD MARKET SNAPSHOT
FIGURE 69 EUROPE: AUTOMOTIVE HUD MARKET, BY COUNTRY, 2024–2030
FIGURE 70 MARKET SHARE ANALYSIS, 2023
FIGURE 71 REVENUE ANALYSIS OF TOP 5 PLAYERS, 2018–2022
FIGURE 72 COMPANY VALUATION OF KEY PLAYERS
FIGURE 73 FINANCIAL METRICS OF KEY PLAYERS
FIGURE 74 BRAND/PRODUCT COMPARISON
FIGURE 75 AUTOMOTIVE HUD MARKET: COMPANY EVALUATION MATRIX, 2023
FIGURE 76 AUTOMOTIVE HUD MARKET: STARTUP/SME EVALUATION MATRIX, 2023
FIGURE 77 NIPPON SEIKI CO., LTD.: COMPANY SNAPSHOT
FIGURE 78 CONTINENTAL AG: COMPANY SNAPSHOT
FIGURE 79 CONTINENTAL AG: BUSINESS LOCATIONS AND EMPLOYEES (AS OF JANUARY 2023)
FIGURE 80 PANASONIC HOLDINGS CORPORATION: COMPANY SNAPSHOT
FIGURE 81 DENSO CORPORATION: COMPANY SNAPSHOT
FIGURE 82 FORYOU CORPORATION: COMPANY SNAPSHOT
FIGURE 83 YAZAKI CORPORATION: COMPANY SNAPSHOT
FIGURE 84 VISTEON CORPORATION: COMPANY SNAPSHOT
FIGURE 85 HUAWEI TECHNOLOGIES CO., LTD.: COMPANY SNAPSHOT
FIGURE 86 VALEO: COMPANY SNAPSHOT
FIGURE 87 LG ELECTRONICS: COMPANY SNAPSHOT

The study involved four major activities to estimate the current size of the automotive HUD market. Exhaustive secondary research was done to collect information on the market, the peer market, and model mapping. The next step was to validate these findings, assumptions, and sizing with the industry experts across value chains through primary research. The bottom-up and top-down approaches were employed to estimate the total market size. After that, market breakdown and data triangulation were used to determine the market size of segments and subsegments.

Secondary Research

Secondary sources referred to for this research study included automotive industry organizations involved with head-up display; publications from government sources [such as country level automotive associations and organizations, Organisation for Economic Co-operation and Development (OECD), World Bank, CDC, and Eurostat]; corporate filings (annual reports, investor presentations, and financial statements); and trade, business, and automotive associations. Secondary data was collected and analyzed to arrive at the overall market size, which was further validated through primary research.

Primary Research

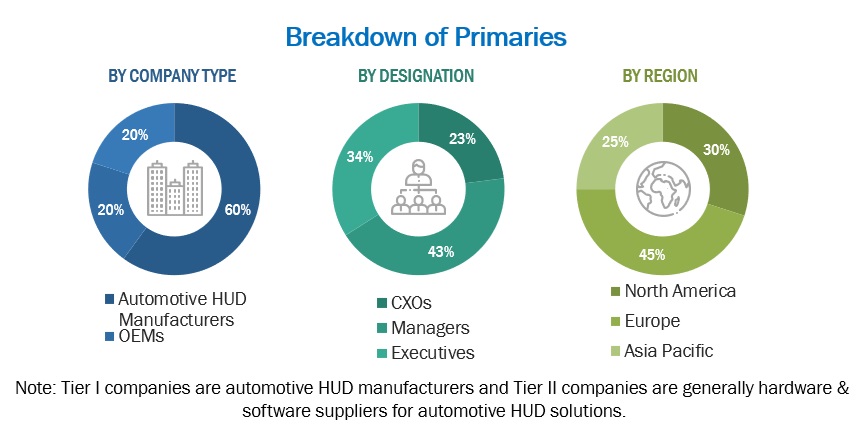
Extensive primary research was conducted after acquiring an understanding of the automotive HUD market scenario through secondary research. Several primary interviews were conducted with market experts from both the demand (OEMs) and supply (automotive HUD manufacturers, and Tier II suppliers) sides across major regions, namely, North America, Europe, and Asia Pacific. Approximately 40% and 60% of primary interviews were conducted from the supply side & industry associations and dealers/distributors, respectively. Primary data was collected through questionnaires, emails, and telephonic interviews. In the canvassing of primaries, various departments within organizations, such as sales, operations, and administration, were considered to provide a holistic viewpoint in this report.

After interacting with industry experts, brief sessions with highly experienced independent consultants were conducted to reinforce the findings from primaries. This, along with the in-house subject matter experts’ opinions, led to the findings as described in the remainder of this report.
Automotive HUD Market Size, and Share

To know about the assumptions considered for the study, download the pdf brochure

Market Size Estimation

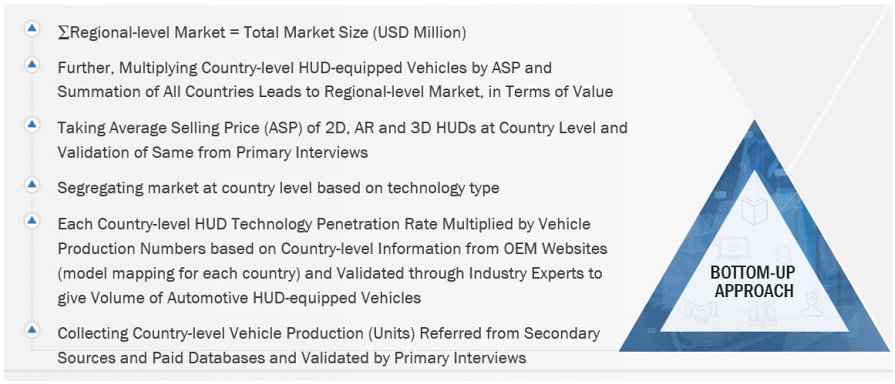
The bottom-up approach was used to estimate and validate the size of the automotive HUD market. In the bottom-up approach, the number of vehicle production of each vehicle type at the country level was considered. The number was then multiplied by the country-level penetration of HUDs for each vehicle type to determine the market size of automotive HUDs, in terms of volume. The country-level passenger car market was then multiplied with the penetration of vehicle class (economy cars, mid-segment cars, and luxury cars) to determine the market size of automotive HUDs by vehicle class. The country-level market of each vehicle class was then multiplied by the penetration of HUD type to determine the market, by type, in terms of volume. The country-level market size, in terms of volume, of automotive HUDs, by type, was then multiplied by the country-level Average OE Price (AOP) of each HUD type to determine the market of each vehicle class in terms of value. A summation of country-level value for each vehicle class was carried out to determine the country-level market of passenger cars. Further, the AOP of HUD was multiplied by the volume of light commercial vehicle and heavy commercial vehicle markets. Summation of the country-level market for each vehicle, by value, enabled the estimation of the country-level market size, in terms of value. The summation of the country-level market led to the regional market size, and further summation of the regional markets provided the global market size.

  • The key players in the industry and markets have been identified through extensive secondary research.
  • The industry’s future supply chain and market size, in terms of value, have been determined through primary and secondary research processes.
  • All percentage shares, splits, and breakdowns have been determined using secondary sources and verified through primary sources.

Global Automotive HUD Market Size: Bottom-Up Approach
Automotive HUD Market Bottom Up Approach

To know about the assumptions considered for the study, Request for Free Sample Report

The top-down approach was used to estimate and validate the market size of the automotive HUD by offering (value) and level of autonomy (volume and value). In this approach, offering, and level of autonomy of automotive HUDs were identified at the regional level. The market share of each offering, and level of autonomy was identified for each region. The market shares were then multiplied by the volume and value of the global automotive HUD market, respectively. All regional data were added to derive the global market for respective segments.

Global Automotive HUD Market Size: Top-Down Approach

Automotive HUD Market Top Down Approach

Data Triangulation

After arriving at the overall market size of the global market through the above-mentioned methodology, this market was split into several segments and subsegments. The data triangulation and market breakdown procedure were employed, wherever applicable, to complete the overall market engineering process and arrive at the exact market value data for the key segments and subsegments. The extrapolated market data was triangulated by studying various macro indicators and regional trends from both the demand- and supply-side participants.

Market Definition

Automotive HUD: As per Continental AG (Germany), the Head-up Display (HUD) shows directly in the line of sight. Drivers get all the important information such as speed, warning signals and indicator arrows for navigation without looking down to the instrument cluster or the secondary display.  

Key Stakeholders

  • ADAS Integrators
  • ADAS/Occupant Safety Solution Suppliers
  • Augmented Reality HUD Technology Providers
  • Automobile Organizations/Associations
  • Automotive Augmented Reality HUD Manufacturers
  • Automotive Display Suppliers
  • Automotive Electronic Hardware Suppliers
  • Automotive Electronic System Integrators
  • Automotive HUD Manufacturers
  • Automotive Smart Display Panel Manufacturers
  • Automotive SoC and ECU Manufacturers
  • Country-specific Automotive Associations
  • European Automobile Manufacturers’ Association (ACEA)
  • EV and EV Component Manufacturers
  • Government & Research Organizations
  • HUD Technology Providers
  • National Highway Traffic Safety Administration (NHTSA)
  • Raw Material Suppliers for Automotive HUD Manufacturers
  • Regulatory Bodies
  • Software Providers
  • Traders, Distributors, and Suppliers of Automotive HUDs
  • Vehicle Safety Regulatory Bodies

Report Objectives

  • To analyze and forecast the automotive HUD market in terms of value (USD million) & volume (thousand units), from 2020 to 2030
  • To segment and forecast the market by value & volume based on region (Asia Pacific, Europe, and North America)
  • To segment and forecast the market, by value & volume, based on HUD type (windshield HUD and combiner HUD)
  • To segment and forecast the market, by value & volume, based on technology (AR HUD, 3D HUD and 2D HUD)
  • To segment and forecast the market, by value & volume, based on vehicle class (mid-segment cars, luxury cars, and economy cars)
  • To segment and forecast the market, by value, based on offering (software, and hardware)
  • To segment and forecast the market, by value & volume, based on vehicle type (passenger cars and commercial vehicles)
  • To segment and forecast the market, by value & volume, based on level of autonomy (non-autonomous cars, semi-autonomous cars, and autonomous cars)
  • To segment and forecast the market, by value & volume, based on propulsion type (ICE vehicles and electric vehicles)
  • To segment and forecast the market, by value & volume, based on EV type (BEVs, FCEVs, HEVs, and PHEVs)
  • To provide detailed information about the factors influencing the market growth (drivers, challenges, restraints, and opportunities)
  • To strategically analyze the market with respect to individual growth trends, prospects, and contributions to the total market
  • To study the following with respect to the market
    • Supply Chain Analysis
    • Ecosystem
    • Technology Analysis
    • Case Study Analysis
    • Patent Analysis
    • Tariff and Regulatory Landscape
    • Average Selling Price Analysis
    • Buying Criteria
  • To strategically profile the key players and comprehensively analyze their market share and core competencies
  • To analyze the opportunities for stakeholders and the competitive landscape for market leaders
  • To track and analyze competitive developments such as deals, product developments, expansions, and other activities undertaken by the key industry participants

Available Customizations

With the given market data, MarketsandMarkets offers customizations in accordance to the company’s specific needs.

  • Automotive HUD market, by EV type, at a regional level
  • Automotive HUD market, by vehicle autonomy, at a regional level
  • Profiling of additional market players (Up to 5)
Custom Market Research Services

We will customize the research for you, in case the report listed above does not meet with your exact requirements. Our custom research will comprehensively cover the business information you require to help you arrive at strategic and profitable business decisions.

Request Customization

Instant Answers with GPT - Ask Now!

Ask real questions. Get complete answers !
Report Code
AT 2973
Published ON
May, 2024
Choose License Type
BUY NOW
  • SHARE
X
Request Customization
Speak to Analyst
Speak to Analyst
OR FACE-TO-FACE MEETING
PERSONALIZE THIS RESEARCH
  • Triangulate with your Own Data
  • Get Data as per your Format and Definition
  • Gain a Deeper Dive on a Specific Application, Geography, Customer or Competitor
  • Any level of Personalization
REQUEST A FREE CUSTOMIZATION
LET US HELP YOU!
  • What are the Known and Unknown Adjacencies Impacting the Automotive HUD Market
  • What will your New Revenue Sources be?
  • Who will be your Top Customer; what will make them switch?
  • Defend your Market Share or Win Competitors
  • Get a Scorecard for Target Partners
CUSTOMIZED WORKSHOP REQUEST
  • Call Us
  • +1-888-600-6441 (Corporate office hours)
  • +1-888-600-6441 (US/Can toll free)
  • +44-800-368-9399 (UK office hours)
CONNECT WITH US
ABOUT TRUST ONLINE
©2024 MarketsandMarkets Research Private Ltd. All rights reserved
DMCA.com Protection Status Website Feedback