Nuclear Power Plant Equipment Market

Nuclear Power Plant Equipment Market by Reactor Type (Pressurized Water Reactor (PWR), Pressurized Heavy Water Reactor (PHWR), Boiling Water Reactor (BWR)), Equipment Type (Island Equipment, Auxiliary Equipment) Region - Global Forecast to 2027

Report Code: EP 2508 Jan, 2023, by marketsandmarkets.com

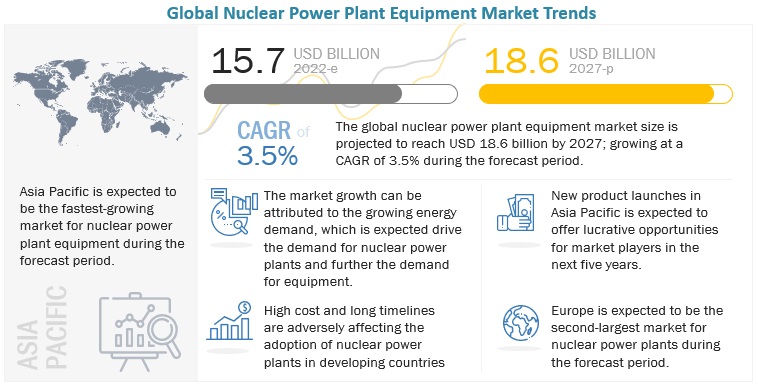
[155 Pages Report] The global nuclear power plant equipment market in terms of revenue was estimated to be worth USD 15.7 billion in 2022 and is poised to reach USD 18.6 billion by 2027, growing at a CAGR of 3.5% from 2022 to 2027. Growing demand of Energy for high performance is driving the nuclear power plant equipment market.
Nuclear Power Plant Equipment Market

To know about the assumptions considered for the study, Request for Free Sample Report

Nuclear Power Plant Equipment Market Dynamics

Driver: Growing demand for clean energy

Nuclear energy as clean energy is a more reliable way of producing electricity on a large scale. The versatile nature of nuclear energy could enable the transition to a cleaner world and a stronger global economy. In recent decades, clean energy sources have witnessed rapid innovations and cost reductions. Solar photovoltaic, wind power, hydropower, dispatchable geothermal (both deep and shallow), biomass, and concentrating solar power have experienced rapid technological and economic advances in the last decade. Nuclear energy has the potential to be coupled with several other energy sources in a synergistic fashion, which could result in integrated systems that are more than the sum of their parts. It produces energy by fission, which is the splitting of uranium atoms to release energy. Without the toxic consequences that come from burning fossil fuels, electricity is produced using the heat from fission to produce steam, which turns a turbine.

Restraints: Long Construction period and high cost of construction

The capital costs involved in nuclear power plants include the cost of site selection, construction, manufacturing, contracting, and finance. A large-scale nuclear reactor requires thousands of personnel to build enormous quantities of steel and concrete, thousands of parts, and several systems that provide electricity, cooling, ventilation, information control, and communication., The capital cost required is very high compared to alternative power generation technologies such as solar and wind. For coal power plants, it costs 1.88 cents to produce 1 kilowatt hour of energy, while for fossil fuel energy generation, the cost of building and operating a fossil fuel power plant is lower than that of a nuclear power plant. In Europe and the US, nuclear power plant construction cost is between USD 5,500/kW and USD 8000/kW roughly between USD 6 billion and USD 9 billion for each 1,100 MW plant. On the other hand, solar power plants cost about USD 2000/kW. Hence, the high cost has become a major restraining factor for the nuclear industry.

Opportunities: Rising need for sustainability and decarbonization globally

The world would need to harness all low-carbon energy sources to control greenhouse gas (GHG) emissions and limit the increase of global mean surface temperature to below 2° C relative to pre-industrial levels by the end of the century. Nuclear power plants produce virtually no greenhouse gas emissions or air pollutants during their operation and emit very low emissions over their entire life cycle. Fundamentally, nuclear energy for sustainable development is robust owing to its scalability and energy density. Along with hydropower and wind energy, nuclear power produces low GHG emissions per unit of electricity generated on a life cycle basis, including construction, operation, decommissioning, and waste management. On a life cycle basis, nuclear energy emits only a few grams of CO2 /kWh compared to 800 grams of CO2/kWh emission from coal. These advantages of nuclear energy help achieve sustainability and decarbonization goals across the energy sector.

Challenges: High cost of storage, transportation, and disposal of used fuel

Globally, 400,000 tons of spent nuclear fuel is produced from civil nuclear power plants. Several institutions worry about the transportation, storage, and disposal of nuclear waste because they see it as an increasing concern for the local environment ecosystem and is a financial burden for them. To facilitate the storage, transportation, and disposal of used fuels, companies or governments must spend a huge amount.

For example, in the US, 86,000 tons -of used nuclear fuel, which is currently being stored at a number of facilities across 34 states, will eventually have to be disposed. It costs ~USD 600/kg to store and then dispose spent nuclear fuel. The US government spends USD 6 billion each year for the disposal of nuclear waste. The project’s cost of clean-up for the Manhattan project is projected to be around USD 300 billion. Additionally, the government is creating brand-new, particularly made railcars to support future large-scale used fuel transportation. Hence the high cost of storage, transportation, and disposal of used fuels poses a significant challenge to the further growth of the nuclear industry.

Asia Pacific is expected to dominate the global nuclear power plant equipment market.

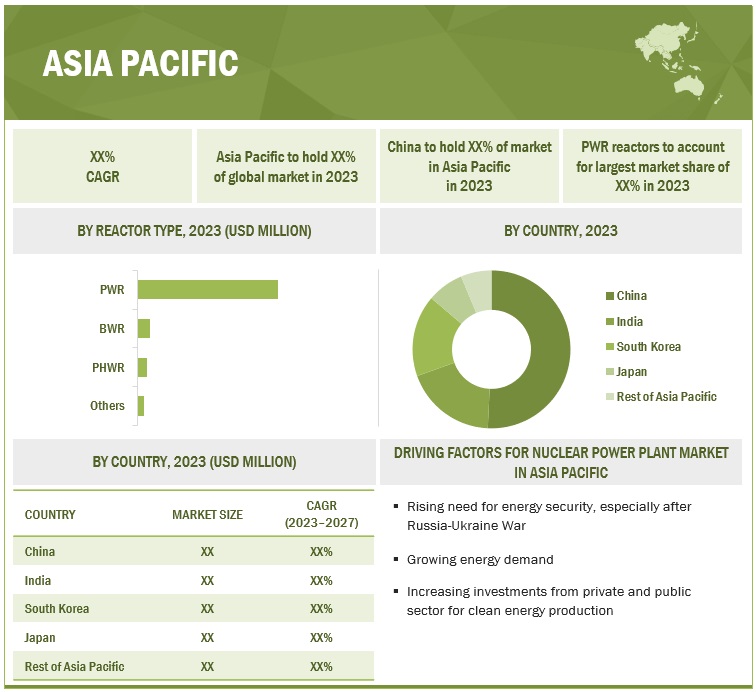
Asia Pacific accounted for the largest market share in 2021. It is also the fastest-growing market during the forecast period. Asia Pacific dominated the Nuclear power plant equipment market in 2021 and is likely to continue its dominance during the forecasted period as well. It is one of the principal geographical areas in the world where nuclear power is expanding significantly. In Asia Pacific, there are ~140 operational nuclear power plants and 30–35 plants are under construction. The major nations in the region also have plans to develop an additional 60 to 70 reactors over the next few years. China produces 52 GW of nuclear power through its 54 reactors, 22 (24.7 GW) are under construction, and 42 (46.1 GW) are planned. China has the strong project pipeline in the world further strengthening the outlook toward the market in the country.
Nuclear Power Plant Equipment Market Size, and Share

To know about the assumptions considered for the study, download the pdf brochure

Key Market Players

The major players in the global Nuclear power plant equipment market are General Electric (US), Mitsubishi Heavy Industries (Japan), Shanghai Electric (China), Toshiba Energy System & Solutions Corporation (Japan), Doosan Corporation (South Korea).

Get online access to the report on the World's First Market Intelligence Cloud

  • Easy to Download Historical Data & Forecast Numbers
  • Company Analysis Dashboard for high growth potential opportunities
  • Research Analyst Access for customization & queries
  • Competitor Analysis with Interactive dashboard
  • Latest News, Updates & Trend analysis
Request Sample

Scope of the Report

Report Metrics

Details

Market Size available for years 2019–2027
Base year considered 2021
Forecast period 2023–2027
Forecast units Value (USD)
Segments covered Equipment Type, reactor type and region.
Geographies covered Asia Pacific, Americas, Europe, and Middle East & Africa
Companies covered Westinghouse Electric Corporation (US), NuScale Power, LLC. (US), GE Hitachi Nuclear Energy (US), General Electric(US),Terrestrial Energy Inc.(Canada), Toshiba Corporation(Japan), Mitsubishi Heavy Industries LTD,(Japan), LARSEN & TOUBRO LIMITED (India), Dongfang Electric Corporation(China), BWX technologies,Inc.(US),Babcock and Wilcox (US), Areva SA (France), The State Atomic Energy Corporation (US), EDF (France), Atomstroyexport JSC (Russia), AEM-technology (Russia), China General Nuclear Power Group (US), Exelon Corporation (US)

This research report categorizes the market based on reactor type, Equipment type and region.

Based on Reactor Type, the Nuclear power plant equipment market has been segmented as follows:
  • Pressurized Water reactor (PWR)
  • Boiling water Reactor (BWR)
  • Pressurized Heavy water Reactor(PHWR)
  • Advanced reactor
    • Fast breeder reactor (FBR)
    • Reactor Bolshoy Moschnosti Kanalniy (RBMK)
    • Pebble-bed reactors (PBR)
Based on Equipment, the market has been segmented as follows:
  • Island Equipment
  • Auxiliary Equipment
Based on the region, the market has been segmented as follows:
  • Americas
  • Asia Pacific
  • Europe
  • Middle East & Africa

Recent Developments

  • In February 2022, GE agreed to sell nuclear power activities part to Electricite de France. Nuclear power is the generation of electricity through nuclear reactions. Nuclear fission, nuclear decay, and nuclear fusion reactions can all produce power. Currently, the great majority of nuclear power electricity is generated through nuclear fission of uranium and plutonium in nuclear power plants.
  • In June 2022, The US Department of Défense awarded BWX a contract to construct the nation's first cutting-edge nuclear microreactor.
  • In November 2022, GE entered into an agreement to sell GE Steam Power’s nuclear activities to EDF. EDF signs deal to acquire GE Steam Power's nuclear activities. The transaction also covers steam turbine technology such as the European pressurized reactors and compact modular reactors. The activities of GE Steam Power involve the production of conventional island equipment for the new nuclear power plants.
  • In April 2021, The U.S. Naval Nuclear Propulsion Program awarded BWX a contract worth US$2.2 billion to produce the parts and fuel for naval nuclear reactors.
  • In October 2021, A teaming agreement has been made between GE Hitachi Nuclear Energy (GEH) and BWXT Canada Ltd. (BWXT Canada) to work together on engineering and procurement to support the design, production, and commercialization of the BWRX-300 compact modular reactor.

Frequently Asked Questions (FAQ):

To speak to our analyst for a discussion on the above findings, click Speak to Analyst

TABLE OF CONTENTS
 
1 INTRODUCTION (Page No. - 20)
    1.1 STUDY OBJECTIVES 
    1.2 MARKET DEFINITION 
           1.2.1 INCLUSIONS AND EXCLUSIONS
    1.3 MARKET SCOPE 
           1.3.1 MARKETS COVERED
           1.3.2 REGIONAL SCOPE
           1.3.3 YEARS CONSIDERED
    1.4 CURRENCY CONSIDERED 
    1.5 LIMITATIONS 
    1.6 STAKEHOLDERS 
    1.7 SUMMARY OF CHANGES 
 
2 RESEARCH METHODOLOGY (Page No. - 25)
    2.1 RESEARCH DATA 
           FIGURE 1 NUCLEAR POWER PLANT EQUIPMENT MARKET: RESEARCH DESIGN
           2.1.1 SECONDARY DATA
                    2.1.1.1 Key data from secondary sources
           2.1.2 PRIMARY DATA
                    2.1.2.1 Key data from primary sources
                               FIGURE 2 KEY INDUSTRY INSIGHTS
                    2.1.2.2 Breakdown of primaries
                               FIGURE 3 BREAKDOWN OF PRIMARY INTERVIEWS: BY COMPANY TYPE, DESIGNATION, AND REGION
    2.2 DATA TRIANGULATION 
           FIGURE 4 DATA TRIANGULATION
    2.3 MARKET SIZE ESTIMATION 
           2.3.1 BOTTOM-UP APPROACH
                    FIGURE 5 MARKET SIZE ESTIMATION METHODOLOGY: BOTTOM-UP APPROACH
           2.3.2 TOP-DOWN APPROACH
                    FIGURE 6 MARKET SIZE ESTIMATION METHODOLOGY: TOP-DOWN APPROACH
           2.3.3 DEMAND-SIDE ANALYSIS
                    FIGURE 7 DEMAND-SIDE CALCULATION
                    FIGURE 8 METRICS CONSIDERED FOR ANALYZING AND ASSESSING DEMAND FOR NUCLEAR POWER PLANT EQUIPMENT
                    2.3.3.1 Assumptions for demand-side analysis
           2.3.4 FORECAST
    2.4 RECESSION IMPACT 
 
3 EXECUTIVE SUMMARY (Page No. - 34)
    TABLE 1 NUCLEAR POWER PLANT EQUIPMENTS MARKET: SNAPSHOT 
    FIGURE 9 ASIA PACIFIC DOMINATED MARKET IN 2021 
    FIGURE 10 PWR SEGMENT TO ACCOUNT FOR LARGEST SHARE OF MARKET, BY REACTOR TYPE, FROM 2023 TO 2027 
    FIGURE 11 ISLAND EQUIPMENT TO ACCOUNT FOR LARGER SHARE OF MARKET, BY EQUIPMENT TYPE, FROM 2023 TO 2027 
 
4 PREMIUM INSIGHTS (Page No. - 37)
    4.1 ATTRACTIVE OPPORTUNITIES FOR NUCLEAR POWER PLANT EQUIPMENT MARKET PLAYERS 
           FIGURE 12 GROWING NUMBER OF NUCLEAR POWER PLANTS TO DRIVE MARKET DURING 2023–2027
    4.2 NUCLEAR POWER PLANT EQUIPMENTS MARKET, BY REGION 
           FIGURE 13 MARKET IN ASIA PACIFIC TO GROW AT HIGHEST CAGR DURING FORECAST PERIOD
    4.3 MARKET, BY REACTOR TYPE 
           FIGURE 14 PWR SEGMENT TO ACCOUNT FOR LARGEST MARKET SHARE, BY REACTOR TYPE, IN 2027
    4.4 MARKET, BY EQUIPMENT TYPE 
           FIGURE 15 ISLAND EQUIPMENT SEGMENT ACCOUNTED FOR LARGER MARKET SHARE, BY EQUIPMENT TYPE, IN 2021
    4.5 MARKET IN ASIA PACIFIC, BY REACTOR TYPE AND COUNTRY 
           FIGURE 16 PWR AND CHINA WERE LARGEST SHAREHOLDERS IN MARKET IN ASIA PACIFIC IN 2021
 
5 MARKET OVERVIEW (Page No. - 40)
    5.1 INTRODUCTION 
    5.2 MARKET DYNAMICS 
           FIGURE 17 NUCLEAR POWER PLANT EQUIPMENT MARKET: DRIVERS, RESTRAINTS, OPPORTUNITIES, AND CHALLENGES
           5.2.1 DRIVERS
                    5.2.1.1 Growing demand for clean energy
                               FIGURE 18 GLOBAL ENERGY MIX, BY SOURCE, 2020
                    5.2.1.2 Rising need for energy security
           5.2.2 RESTRAINTS
                    5.2.2.1 Long construction period and high cost of construction
                    5.2.2.2 Negative public perception toward nuclear energy
           5.2.3 OPPORTUNITIES
                    5.2.3.1 Rising need for sustainability and decarbonization globally
           5.2.4 CHALLENGES
                    5.2.4.1 High cost of storage, transportation, and disposal of used fuel
    5.3 COVID-19 IMPACT 
    5.4 PRICING ANALYSIS 
           5.4.1 CAPEX OF NUCLEAR POWER PLANT EQUIPMENT PROJECTS, BY COUNTRY
    5.5 SUPPLY CHAIN ANALYSIS 
           FIGURE 19 MARKET: SUPPLY CHAIN ANALYSIS
           5.5.1 COMPONENT MANUFACTURERS
           5.5.2 REACTOR MANUFACTURERS
           5.5.3 EQUIPMENT SUPPORT SERVICE PROVIDERS/INTEGRATORS
           5.5.4 END-USERS
    5.6 KEY CONFERENCES AND EVENTS, 2022–2023 
           TABLE 2 MARKET: LIST OF CONFERENCES AND EVENTS
    5.7 NUCLEAR POWER PLANT EQUIPMENTS MARKET: REGULATIONS 
           5.7.1 REGULATORY BODIES, GOVERNMENT AGENCIES, AND OTHER ORGANIZATIONS
                    TABLE 3 NORTH AMERICA: LIST OF REGULATORY BODIES, GOVERNMENT AGENCIES, AND OTHER ORGANIZATIONS
                    TABLE 4 EUROPE: LIST OF REGULATORY BODIES, GOVERNMENT AGENCIES, AND OTHER ORGANIZATIONS
                    TABLE 5 ASIA PACIFIC: LIST OF REGULATORY BODIES, GOVERNMENT AGENCIES, AND OTHER ORGANIZATIONS
                    TABLE 6 GLOBAL: LIST OF REGULATORY BODIES, GOVERNMENT AGENCIES, AND OTHER ORGANIZATIONS
           5.7.2 STANDARDS AND REGULATIONS
                    TABLE 7 MARKET: STANDARDS AND REGULATIONS
    5.8 PORTER’S FIVE FORCES ANALYSIS 
           FIGURE 20 PORTER’S FIVE FORCES ANALYSIS FOR MARKET
           TABLE 8 NUCLEAR POWER PLANT EQUIPMENT MARKET: PORTER’S FIVE FORCES ANALYSIS
           5.8.1 THREAT OF SUBSTITUTES
           5.8.2 BARGAINING POWER OF SUPPLIERS
           5.8.3 BARGAINING POWER OF BUYERS
           5.8.4 THREAT OF NEW ENTRANTS
           5.8.5 INTENSITY OF COMPETITIVE RIVALRY
    5.9 TECHNOLOGY ANALYSIS 
    5.10 TRADE ANALYSIS 
           5.10.1 EXPORT SCENARIO
                    TABLE 9 EXPORT SCENARIO FOR HS CODE: 840110, BY COUNTRY, 2017–2021 (USD MILLION)
                    FIGURE 21 EXPORT DATA FOR TOP 5 COUNTRIES, 2017–2021 (USD THOUSAND)
           5.10.2 IMPORT SCENARIO
                    TABLE 10 IMPORT SCENARIO FOR HS CODE: 840110, BY COUNTRY, 2017–2021 (USD MILLION)
                    FIGURE 22 IMPORT DATA FOR TOP 5 COUNTRIES, 2017–2021 (USD THOUSAND)
    5.11 TRENDS/DISRUPTIONS IMPACTING CUSTOMER BUSINESS 
           5.11.1 REVENUE SHIFT AND NEW REVENUE POCKETS FOR MARKET PLAYERS
                    FIGURE 23 REVENUE SHIFT OF NUCLEAR POWER PLANT EQUIPMENT PROVIDERS
    5.12 KEY STAKEHOLDERS AND BUYING CRITERIA 
           5.12.1 KEY STAKEHOLDERS IN BUYING PROCESS
                    FIGURE 24 INFLUENCE OF STAKEHOLDERS ON BUYING PROCESS FOR EQUIPMENT AND REACTORS
                    TABLE 11 INFLUENCE OF STAKEHOLDERS ON BUYING PROCESS FOR EQUIPMENT AND REACTORS (%)
           5.12.2 BUYING CRITERIA
                    FIGURE 25 KEY BUYING CRITERIA FOR REACTOR TYPE AND EQUIPMENT TYPE
                    TABLE 12 KEY BUYING CRITERIA FOR EQUIPMENT AND REACTOR SEGMENT
    5.13 PATENT ANALYSIS 
 
6 NUCLEAR POWER PLANT EQUIPMENT MARKET, BY REACTOR TYPE (Page No. - 63)
    6.1 INTRODUCTION 
           FIGURE 26 NUCLEAR POWER PLANT EQUIPMENT MARKET SHARE, BY REACTOR TYPE (2021)
           TABLE 13 GLOBAL: MARKET, BY REACTOR TYPE, 2019–2027 (USD MILLION)
    6.2 PWR 
           6.2.1 PWR ACCOUNTED FOR LARGEST MARKET SHARE IN 2021
                    TABLE 14 PWR: MARKET, BY REGION, 2019–2027 (USD MILLION)
    6.3 PHWR 
           6.3.1 CANADA LARGEST OPERATOR OF PHWR REACTORS
                    TABLE 15 PHWR: MARKET, BY REGION, 2019–2027 (USD MILLION)
    6.4 BWR 
           6.4.1 JAPAN AND US HAVE MOST NUMBER OF BWRS UNDER OPERATIONS
                    TABLE 16 BWR: MARKET, BY REGION, 2019–2027 (USD MILLION)
    6.5 OTHERS 
           6.5.1 RBMK
           6.5.2 PBR
           6.5.3 AES 91, AES 92, AES 2006
                    TABLE 17 OTHERS: MARKET, BY REGION, 2019–2027 (USD MILLION)
 
7 NUCLEAR POWER PLANT EQUIPMENT MARKET, BY EQUIPMENT TYPE (Page No. - 68)
    7.1 INTRODUCTION 
           FIGURE 27 ISLAND EQUIPMENT TO HOLD LARGER SHARE OF MARKET IN 2027
           TABLE 18 GLOBAL: MARKET, BY EQUIPMENT TYPE, 2019–2027 (USD MILLION)
    7.2 ISLAND EQUIPMENT 
           7.2.1 ISLAND EQUIPMENT TO ACCOUNT FOR LARGER MARKET SHARE IN 2027
           7.2.2 CRDM
           7.2.3 REACTOR VESSEL INTERNAL
           7.2.4 STEAM GENERATOR
                    TABLE 19 ISLAND EQUIPMENT: MARKET, BY REGION, 2019–2027 (USD MILLION)
    7.3 AUXILIARY EQUIPMENT 
           7.3.1 ASIA PACIFIC TO BE LARGEST MARKET FOR AUXILIARY EQUIPMENT GLOBALLY IN 2027
           7.3.2 PMC
           7.3.3 RHR
           7.3.4 RHM/RVM
           7.3.5 NUCLEAR ISLAND ASP CONDENSER
           7.3.6 ACCUMULATION TANK
           7.3.7 NORMAL RESIDUAL HEAT REMOVAL HEAT EXCHANGER
                    TABLE 20 AUXILIARY EQUIPMENT: MARKET, BY REGION, 2019–2027 (USD MILLION)
 
8 NUCLEAR POWER PLANT EQUIPMENT MARKET, BY REGION (Page No. - 73)
    8.1 INTRODUCTION 
           FIGURE 28 ASIA PACIFIC TO BE FASTEST-GROWING MARKET DURING FORECAST PERIOD
           TABLE 21 MARKET, BY REGION, 2019–2027 (USD MILLION)
    8.2 ASIA PACIFIC 
           8.2.1 IMPACT OF RECESSION ON ASIA PACIFIC
                    FIGURE 29 ASIA PACIFIC: NUCLEAR POWER PLANT EQUIPMENT MARKET SNAPSHOT
                    TABLE 22 ASIA PACIFIC: MARKET, BY COUNTRY, 2019–2027 (USD MILLION)
                    TABLE 23 ASIA PACIFIC: MARKET, BY REACTOR TYPE, 2019–2027 (USD MILLION)
                    TABLE 24 ASIA PACIFIC: MARKET, BY EQUIPMENT TYPE, 2019–2027 (USD MILLION)
           8.2.2 CHINA
                    8.2.2.1 China to install largest nuclear power capacity in coming years
                               TABLE 25 CHINA: MARKET, BY REACTOR TYPE, 2019–2027 (USD MILLION)
           8.2.3 JAPAN
                    8.2.3.1 Japan has set target for nuclear power to account for 20–22% of its electricity supply by 2030
                               TABLE 26 JAPAN: MARKET, BY REACTOR TYPE, 2019–2027 (USD MILLION)
           8.2.4 INDIA
                    8.2.4.1 India to build 63 GW of nuclear power plants by 2032
                               TABLE 27 INDIA: MARKET, BY REACTOR TYPE, 2019–2027 (USD MILLION)
           8.2.5 SOUTH KOREA
                    8.2.5.1 South Korea’s one-third electricity comes from nuclear power
                               TABLE 28 SOUTH KOREA: MARKET, BY REACTOR TYPE, 2019–2027 (USD MILLION)
           8.2.6 REST OF ASIA PACIFIC
                    TABLE 29 REST OF ASIA PACIFIC: MARKET, BY REACTOR TYPE, 2019–2027 (USD MILLION)
    8.3 EUROPE 
           8.3.1 IMPACT OF RECESSION ON EUROPE
                    FIGURE 30 EUROPE: NUCLEAR POWER PLANT EQUIPMENT MARKET SNAPSHOT
                    TABLE 30 EUROPE: MARKET, BY COUNTRY, 2019–2027 (USD MILLION)
                    TABLE 31 EUROPE: MARKET, BY REACTOR TYPE, 2019–2027 (USD MILLION)
                    TABLE 32 EUROPE: MARKET, BY EQUIPMENT TYPE, 2019–2027 (USD MILLION)
           8.3.2 UK
                    8.3.2.1 UK to set up more than 3 GW of nuclear power plants in coming years
                               TABLE 33 UK: MARKET, BY REACTOR TYPE, 2019–2027 (USD MILLION)
           8.3.3 FRANCE
                    8.3.3.1 France to be largest producer of nuclear power in Europe in coming years
                               TABLE 34 FRANCE: MARKET, BY REACTOR TYPE, 2019–2027 (USD MILLION)
           8.3.4 RUSSIA
                    8.3.4.1 Russia to develop three PWR and one FBR reactor for nuclear power plants in coming years
                               TABLE 35 RUSSIA: MARKET, BY REACTOR TYPE, 2019–2027 (USD MILLION)
           8.3.5 REST OF EUROPE
                    TABLE 36 REST OF EUROPE: MARKET, BY REACTOR TYPE, 2019–2027 (USD MILLION)
    8.4 AMERICAS 
           8.4.1 IMPACT OF RECESSION ON AMERICAS
                    FIGURE 31 AMERICAS: NUCLEAR POWER PLANT EQUIPMENT MARKET SNAPSHOT
                    TABLE 37 AMERICAS: MARKET, BY COUNTRY, 2019–2027 (USD MILLION)
                    TABLE 38 AMERICAS: MARKET, BY REACTOR TYPE, 2019–2027 (USD MILLION)
                    TABLE 39 AMERICAS: MARKET, BY EQUIPMENT TYPE, 2019–2027 (USD MILLION)
           8.4.2 US
                    8.4.2.1 US to hold largest market share in Americas in 2027
                               TABLE 40 US: MARKET, BY REACTOR TYPE, 2019–2027 (USD MILLION)
           8.4.3 BRAZIL
                    8.4.3.1 Brazil projected to install 1370 MW of nuclear power
                               TABLE 41 BRAZIL: MARKET, BY REACTOR TYPE, 2019–2027 (USD MILLION)
           8.4.4 REST OF AMERICAS
                    TABLE 42 REST OF AMERICAS: MARKET, BY REACTOR TYPE, 2019–2027 (USD MILLION)
    8.5 MIDDLE EAST & AFRICA 
           8.5.1 IMPACT OF RECESSION ON MIDDLE EAST & AFRICA
                    TABLE 43 MIDDLE EAST & AFRICA: NUCLEAR POWER PLANT EQUIPMENT MARKET, BY COUNTRY, 2019–2027 (USD MILLION)
                    TABLE 44 MIDDLE EAST & AFRICA: MARKET, BY REACTOR TYPE, 2019–2027 (USD MILLION)
                    TABLE 45 MIDDLE EAST & AFRICA: MARKET, BY EQUIPMENT TYPE, 2019–2027 (USD MILLION)
           8.5.2 UAE
                    8.5.2.1 UAE to be largest market for nuclear power plant equipment in 2027
                               TABLE 46 UAE: MARKET, BY REACTOR TYPE, 2019–2027 (USD MILLION)
           8.5.3 TURKEY
                    8.5.3.1 Turkey to install three PWR nuclear reactors during forecast period
                               TABLE 47 TURKEY: MARKET, BY REACTOR TYPE, 2019–2027 (USD MILLION)
           8.5.4 REST OF MIDDLE EAST & AFRICA
                    TABLE 48 REST OF MIDDLE EAST & AFRICA: MARKET, BY REACTOR TYPE, 2019–2027 (USD MILLION)
 
9 COMPETITIVE LANDSCAPE (Page No. - 96)
    9.1 OVERVIEW 
           TABLE 49 KEY DEVELOPMENTS IN MARKET, 2019 TO 2022
    9.2 RANKING ANALYSIS OF KEY PLAYERS IN NUCLEAR POWER PLANT EQUIPMENTS MARKET 
           FIGURE 32 RANKING OF TOP FIVE MARKET PLAYERS
    9.3 MARKET EVALUATION FRAMEWORK 
           TABLE 50 MARKET EVALUATION FRAMEWORK, 2019–2022
    9.4 RECENT DEVELOPMENTS 
           9.4.1 DEALS
                    TABLE 51 MARKET: DEALS, 2018–2022
           9.4.2 OTHERS
                    TABLE 52 NUCLEAR POWER PLANT & EQUIPMENT MARKET: OTHERS, 2019–2022
    9.5 COMPETITIVE LEADERSHIP AND MAPPING 
           9.5.1 STARS
           9.5.2 EMERGING LEADERS
           9.5.3 PERVASIVE PLAYERS
           9.5.4 PARTICIPANTS
                    FIGURE 33 MARKET: COMPETITIVE LEADERSHIP MAPPING, 2021
                    TABLE 53 COMPANY REACTOR TYPE FOOTPRINT
                    TABLE 54 COMPANY REGION FOOTPRINT
 
10 COMPANY PROFILES (Page No. - 108)
     10.1 KEY PLAYERS 
(Business Overview, Products/Solutions/Services Offered, Recent Developments, and MnM View)*
             10.1.1 GENERAL ELECTRIC
                       TABLE 55 GENERAL ELECTRIC: COMPANY OVERVIEW
                       FIGURE 34 GENERAL ELECTRIC: COMPANY SNAPSHOT
                       TABLE 56 GENERAL ELECTRIC: PRODUCT OFFERINGS
                       TABLE 57 GENERAL ELECTRIC: DEALS
             10.1.2 SHANGHAI ELECTRIC
                       TABLE 58 SHANGHAI ELECTRIC: COMPANY OVERVIEW
                       FIGURE 35 SHANGHAI ELECTRIC: COMPANY SNAPSHOT
                       TABLE 59 SHANGHAI ELECTRIC: PRODUCT OFFERINGS
             10.1.3 TOSHIBA ENERGY SYSTEMS & SOLUTIONS CORPORATION
                       TABLE 60 TOSHIBA ENERGY SYSTEMS & SOLUTIONS CORPORATION: COMPANY OVERVIEW
                       FIGURE 36 TOSHIBA ENERGY SYSTEMS & SOLUTIONS CORPORATION: COMPANY SNAPSHOT
                       TABLE 61 TOSHIBA ENERGY SYSTEMS & SOLUTIONS CORPORATION: PRODUCT OFFERINGS
                       TABLE 62 TOSHIBA ENERGY SYSTEMS & SOLUTIONS CORPORATION: PRODUCT LAUNCHES
                       TABLE 63 TOSHIBA ENERGY SYSTEMS & SOLUTIONS CORPORATION: DEALS
             10.1.4 MITSUBISHI HEAVY INDUSTRIES, LTD
                       TABLE 64 MITSUBISHI HEAVY INDUSTRIES, LTD: COMPANY OVERVIEW
                       FIGURE 37 MITSUBISHI HEAVY INDUSTRIES, LTD: COMPANY SNAPSHOT
                       TABLE 65 MITSUBISHI HEAVY INDUSTRIES, LTD: PRODUCT OFFERINGS
                       TABLE 66 MITSUBISHI HEAVY INDUSTRIES, LTD: PRODUCT LAUNCHES
             10.1.5 LARSEN & TOUBRO LIMITED
                       TABLE 67 LARSEN & TOUBRO: COMPANY OVERVIEW
                       FIGURE 38 LARSEN& TOUBRO LIMITED: COMPANY SNAPSHOT
                       TABLE 68 LARSEN & TOUBRO LIMITED: PRODUCT OFFERINGS
             10.1.6 DONGFANG ELECTRIC CORPORATION
                       TABLE 69 DONGFANG ELECTRIC CORPORATION: COMPANY OVERVIEW
             10.1.7 DOOSAN CORPORATION
                       TABLE 70 DOOSAN CORPORATION: COMPANY OVERVIEW
                       FIGURE 39 DOOSAN CORPORATION: COMPANY SNAPSHOT
                       TABLE 71 DOOSAN CORPORATION: PRODUCT OFFERINGS
             10.1.8 TERRESTRIAL ENERGY INC.
                       TABLE 72 TERRESTRIAL ENERGY INC.: BUSINESS OVERVIEW
                       TABLE 73 TERRESTRIAL ENERGY INC.: PRODUCTS OFFERED
                       TABLE 74 TERRESTRIAL ENERGY INC.: DEALS
                       TABLE 75 TERRESTRIAL ENERGY INC.: OTHERS
             10.1.9 BWX TECHNOLOGIES, INC.
                       TABLE 76 BWX TECHNOLOGIES, INC.: COMPANY OVERVIEW
                       FIGURE 40 BWX CORPORATION, INC: COMPANY SNAPSHOT
                       TABLE 77 BWX CORPORATION: RECENT DEVELOPMENTS
             10.1.10 NUSCALE POWER, LLC.
                       TABLE 78 NUSCALE POWER, LLC.: BUSINESS OVERVIEW
                       TABLE 79 NUSCALE POWER, LLC.: PRODUCTS OFFERED
                       TABLE 80 NUSCALE POWER, LLC.: DEALS
                       TABLE 81 NUSCALE POWER, LLC.: OTHERS
* Business Overview, Products/Solutions/Services Offered, Recent Developments, and MnM View might not be captured in case of unlisted companies.
     10.2 OTHER PLAYERS 
             10.2.1 BABCOCK & WILCOX
             10.2.2 AREVA SA
             10.2.3 HITACHI-GE NUCLEAR ENERGY, LTD.
             10.2.4 WESTINGHOUSE ELECTRIC CORPORATION
             10.2.5 THE STATE ATOMIC ENERGY CORPORATION (ROSATOM)
             10.2.6 EDF
             10.2.7 ATOMSTROYEXPORT JSC
             10.2.8 AEM-TECHNOLOGY
             10.2.9 CHINA GENERAL NUCLEAR POWER GROUP
             10.2.10 EXELON CORPORATION
 
11 APPENDIX (Page No. - 148)
     11.1 INSIGHTS OF INDUSTRY EXPERTS 
     11.2 DISCUSSION GUIDE 
     11.3 KNOWLEDGESTORE: MARKETSANDMARKETS’ SUBSCRIPTION PORTAL 
     11.4 CUSTOMIZATION OPTIONS 
     11.5 RELATED REPORTS 
     11.6 AUTHOR DETAILS 

This study involved two major activities in estimating the current size of the Nuclear Power plant equipment market. Exhaustive secondary research was done to collect information on the market, peer market, and parent market. The next step was to validate these findings, assumptions, and market sizing with industry experts across the value chain through primary research. Both top-down and bottom-up approaches were used to estimate the total market size. After that, the market breakdown and data triangulation were done to estimate the market size of the segments and sub-segments.

Secondary Research

The research study on the market involved the extensive use of secondary sources referred to for this research study include press releases, white papers, certified publications, articles by recognized authors, directories, and databases of various companies and associations. Secondary research was used to obtain key information about the supply chain of the industry, key players offering various nuclear power plant equipment components, market classification, and segmentation according to the offerings of the leading players along with the industry trends to the bottommost level, regional markets, and key developments from the market- and technology-oriented perspectives.

Primary Research

In the primary research process, primary sources from the supply side were interviewed to obtain qualitative and quantitative information for this report. Primary sources from the supply side included industry experts such as chief executive officers (CEO), assistant general managers, nuclear design engineers, R&D test engineers, project officers, business development managers, and related key executives from various companies and organizations operating in the nuclear power plant equipment market. In the complete market engineering process, top-down and bottom-up approaches were extensively used, along with several data triangulation methods, to perform the market size estimations and forecasts for all segments and subsegments listed in this report. Extensive qualitative and quantitative analyses were conducted to complete the market engineering process to list key information/insights throughout the report.

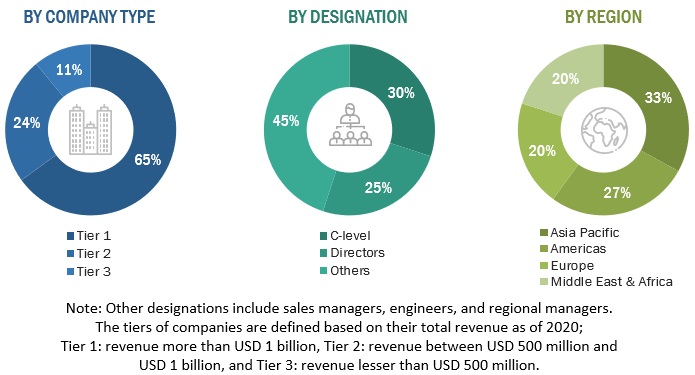
The breakdown of primary respondents is given below:
Nuclear Power Plant Equipment Market Size, and Share

To know about the assumptions considered for the study, download the pdf brochure

Note: Other designations include sales managers, engineers, and regional managers. The tiers of companies are defined based on their total revenue as of 2020; Tier 1: revenue more than USD 1 billion, Tier 2: revenue between USD 500 million and USD 1 billion, and Tier 3: revenue lesser than USD 500 million.

Market Size Estimation

Top-down and bottom-up approaches were used to estimate and validate the size of the market and its dependent submarkets. The key players in the market were identified through secondary research. The research methodology included the study of the top market players and interviews with industry experts, such as chief executive officers (CEO), assistant general managers, nuclear design engineers, R&D test engineers, project officers, and business development managers, for key quantitative and qualitative insights related to the nuclear power plant equipment market. The following sections provide details about the overall market size estimation process employed in this study.

  • The key players in the industry and market have been identified through extensive secondary research.
  • The industry’s supply chain and market size, in terms of value, have been determined through primary and secondary research processes.
  • All percentage shares, splits, and breakdowns have been determined using secondary sources and verified through primary sources.

Global Nuclear Power plant & Equipment Market Size: Bottom-Up Approach

Nuclear Power Plant Equipment Market Size, and Share

To know about the assumptions considered for the study, Request for Free Sample Report

Data Triangulation

After arriving at the overall market size from the estimation process explained below, the total market has been split into several segments and subsegments. Data triangulation procedure has been employed, wherever applicable, to complete the overall market engineering process and arrive at the exact statistics for all the segments and subsegments. The data has been triangulated by studying various factors and trends from the demand side. Along with this, the market size has been validated using top-down and bottom-up approaches.

Report Objectives

  • To define and describe the market, based on equipment type and reactor type, in terms of value.
  • To provide detailed information on the major factors influencing the growth of the market (drivers, restraints, opportunities, and challenges).
  • To estimate the market size in terms of value.
  • To strategically analyze micromarkets1 with respect to individual growth trends, future expansions, and their contributions to the overall nuclear power plant equipment market.
  • To provide post-pandemic estimation for the market and analyze the impact of the pandemic on the market growth.
  • To analyze market opportunities for stakeholders and the competitive landscape for market leaders.
  • To forecast the growth of the market with respect to four key regions: the Americas, Europe, Asia Pacific, and the Middle East & Africa, along with their key countries.
  • To analyze competitive developments, such as investments & expansions, mergers & acquisitions, new product launches, contracts & agreements, and joint ventures & collaborations in the market.

Available Customizations:

With the given market data, MarketsandMarkets offers customizations as per the client’s specific needs. The following customization options are available for this report:

Regional Analysis

  • Further breakdown of region or country-specific analysis

Company Information

  • Detailed analyses and profiling of additional market players (up to 5)
Custom Market Research Services

We will customize the research for you, in case the report listed above does not meet with your exact requirements. Our custom research will comprehensively cover the business information you require to help you arrive at strategic and profitable business decisions.

Request Customization

Instant Answers with GPT - Ask Now!

Ask real questions. Get complete answers !
Report Code
EP 2508
Published ON
Jan, 2023
Choose License Type
BUY NOW
  • SHARE
X
Request Customization
Speak to Analyst
Speak to Analyst
OR FACE-TO-FACE MEETING
PERSONALIZE THIS RESEARCH
  • Triangulate with your Own Data
  • Get Data as per your Format and Definition
  • Gain a Deeper Dive on a Specific Application, Geography, Customer or Competitor
  • Any level of Personalization
REQUEST A FREE CUSTOMIZATION
LET US HELP YOU!
  • What are the Known and Unknown Adjacencies Impacting the Nuclear Power Plant Equipment Market
  • What will your New Revenue Sources be?
  • Who will be your Top Customer; what will make them switch?
  • Defend your Market Share or Win Competitors
  • Get a Scorecard for Target Partners
CUSTOMIZED WORKSHOP REQUEST
  • Call Us
  • +1-888-600-6441 (Corporate office hours)
  • +1-888-600-6441 (US/Can toll free)
  • +44-800-368-9399 (UK office hours)
CONNECT WITH US
ABOUT TRUST ONLINE
©2024 MarketsandMarkets Research Private Ltd. All rights reserved
DMCA.com Protection Status Website Feedback