[168 Pages Report] The global optical transceiver market size is expected to grow from USD 5.7 billion in 2020 to USD 9.2 billion by 2025, at a CAGR of 10.0%. Increasing adoption of smart devices and rising data traffic, growing demand for cloud computing applications, and rising demand for compact and energy-efficient transceivers are the factors driving the growth of the optical transceiver industry. The emerging focus on the 5G network, increasing demand for high data transfer capabilities, and expansion of telecom infrastructure in developing economies are likely to provide growth opportunities to the optical transceiver industry players during the forecast period.
The Quad small form-factor pluggable (QSFP) form factor of optical transceivers is designed for high performance and low power consumption, which makes them ideal for data center applications. With the advent of technological advancements such as AI, machine learning, and 5G communication, data traffic is increasing, which in turn is creating demand for high scale data centers. QSFP supports higher data rate transmissions such as 100G, 200G, and 400G, among others. Hence growing demand for high data rate transceivers would drive the growth of QSFP optical transceivers market during the forecast period.
Transitioning of high scale data centers towards the adoption of high data rate components, including transceivers for data communication owing to technological advancements, such as AI, machine learning, and 5G communications, is driving the growth of optical transceivers operating within 1 Km range. Data centers are operated for short distances and require a high data transmission rate for transferring huge packets of information. The increasing need for high-speed communication in data centers is also driving the market for high data rates optical transceivers such as 100G and 400G for less than 1 Km.
Optical transceiver market for data centers is expected to grow at the highest CAGR due to factors such as transitions towards cloud storage and increasing technological developments including machine learning, artificial intelligence, and deep learning which in turn increases data traffic across networks which create demand for high data rate transceivers for efficient data communication. Optical transceivers are used for either interconnect or intraconnect networks. Interconnect networks are used for connecting two or more data centers over short, medium, or long distances, with the help of high optical connectivity and components such as optical transceivers. The Intra-data center networks are those which are used for connecting networks within the data center. Usually, the range of data transmission is less than 1 Km but, sometime sit can range up to a maximum of 10 Km. Multimode fibers are mostly preferred for intra-data center connections.
The development of hyperscale data centers is also driving the growth of high data rate optical transceivers, such as 100G, 200G, and 400G for channeling huge packets of information in a short span. Moreover, leading cloud service providers such as Google, Amazon, and Microsoft are implementing high data rate transceivers in their data centers. Recent trends such as driverless vehicles, wireless communication, smart gaming, and entertainment devices, among others, are expected to increase data traffic across networks, which would drive the demand for high-speed optical transceivers to a great extent.
APAC is likely to grow at the highest CAGR for the optical transceiver industry from 20202025. The growing penetration of LTE and 5G technology in the region, increasing adoption of smart devices, expansion of telecom infrastructure, along with the development of data centers in APAC, is expected to drive the growth of the market.
The APAC region has become a global focal point for huge investments and business expansions. Asian markets encourage the development of 5G mobile technologies, with commercial deployments already implemented in South Korea and ready to be deployed in Japan and China by 2020. Along with that, the emergence of advanced technologies such as AI, IoT, and Big Data has paved the way for the implementation of large scale data center applications. Global giants such as Facebook, Amazon, Alibaba, and Baidu are expanding their data centers in Asian territory, which would further drive the growth of the market.
II-VI Incorporated (US), FIT Hong Teng Limited (Taiwan), Lumentum (US), Sumitomo Electric Industries Ltd (Japan), Accelink (China), Applied Optoelectronics (US), Fujitsu Optical Components (Japan), Innolight (China), Mellanox (Israel), NeoPhotonics (US), Ciena (US), Cisco (US), Hisense Broadband (China), Intel (US), NEC (Japan), Perle Systems (Canada), Reflex Photonics (Canada), Smartoptics (Norway), Solid Optics (US), and Source Photonics (US) are among the key players in the optical transceiver market
II-VI is among the leading suppliers of an optical transceiver with a broad product portfolio. II-VI develops, manufactures, and markets engineered materials and optoelectronic components and devices for precision in the field of industrial materials processing, optical communications, aerospace and defense, consumer electronics, semiconductor capital equipment, life sciences, and automotive applications and markets. II-VI Photonics manufactures crystal materials, optics, microchip lasers, and optoelectronic modules for use in optical communications networks and other diverse consumer, life sciences, and commercial applications. In September 2019, it announced the acquisition of Finisar Corporation, initiated in November 2018. Finisar Corporation, one of the market leaders in optical communications, provides components and subsystems to networking equipment manufacturers, data center operators, telecom service providers, consumer electronics, and automotive companies. With the acquisition of Finisar, it would help the company to strengthen its position in the optical communication business. Finisar is one of the companies for innovative and advanced optical transceivers, such as having 400G transceivers, which would benefit the company to expand its presence in the market. Furthermore, the advent of AI and 5G technologies would boost the optical transceiver market and help the company maximize its revenue by targeting these latent opportunities
Report Metric |
Details |
Market size available for years |
20172025 |
Base year |
2019 |
Forecast period |
20202025 |
Units |
Value (USD) |
Segments covered |
Form Factor, Wavelength, data rate, fiber type, distance, connector, and Application |
Geographic regions covered |
North America, APAC, Europe, and RoW |
Companies covered |
II-VI Incorporated (US), FIT Hong Teng Limited (Taiwan), Lumentum (US), Sumitomo Electric Industries Ltd (Japan), Accelink (China), Applied Optoelectronics (US), Fujitsu Optical Components (Japan), Innolight (China), Mellanox (Israel), NeoPhotonics (US), Ciena (US), Cisco (US), Hisense Broadband (China), Intel (US), NEC (Japan), Perle Systems (Canada), Reflex Photonics (Canada), Smartoptics (Norway), Solid Optics (US), and Source Photonics (US) |
This report categorizes the optical transceiver market based on form factor, wavelength, data rate, fiber type, distance, connector, and application, and region.
Which are the major applications of optical transceiver market? How huge is the opportunity for their growth in the next five years?
The data center market for the optical transceiver is expected to grow at highest CAGR due to factors such as transitions towards cloud storage and increasing technological developments including machine learning, artificial intelligence, and deep learning which in turn increases data traffic across networks which creates demand for high data rate transceivers for efficient data communication. The development of hyperscale data centers is also driving the growth of high data rate optical transceivers, such as 100G, 200G, and 400G
Which are the major companies in the optical transceiver market? What are their major strategies to strengthen their market presence?
II-VI Incorporated (US), FIT Hong Teng Limited (Taiwan), Lumentum (US), Sumitomo Electric Industries Ltd (Japan), Accelink (China), Applied Optoelectronics (US), Fujitsu Optical Components (Japan), Innolight (China), Mellanox (Israel), NeoPhotonics (US), are among a few of the key players in the optical transceiver market. Product launches was the key strategy adopted by players to increase the market presence
Which is the potential market for optical transceiver in terms of region?
North America shows significant opportunity for the optical transceiver market. The presence of 5 major cloud providers Microsoft, Google, Amazon, Facebook, and Apple, have enhanced the growth of the data center market and, consequently, the optical transceiver market to a substantial extent in North America. Increasing demand for high data rate optical transceivers by these players would provide opprotunity for the market.
What are the growth opportunities for high data rate transceivers for next 5 years?
"The rising demand for higher data transmission is mainly driving the growing demand for 100G, 200G, and 400G transceivers. With the advent of advanced technologies such as AI and 5G, there is an increased requirement for higher bandwidth, which is eventually necessary for data center applications. Optical transceivers supporting more than 100 Gbps are becoming predominant among global cloud service providers, such as Amazon, Facebook, Google, and Microsoft."
Which type of transceivers will show significant growth opportunity for next five years?
"The optical transceiver market for multimode fiber is expected to grow at the highest CAGR during forecast period owing to benefits offered by multimode fiber such as cost-efficiency, high speed, and bandwidth across shorter distances, larger fiber cores, and good alignment tolerances among others. Increasing importance of high speed transceivers also expected provide opportunities for QSFP based transceivers." .
To speak to our analyst for a discussion on the above findings, click Speak to Analyst
1 INTRODUCTION (Page No. - 19)
1.1 STUDY OBJECTIVES
1.2 MARKET DEFINITION AND SCOPE
1.3 INCLUSIONS AND EXCLUSIONS
1.4 STUDY SCOPE
1.4.1 MARKETS COVERED
1.4.2 YEARS CONSIDERED
1.5 CURRENCY
1.6 LIMITATIONS
1.7 STAKEHOLDERS
2 RESEARCH METHODOLOGY (Page No. - 24)
2.1 RESEARCH DATA
2.1.1 SECONDARY DATA
2.1.1.1 Secondary sources
2.1.2 PRIMARY DATA
2.1.2.1 Breakdown of primaries
2.1.2.2 Key data from primary sources
2.1.2.3 Key industry insights
2.2 MARKET SIZE ESTIMATION
2.2.1 BOTTOM-UP APPROACH
2.2.1.1 Approach for capturing market size by bottom-up analysis (demand side)
2.2.2 TOP-DOWN APPROACH
2.2.2.1 Approach for capturing market size by top-down analysis (supply side)
2.3 MARKET BREAKDOWN AND DATA TRIANGULATION
2.4 RESEARCH ASSUMPTIONS
3 EXECUTIVE SUMMARY (Page No. - 34)
4 PREMIUM INSIGHTS (Page No. - 38)
4.1 ATTRACTIVE OPPORTUNITIES IN OPTICAL TRANSCEIVER MARKET
4.2 OPTICAL TRANSCEIVER MARKET IN NORTH AMERICA, BY WAVELENGTH AND APPLICATION
4.3 OPTICAL TRANSCEIVER MARKET, BY WAVELENGTH
4.4 COUNTRY-WISE OPTICAL TRANSCEIVER MARKET GROWTH RATE
5 MARKET OVERVIEW (Page No. - 40)
5.1 MARKET DYNAMICS
5.1.1 DRIVERS
5.1.1.1 Increasing adoption of smart devices and rising data traffic
5.1.1.2 Growing demands of cloud computing applications
5.1.1.3 Increasing demand for compact and energy-efficient transceivers
5.1.2 RESTRAINTS
5.1.2.1 Increasing network complexity
5.1.3 OPPORTUNITIES
5.1.3.1 Emerging focus on 5G network
5.1.3.2 Increasing demand for high data transfer capabilities
5.1.3.3 Expansion of telecom infrastructure in developing economies
5.1.4 CHALLENGES
5.1.4.1 Everchanging customer demands
5.2 COVID-19 (CORONAVIRUS) IMPACT ON THE OPTICAL TRANSCEIVER MARKET
6 OPTICAL TRANSCEIVERS MARKET, BY FORM FACTOR (Page No. - 47)
6.1 INTRODUCTION
6.2 SFF AND SFP
6.2.1 SFF AND SFP FORM FACTOR ENABLES LOWR DATA RATE TRANSMISSION
6.3 SFP+ AND SFP28
6.3.1 IT ENABLES BOTH SINGLE-MODE AND MULTIMODE FIBER OPTIC COMMUNICATION
6.4 QSFP, QSFP+, QSFP14, AND QSFP28
6.4.1 FASTEST GROWING SEGMENT OWING TO ADOPTION FOR HIGH DATA RATE TRANSMISSION
6.5 CFP, CFP2, AND CFP4
6.5.1 MARKET FOR THIS TYPE OF TRANSCEIVERS EXPECTED TO GROW AT HIGHEST CAGR IN APAC
6.6 XFP
6.6.1 IT SUPPORTS ETHERNET, FIBER CHANNEL, AND SONET STANDARDS
6.7 CXP
6.7.1 CXP TRANSCEIVERS ARE USED FOR HIGH-DENSITY APPLICATIONS
7 OPTICAL TRANSCEIVERS MARKET, BY DATA RATE (Page No. - 57)
7.1 INTRODUCTION
7.2 LESS THAN 10 GBPS
7.2.1 LESS THAN 10 GBPS DATA RATE IS MOSTLY SUITED FOR LONG DISTANCE APPLICATIONS
7.3 10 GBPS TO 40 GBPS
7.3.1 10 GBPS TO 40 GBPS OF DATA RATE ARE MOSTLY USED ACROSS TELECOMMUNICATION APPLICATIONS
7.4 41 GBPS TO 100 GBPS
7.4.1 INCREASING INTERESTS OF CLOUD PROVIDERS TO SWITCH TO HIGH DATA RATES PROVIDES OPPORTUNITY FOR THE MARKET
7.5 MORE THAN 100 GBPS
7.5.1 INCREASING TRENDS OF 5G WOULD CREATE MARKET OPPORTUNITY
8 OPTICAL TRANSCEIVERS MARKET, BY FIBER TYPE (Page No. - 64)
8.1 INTRODUCTION
8.2 SINGLE-MODE FIBER (SMF)
8.2.1 SINGLE-MODE FIBERS TRANSMIT HIGHER BANDWIDTH LEVEL OVER LONGER DISTANCE
8.3 MULTIMODE FIBER (MMF)
8.3.1 MULTIMODE FIBERS ARE LESS EXPENSIVE AND ARE BEST SUITED FOR SHORT-RANGE APPLICATIONS
9 OPTICAL TRANSCEIVERS MARKET, BY DISTANCE (Page No. - 70)
9.1 INTRODUCTION
9.2 LESS THAN 1 KM
9.2.1 HIGHER DATA RATE TRANSCEIVERS ARE USED FOR LESS THAN 1KM DISTANCE CONNECTIVITY IN DATA CENTERS
9.3 1 TO 10 KM
9.3.1 TRANSCEIVER MODULES OPERATING WITHIN TO 10 KM DISTANCE ARE USED FOR INTRA DATA CENTER CONNECTION APPLICATIONS
9.4 11 TO 100 KM
9.4.1 OPTICAL TRANSCEIVERS, OPERATING WITHIN DISTANCE OF 11 TO 100 KM ARE OPERATED ON SINGLE-MODE FIBERS
9.5 MORE THAN 100 KM
9.5.1 OPTICAL TRANSCEIVERS FOR MORE THAN 100 KM ARE MAINLY USED FOR LONG DISTANCE TELECOMMUNICATION NETWORKS
10 OPTICAL TRANSCEIVERS MARKET, BY WAVELENGTH (Page No. - 76)
10.1 INTRODUCTION
10.2 850 NM BAND
10.2.1 MULTIMODE OPTICAL TRANSCEIVERS MOSTLY OPERATE IN 850 NM BAND
10.3 1310 NM BAND
10.3.1 THE 1310 NM BAND IS MOST SUITABLE FOR HIGH DATA TRANSFER RATES ACROSS A SHORT TO MEDIUM DISTANCES
10.4 1550 NM BAND
10.4.1 TRANSCEIVERS OPERATING ACROSS 1550 NM BAND SUITABLE FOR LONG-DISTANCE DATA TRANSMISSION APPLICATIONS
10.5 OTHERS
11 OPTICAL TRANSCEIVERS MARKET, BY CONNECTOR (Page No. - 84)
11.1 INTRODUCTION
11.2 LC CONNECTOR
11.2.1 LC CONNECTOR IS MOSTLY USED FOR DATACOM AND HIGH-DENSITY INTERCONNECT APPLICATIONS
11.3 SC CONNECTOR
11.3.1 SC CONNECTOR BASED OPTICAL TRANSCEIVERS ARE EXPECTED TO GROW AT HIGHEST CAGR IN APAC
11.4 MPO CONNECTOR
11.4.1 USE OF MPO CONNECTOR FOR HIGH-SPEED OPTICAL TRANSCEIVERS TO DRIVE GROWTH OF MARKET
11.5 RJ-45
11.5.1 RJ45 TRANSCEIVER ARE OFFER LOWEST DATA RATE CAPABILITY
12 OPTICAL TRANSCEIVERS MARKET, BY APPLICATION (Page No. - 90)
12.1 INTRODUCTION
12.2 TELECOMMUNICATION
12.2.1 ULTRA-LONG-HAUL NETWORK
12.2.1.1 DWDM technology used for ultra-long-haul network communications
12.2.2 LONG-HAUL NETWORK
12.2.2.1 Single-mode fibers are mostly used for long haul networks
12.2.3 METRO NETWORK
12.2.3.1 Rising adoption of 4G and 5G would provide opportunity for market
12.3 DATA CENTER
12.3.1 DATA CENTER INTERCONNECT
12.3.1.1 Increasing data traffic creating opportunity for 100G transceivers in the market
12.3.2 INTRA-DATA CENTER CONNECTION
12.3.2.1 Rising trends of cloud storage and emerging technologies such as AI, deep learning, virtual reality rising data traffic are driving growth of high-speed transceivers
12.4 ENTERPRISE
12.4.1 INCREASING NEED FOR HIGH DATA RATES FOR VARIOUS ENTERPRISE APPLICATIONS DRIVES GROWTH OF MARKET
13 OPTICAL TRANSCEIVERS MARKET, BY GEOGRAPHY (Page No. - 98)
13.1 INTRODUCTION
13.2 NORTH AMERICA
13.2.1 US
13.2.1.1 Presence of 5 major cloud service providers drives growth of market
13.2.2 CANADA
13.2.2.1 Canada is one of the emerging hotbeds of data center applications
13.2.3 MEXICO
13.2.3.1 Rising demand for 5G technology is attracting investments across Mexico
13.3 EUROPE
13.3.1 GERMANY
13.3.1.1 Germany increased adoption rate of connected and IoT devices for industrial and vehicular applications
13.3.2 UK
13.3.2.1 UK has increasing investments for development of infrastructure to support 5G technology and data center applications
13.3.3 FRANCE
13.3.3.1 Presence of several big telecom operators is increasing opportunities for flourishing 5G communication across France
13.3.4 REST OF EUROPE (ROE)
13.4 APAC
13.4.1 CHINA
13.4.1.1 Presence of top 3 Chinese internet companies, Baidu, Alibaba, and Tencent is driving opportunities for market
13.4.2 JAPAN
13.4.2.1 Increasing trend of technological applications, such as cloud-based solutions and growing market for consumer electronic products is increasing opportunities for optical transceivers across Japan
13.4.3 SOUTH KOREA
13.4.3.1 Rising number of internet users and early adoption of 5G in country provide ample opportunities
13.4.4 REST OF APAC (ROAPAC)
13.5 REST OF WORLD (ROW)
13.5.1 SOUTH AMERICA
13.5.1.1 South America is progressing towards fifth-generation technology operations for expanding 5G business
13.5.2 MIDDLE-EAST & AFRICA (MEA)
13.5.2.1 Middle East has escalating demands for high data connection owing to increasing adoption rate of mobile phone users
14 COMPETITIVE LANDSCAPE (Page No. - 119)
14.1 OVERVIEW
14.2 MARKET RANKING ANALYSIS: OPTICAL TRANSCEIVER MARKET, 2019
14.3 COMPETITIVE LEADERSHIP MAPPING
14.3.1 VISIONARY LEADERS
14.3.2 INNOVATORS
14.3.3 DYNAMIC DIFFERENTIATORS
14.3.4 EMERGING COMPANIES
14.4 STRENGTH OF PRODUCT PORTFOLIO
14.5 BUSINESS STRATEGY EXCELLENCE
14.6 COMPETITIVE SITUATIONS AND TRENDS
14.6.1 PRODUCT LAUNCHES
14.6.2 PARTNERSHIPS, AGREEMENTS, & COLLABORATIONS
14.6.3 ACQUISITIONS
15 COMPANY PROFILES (Page No. - 128)
15.1 INTRODUCTION
15.2 KEY PLAYERS
(Business Overview, Products Offered, Recent Developments, SWOT Analysis, and MnM View)*
15.2.1 II-VI
15.2.2 FIT HONG TENG
15.2.3 LUMENTUM
15.2.4 SUMITOMO ELECTRIC INDUSTRIES
15.2.5 ACCELINK
15.2.6 APPLIED OPTOELECTRONICS
15.2.7 FUJITSU OPTICAL COMPONENTS
15.2.8 INNOLIGHT
15.2.9 MELLANOX
15.2.10 NEOPHOTONICS
* Business Overview, Products Offered, Recent Developments, SWOT Analysis, and MnM View might not be captured in case of unlisted companies.
15.3 RIGHT TO WIN
15.4 OTHER KEY PLAYERS
15.4.1 CIENA
15.4.2 CISCO
15.4.3 HISENSE BROADBAND
15.4.4 INTEL
15.4.5 NEC
15.4.6 PERLE SYSTEMS
15.4.7 REFLEX PHOTONICS
15.4.8 SMARTOPTICS
15.4.9 SOLID OPTICS
15.4.10 SOURCE PHOTONICS
16 APPENDIX (Page No. - 161)
16.1 DISCUSSION GUIDE
16.2 KNOWLEDGE STORE: MARKETSANDMARKETS SUBSCRIPTION PORTAL
16.3 AVAILABLE CUSTOMIZATIONS
16.4 RELATED REPORTS
16.5 AUTHOR DETAILS
LIST OF TABLES (106 TABLES)
TABLE 1 OPTICAL TRANSCEIVER MARKET, BY FORM FACTOR, 20172025 (USD MILLION)
TABLE 2 OPTICAL TRANSCEIVER MARKET FOR SFF AND SFP FORM FACTOR, BY WAVELENGTH, 20172025 (USD MILLION)
TABLE 3 OPTICAL TRANSCEIVER MARKET FOR SFF AND SFP FORM FACTOR, BY FIBER TYPE, 20172025 (USD MILLION)
TABLE 4 OPTICAL TRANSCEIVER MARKET FOR SFF AND SFP FORM FACTOR, BY CONNECTOR, 20172025 (USD MILLION)
TABLE 5 OPTICAL TRANSCEIVER MARKET FOR SFF AND SFP FORM FACTOR, BY REGION, 20172025 (USD MILLION)
TABLE 6 OPTICAL TRANSCEIVER MARKET FOR SFP+ AND SFP28, BY WAVELENGTH, 20172025 (USD MILLION)
TABLE 7 OPTICAL TRANSCEIVER MARKET FOR SFP+ AND SFP28, BY DATA RATE, 20172025 (USD MILLION)
TABLE 8 OPTICAL TRANSCEIVER MARKET FOR SFP+ AND SFP28, BY FIBER TYPE, 20172025 (USD MILLION)
TABLE 9 OPTICAL TRANSCEIVER MARKET FOR SFP+ AND SFP28, BY REGION, 20172025 (USD MILLION)
TABLE 10 OPTICAL TRANSCEIVER MARKET FOR QSFP, QSFP+, QSFP14, AND QSFP28, BY WAVELENGTH, 20172025 (USD MILLION)
TABLE 11 OPTICAL TRANSCEIVER MARKET FOR QSFP, QSFP+, QSFP14, AND QSFP28, BY DATA RATE, 20172025 (USD MILLION)
TABLE 12 OPTICAL TRANSCEIVER MARKET FOR QSFP, QSFP+, QSFP14, AND QSFP28, BY FIBER TYPE, 20172025 (USD MILLION)
TABLE 13 OPTICAL TRANSCEIVER MARKET FOR QSFP, QSFP+, QSFP14, AND QSFP28, BY CONNECTOR, 20172025 (USD MILLION)
TABLE 14 OPTICAL TRANSCEIVER MARKET FOR QSFP, QSFP+, QSFP14, AND QSFP28, BY REGION, 20172025 (USD MILLION)
TABLE 15 OPTICAL TRANSCEIVER MARKET FOR CFP, CFP2, AND CFP4, BY WAVELENGTH, 20172025 (USD MILLION)
TABLE 16 OPTICAL TRANSCEIVER MARKET FOR CFP, CFP2, AND CFP4, BY FIBER TYPE, 20172025 (USD MILLION)
TABLE 17 OPTICAL TRANSCEIVER MARKET FOR CFP, CFP2, AND CFP4, BY CONNECTOR, 20172025 (USD MILLION)
TABLE 18 OPTICAL TRANSCEIVER MARKET FOR CFP, CFP2, AND CFP4, BY REGION, 20172025 (USD MILLION)
TABLE 19 OPTICAL TRANSCEIVER MARKET FOR XFP, BY WAVELENGTH, 20172025 (USD MILLION)
TABLE 20 OPTICAL TRANSCEIVER MARKET FOR XFP, BY REGION, 20172025 (USD MILLION)
TABLE 21 OPTICAL TRANSCEIVER MARKET FOR CXP, BY REGION, 20172025 (USD MILLION)
TABLE 22 LIST PRODUCTS FOR DIFFERENT DATA RATES
TABLE 23 OPTICAL TRANSCEIVER MARKET, BY DATA RATE, 20172025 (USD MILLION)
TABLE 24 OPTICAL TRANSCEIVER MARKET FOR LESS THAN 10 GBPS DATA RATE, BY FORM FACTOR, 20172025 (USD MILLION)
TABLE 25 OPTICAL TRANSCEIVER MARKET FOR LESS THAN 10GBPS DATA RATE, BY REGION, 20172025 (USD MILLION)
TABLE 26 OPTICAL TRANSCEIVER MARKET FOR 10 GBPS TO 40 GBPS DATA RATE, BY FORM FACTOR, 20172025 (USD MILLION)
TABLE 27 OPTICAL TRANSCEIVER MARKET FOR 10GBPS TO 40 GBPS DATA RATE, BY REGION, 20172025 (USD MILLION)
TABLE 28 OPTICAL TRANSCEIVER MARKET FOR 41 GBPS TO 100GBPS DATA RATE, BY REGION, 20172025 (USD MILLION)
TABLE 29 OPTICAL TRANSCEIVER MARKET FOR ABOVE 100 GBPS, BY FORM FACTOR, 20172025 (USD MILLION)
TABLE 30 OPTICAL TRANSCEIVER MARKET FOR MORE THAN 100 GBPS DATA RATE, BY REGION, 20172025 (USD MILLION)
TABLE 31 LIST OF PLAYERS OFFERING SINGLE-MODE AND MULTIMODE FIBER TRANSCEIVERS
TABLE 32 OPTICAL TRANSCEIVER MARKET, BY FIBER TYPE, 20172025 (USD MILLION)
TABLE 33 OPTICAL TRANSCEIVER MARKET FOR SINGLE-MODE FIBER, BY FORM FACTOR, 20172025 (USD MILLION)
TABLE 34 OPTICAL TRANSCEIVER MARKET FOR SINGLE-MODE FIBER, BY APPLICATION, 20172025 (USD MILLION)
TABLE 35 OPTICAL TRANSCEIVER MARKET FOR SINGLE-MODE FIBER, BY REGION, 20172025 (USD MILLION)
TABLE 36 OPTICAL TRANSCEIVER MARKET FOR MULTIMODE FIBER, BY FORM FACTOR, 20172025 (USD MILLION)
TABLE 37 OPTICAL TRANSCEIVER MARKET FOR MULTIMODE FIBER, BY APPLICATION, 20172025 (USD MILLION)
TABLE 38 OPTICAL TRANSCEIVER MARKET FOR MULTIMODE FIBER, BY REGION, 20172025 (USD MILLION)
TABLE 39 LIST OF OPTICAL TRANSCEIVERS FOR DIFFERENT DISTANCES
TABLE 40 OPTICAL TRANSCEIVER MARKET, BY DISTANCE, 20172025 (USD MILLION)
TABLE 41 OPTICAL TRANSCEIVER MARKET FOR 1 KM, BY REGION, 20172025 (USD MILLION)
TABLE 42 OPTICAL TRANSCEIVER MARKET FOR 1 TO 10 KM, BY REGION, 20172025 (USD MILLION)
TABLE 43 OPTICAL TRANSCEIVER MARKET FOR 11 TO 100 KM, BY REGION, 20172025 (USD MILLION)
TABLE 44 OPTICAL TRANSCEIVER MARKET FOR MORE THAN 100 KM, BY REGION, 20172025 (USD MILLION)
TABLE 45 LIST OF PRODUCTS OPERATING AT DIFFERENT WAVELENGTHS
TABLE 46 OPTICAL TRANSCEIVER MARKET, BY WAVELENGTH, 20172025 (USD MILLION)
TABLE 47 OPTICAL TRANSCEIVER MARKET FOR 850 NM BAND, BY FORM FACTOR, 20172025 (USD MILLION)
TABLE 48 OPTICAL TRANSCEIVER MARKET FOR 850 NM BAND, BY REGION, 20172025 (USD MILLION)
TABLE 49 OPTICAL TRANSCEIVER MARKET FOR 1310 NM BAND, BY FORM FACTOR, 20172025 (USD MILLION)
TABLE 50 OPTICAL TRANSCEIVER MARKET FOR 1310 NM BAND, BY REGION, 20172025 (USD MILLION)
TABLE 51 OPTICAL TRANSCEIVER MARKET FOR 1550 NM BAND, BY FORM FACTOR, 20172025 (USD MILLION)
TABLE 52 OPTICAL TRANSCEIVER MARKET FOR 1550 NM BAND, BY REGION, 20172025 (USD MILLION)
TABLE 53 OPTICAL TRANSCEIVER MARKET FOR OTHER WAVELENGTHS, BY FORM FACTOR, 20172025 (USD MILLION)
TABLE 54 OPTICAL TRANSCEIVER MARKET FOR OTHER WAVELENGTHS, BY REGION, 20172025 (USD MILLION)
TABLE 55 LIST OF PRODUCTS FOR DIFFERENT CONNECTOR TYPES
TABLE 56 OPTICAL TRANSCEIVER MARKET, BY CONNECTOR, 20172025 (USD MILLION)
TABLE 57 OPTICAL TRANSCEIVER MARKET FOR LC CONNECTOR, BY FORM FACTOR, 20172025 (USD MILLION)
TABLE 58 OPTICAL TRANSCEIVER MARKET FOR LC CONNECTOR, BY REGION, 20172025 (USD MILLION)
TABLE 59 OPTICAL TRANSCEIVER MARKET FOR SC CONNECTOR, BY FORM FACTOR, 20172025 (USD MILLION)
TABLE 60 OPTICAL TRANSCEIVER MARKET FOR SC CONNECTOR, BY REGION, 20172025 (USD MILLION)
TABLE 61 OPTICAL TRANSCEIVER MARKET FOR MPO CONNECTOR, BY FORM FACTOR, 20172025 (USD MILLION)
TABLE 62 OPTICAL TRANSCEIVER MARKET FOR MPO CONNECTOR, BY REGION, 20172025 (USD MILLION)
TABLE 63 OPTICAL TRANSCEIVER MARKET FOR RJ-45 CONNECTOR, BY REGION, 20172025 (USD MILLION)
TABLE 64 OPTICAL TRANSCEIVER MARKET, BY APPLICATION, 20172025 (USD MILLION)
TABLE 65 OPTICAL TRANSCEIVER MARKET FOR TELECOMMUNICATION, BY FIBER TYPE, 20172025 (USD MILLION)
TABLE 66 OPTICAL TRANSCEIVER MARKET FOR TELECOMMUNICATION, BY REGION, 20172025 (USD MILLION)
TABLE 67 OPTICAL TRANSCEIVER MARKET FOR DATA CENTER, BY FIBER TYPE, 20172025 (USD MILLION)
TABLE 68 OPTICAL TRANSCEIVER MARKET FOR DATA CENTER, BY REGION, 20172025 (USD MILLION)
TABLE 69 OPTICAL TRANSCEIVER MARKET, FOR ENTERPRISE, BY FIBER TYPE, 20172025 (USD MILLION)
TABLE 70 OPTICAL TRANSCEIVER MARKET FOR ENTERPRISE, BY REGION, 20172025 (USD MILLION)
TABLE 71 OPTICAL TRANSCEIVER MARKET, BY REGION, 2017-2025 (USD MILLION)
TABLE 72 OPTICAL TRANSCEIVER MARKET IN NORTH AMERICA, BY COUNTRY, 20172025 (USD MILLION)
TABLE 73 OPTICAL TRANSCEIVER MARKET FOR NORTH AMERICA, BY APPLICATION, 20172025 (USD MILLION)
TABLE 74 OPTICAL TRANSCEIVER MARKET FOR NORTH AMERICA, BY WAVELENGTH, 20172025 (USD MILLION)
TABLE 75 OPTICAL TRANSCEIVER MARKET FOR NORTH AMERICA, BY FIBER TYPE, 20172025 (USD MILLION)
TABLE 76 OPTICAL TRANSCEIVER MARKET FOR NORTH AMERICA, BY FORM FACTOR, 20172025 (USD MILLION)
TABLE 77 OPTICAL TRANSCEIVER MARKET FOR NORTH AMERICA, BY CONNECTOR, 20172025 (USD MILLION)
TABLE 78 OPTICAL TRANSCEIVER MARKET IN NORTH AMERICA, BY DATA RATE, 20172025 (USD MILLION)
TABLE 79 OPTICAL TRANSCEIVER MARKET IN NORTH AMERICA, BY DISTANCE, 20172025 (USD MILLION)
TABLE 80 OPTICAL TRANSCEIVER MARKET IN EUROPE, BY COUNTRY, 20172025 (USD MILLION)
TABLE 81 OPTICAL TRANSCEIVER MARKET IN EUROPE, BY APPLICATION, 20172025 (USD MILLION)
TABLE 82 OPTICAL TRANSCEIVER MARKET IN EUROPE, BY WAVELENGTH, 20172025 (USD MILLION)
TABLE 83 OPTICAL TRANSCEIVER MARKET IN EUROPE, BY FIBER TYPE, 20172025 (USD MILLION)
TABLE 84 OPTICAL TRANSCEIVER MARKET IN EUROPE, BY FORM FACTOR, 20172025 (USD MILLION)
TABLE 85 OPTICAL TRANSCEIVER MARKET IN EUROPE, BY CONNECTOR, 20172025 (USD MILLION)
TABLE 86 OPTICAL TRANSCEIVER MARKET IN EUROPE, BY DATA RATE, 20172025 (USD MILLION)
TABLE 87 OPTICAL TRANSCEIVER MARKET IN EUROPE, BY DISTANCE, 20172025 (USD MILLION)
TABLE 88 OPTICAL TRANSCEIVER MARKET IN APAC, BY COUNTRY, 20172025 (USD MILLION)
TABLE 89 OPTICAL TRANSCEIVER MARKET IN APAC, BY APPLICATION, 20172025 (USD MILLION)
TABLE 90 OPTICAL TRANSCEIVER MARKET IN APAC, BY WAVELENGTH, 20172025 (USD MILLION)
TABLE 91 OPTICAL TRANSCEIVER MARKET IN APAC, BY FIBER TYPE, 20172025 (USD MILLION)
TABLE 92 OPTICAL TRANSCEIVER MARKET IN APAC, BY FORM FACTOR, 20172025 (USD MILLION)
TABLE 93 OPTICAL TRANSCEIVER MARKET IN APAC, BY CONNECTOR, 20172025 (USD MILLION)
TABLE 94 OPTICAL TRANSCEIVER MARKET IN APAC, BY DATA RATE, 20172025 (USD MILLION)
TABLE 95 OPTICAL TRANSCEIVER MARKET IN APAC, BY DISTANCE, 20172025 (USD MILLION)
TABLE 96 OPTICAL TRANSCEIVER MARKET IN ROW, BY REGION, 20172025 (USD MILLION)
TABLE 97 OPTICAL TRANSCEIVER MARKET IN ROW, BY APPLICATION, 20172025 (USD MILLION)
TABLE 98 OPTICAL TRANSCEIVER MARKET IN ROW, BY WAVELENGTH, 20172025 (USD MILLION)
TABLE 99 OPTICAL TRANSCEIVER MARKET IN ROW, BY FIBER TYPE, 20172025 (USD MILLION)
TABLE 100 OPTICAL TRANSCEIVER MARKET IN ROW, BY FORM FACTOR, 20172025 (USD MILLION)
TABLE 101 OPTICAL TRANSCEIVER MARKET IN ROW, BY CONNECTOR, 20172025 (USD MILLION)
TABLE 102 OPTICAL TRANSCEIVER MARKET IN ROW, BY DATA RATE, 20172025 (USD MILLION)
TABLE 103 OPTICAL TRANSCEIVER MARKET IN ROW, BY DISTANCE, 20172025 (USD MILLION)
TABLE 104 PRODUCT LAUNCHES, 20182019
TABLE 105 PARTNERSHIPS, AGREEMENTS, & COLLABORATIONS, 2018-2019
TABLE 106 ACQUISITIONS, 2018-2019
LIST OF FIGURES (46 FIGURES)
FIGURE 1 OPTICAL TRANSCEIVER MARKET SEGMENTATION
FIGURE 2 OPTICAL TRANSCEIVER MARKET: PROCESS FLOW OF MARKET SIZE ESTIMATION
FIGURE 3 OPTICAL TRANSCEIVER MARKET: RESEARCH DESIGN
FIGURE 4 OPTICAL TRANSCEIVER MARKET: BOTTOM-UP APPROACH
FIGURE 5 OPTICAL TRANSCEIVER MARKET: TOP-DOWN APPROACH
FIGURE 6 DATA TRIANGULATION
FIGURE 7 ASSUMPTIONS FOR RESEARCH STUDY
FIGURE 8 OPTICAL TRANSCEIVERS WITH FORM FACTORS QSFP, QSFP+, QSFP14, AND QSFP28 EXPECTED TO GROW AT HIGHEST CAGR
FIGURE 9 OPTICAL TRANSCEIVERS FOR MULTIMODE FIBER TO EXHIBIT HIGHEST CAGR IN MARKET DURING FORECAST PERIOD
FIGURE 10 DATA CENTER TO DOMINATE OPTICAL TRANSCEIVER MARKET DURING FORECAST PERIOD
FIGURE 11 OPTICAL TRANSCEIVER MARKET IN APAC TO GROW AT HIGHEST CAGR DURING FORECAST PERIOD
FIGURE 12 INCREASING ADOPTION OF HIGH DATA RATE OPTICAL TRANSCEIVERS TO DRIVE GROWTH OF OPTICAL TRANSCEIVER MARKET
FIGURE 13 850 NM BAND AND DATA CENTER APPLICATION HELD LARGEST MARKET SHARE IN NORTH AMERICA, IN 2019
FIGURE 14 OPTICAL TRANSCEIVERS OPERATING AT 850 NM BAND TO HOLD LARGEST MARKET SIZE DURING FORECAST PERIOD
FIGURE 15 CHINA TO RECORD HIGHEST CAGR IN OPTICAL TRANSCEIVER MARKET DURING FORECAST PERIOD
FIGURE 16 IMPACT OF DRIVERS ON OPTICAL TRANSCEIVER MARKET
FIGURE 17 IMPACT OF OPPORTUNITIES ON OPTICAL TRANSCEIVER MARKET
FIGURE 18 IMPACT OF RESTRAINTS AND CHALLENGES ON OPTICAL TRANSCEIVER MARKET
FIGURE 19 OPTICAL TRANSCEIVERS WITH FORM FACTOR QSFP, QSFP+, QSFP14, AND QSFP28 EXPECTED TO GROW AT HIGHEST CAGR DURING FORECAST PERIOD
FIGURE 20 OPTICAL TRANSCEIVERS SUPPORTING 41 GBPS TO 100 GBPS AND MORE THAN 100GBPS RATES EXPECTED TO GROW AT SIGNIFICANT RATES FROM 2020 TO 2025
FIGURE 21 MULTIMODE OPTICAL TRANSCEIVERS TO GROW AT HIGHEST CAGR DURING FORECAST PERIOD
FIGURE 22 MULTIMODE OPTICAL TRANSCEIVER MARKET TO GROW AT HIGHEST CAGR IN APAC DURING FORECAST PERIOD
FIGURE 23 OPTICAL TRANSCEIVER FOR LESS THAN 1 KM TO DOMINATE MARKET DURING FORECAST PERIOD
FIGURE 24 OPTICAL TRANSCEIVERS OPERATING IN 1310 NM BAND TO GROW AT HIGHEST CAGR
FIGURE 25 OPTICAL TRANSCEIVERS OPERATING IN 1310 NM BAND IN NORTH AMERICA TO LEAD MARKET
FIGURE 26 MPO CONNECTOR BASED OPTICAL TRANSCEIVERS TO GROW AT HIGHEST CAGR DURING FORECAST PERIOD
FIGURE 27 OPTICAL TRANSCEIVER MARKET FOR DATA CENTER APPLICATION TO GROW AT HIGHEST CAGR DURING FORECAST PERIOD
FIGURE 28 SINGLE-MODE FIBER OPTICAL TRANSCEIVERS TO LEAD MARKET FOR TELECOMMUNICATION APPLICATION DURING FORECAST PERIOD
FIGURE 29 NORTH AMERICA TO LEAD OPTICAL TRANSCEIVER MARKET FOR DATA CENTER APPLICATION DURING FORECAST PERIOD
FIGURE 30 APAC OPTICAL TRANSCEIVER MARKET TO GROW AT HIGHEST CAGR DURING FORECAST PERIOD
FIGURE 31 SNAPSHOT: NORTH AMERICA OPTICAL TRANSCEIVER MARKET
FIGURE 32 SNAPSHOT: EUROPE OPTICAL TRANSCEIVER MARKET
FIGURE 33 SNAPSHOT: APAC OPTICAL TRANSCEIVER MARKET
FIGURE 34 OPTICAL TRANSCEIVER MARKET IN SOUTH AMERICA TO HOLD LARGEST MARKET SHARE IN ROW DURING FORECAST PERIOD
FIGURE 35 PLAYERS IN OPTICAL TRANSCEIVER MARKET ADOPTED PRODUCT LAUNCH AS THEIR KEY STRATEGY FOR BUSINESS EXPANSION FROM 2017 TO 2019
FIGURE 36 MARKET RANKING OF MAJOR PLAYERS IN OPTICAL TRANSCEIVER MARKET, 2019
FIGURE 37 OPTICAL TRANSCEIVER MARKET (GLOBAL) COMPETITIVE LEADERSHIP MAPPING, 2019
FIGURE 38 PRODUCT PORTFOLIO ANALYSIS OF TOP PLAYERS IN OPTICAL TRANSCEIVER MARKET
FIGURE 39 BUSINESS STRATEGY EXCELLENCE OF TOP PLAYERS IN OPTICAL TRANSCEIVER MARKET
FIGURE 40 II-VI: COMPANY SNAPSHOT
FIGURE 41 FIT: COMPANY SNAPSHOT
FIGURE 42 LUMENTUM: COMPANY SNAPSHOT
FIGURE 43 SUMITOMO ELECTRIC INDUSTRIES: COMPANY SNAPSHOT
FIGURE 44 APPLIED OPTOELECTRONICS: COMPANY SNAPSHOT
FIGURE 45 MELLANOX: COMPANY SNAPSHOT
FIGURE 46 NEOPHOTONICS: COMPANY SNAPSHOT
The study involved four major activities in estimating the current size of the global optical transceiver market. Exhaustive secondary research has been done to collect information about the market, the peer market, and the parent market. Validating findings, assumptions, and sizing with industry experts across the value chain through primary research has been the next step. Both top-down and bottom-up approaches have been employed to estimate the complete market size. After that, market breakdown and data triangulation methods have been used to estimate the market size of segments and subsegments.
The research methodology used to estimate and forecast the optical transceiver market begins with capturing data on revenues of the key vendors in the market through secondary research. This study incorporates the use of extensive secondary sources, directories, and databases such as Hoovers, Bloomberg Businessweek, Factiva, and OneSource to identify and collect information useful for the technical, market-oriented, and commercial study of the optical transceiver market. Vendor offerings have also been considered to determine the market segmentation. This entire research methodology includes the study of annual and financial reports of top players, presentations, press releases, journals, paid databases, trade directories, associations, organizations, and regulatory bodies.
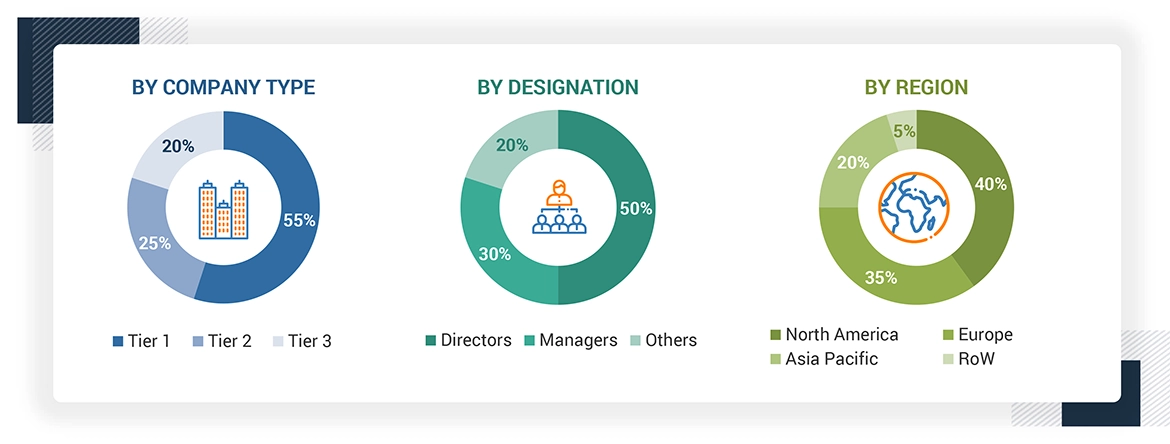
The optical transceiver market comprises several stakeholders, such as optical component manufacturers and suppliers, transceiver module manufacturers, and equipment manufacturers. Demand-side of this market includes end-users from various applications such as data centers, telecommunication, and e. Several primary interviews have been conducted with market experts from both the demand and supply sides across four major regions: North America, Europe, APAC, and RoW to gather qualitative and quantitative information. Following is the breakdown of primary respondents.
To know about the assumptions considered for the study, download the pdf brochure
The top-down and bottom-up approaches have been used to estimate and validate the overall size of the optical transceiver market. These methods have also been used extensively to estimate the size of various market subsegments. The research methodology used to estimate the market size includes the following:
After arriving at the overall market size using the estimation processes as explained above, the market was split into several segments and subsegments. To complete the overall market engineering process and arrive at the exact statistics of each market segment and subsegment, data triangulation, and market breakdown procedures have been employed, wherever applicable. The data has been triangulated by studying various factors and trends from both the demand and supply sides in the optical transceiver market.
With the given market data, MarketsandMarkets offers customizations according to the company's specific needs. The following customization options are available for the optical transceiver market report:
Benchmarking the rapid strategy shifts of the Top 100 companies in the Optical Transceiver Market
Request For Special Pricing
Growth opportunities and latent adjacency in Optical Transceiver Market
I'm interesting about the tunable DWDM Optical Transceiver Markets and expectations while 5G wireless network environment. Has this been considered? How would 5G impact the use of optical transiver market?
Looking for market research on optical transceiver market broken down by speed and industry vertical. Which are the major industries apart from telecom sector? How 5G impact the further adoption of optical transivers?
We would like to know the market research of the optical transceiver. Have you considered the market by data ranges and data rates?
We are going to develop connector in optical fiber industry. Can you provide us with the market scope of the same? Has connectors been included in the scope of the study?
I am interested in a Optical Receiver / GBIC break down ... Esp. problems with GBIC counter fits (or use of non-compliant GBIC modules in service contracts) and the resulting financial damage. Is this a major restraining factor for the Optical Transceiver Market?
The key players in the optical transceiver market are 1. Finisar Corp. (U.S.), 2. Accelink Technologies Co., Ltd. (China), 3. Lumentum Holdings Inc. (U.S.), 4. Oclaro, Inc. (U.S.), 5. Sumitomo Electric Industries, Ltd. (Japan), 6. Foxconn Electronics Inc. (Taiwan), 7. NeoPhotonics Corp. (U.S.), 8. Fujitsu Optical Components Ltd. (Japan), 9. Reflex Photonics Inc. (Canada), and Source 10. Photonics Inc. (U.S.), among others. Which other players have you considered? How smartphones would impact the overall offerings of this market?