
FSO and Li-Fi, VLC Market Size, Share, Trends

Free Space Optics (FSO) and Visible Light Communication (VLC)/ Li-Fi Market by FSO Component (Transmitters, Receivers, Modulators & Demodulators), VLC Component (LEDs, Photodetectors, Microcontrollers, Software) - Global Forecast to 2029


FSO & VLC / LI-FI MARKET OVERVIEW
The FSO & VLC / Li-Fi market is projected to reach USD 7.39 billion by 2029 from USD 2.78 billion in 2024, at a CAGR of 21.6% from 2024 to 2029. The rising adoption of high speed wireless connectivity is driving market growth.
KEY TAKEAWAYS
-
By RegionThe North America FSO and VLC/Li-Fi market accounted for a 35.0% revenue share in 2024.
-
FSO Market By ComponentFSO Market by component, the modulator & demodulator segment is expected to register the highest CAGR of 21.5%.
-
FSO Market By ApplicationFSO Market by application, the Healthcare segment is projected to grow at the fastest rate from 2024 to 2029.
-
FSO Market By VerticalFSO Market by vertical, the IT and Telecommunication segment is expected to dominate the market.
-
VLC/Li-Fi Market By ComponentVLC/Li-Fi market by component, software segment is expected to register the highest CAGR of 25.6%.
-
VLC/Li-Fi Market By Transmission TypeVLC/Li-Fi market by transmission type, the bidirectional segment is expected to dominated the market.
-
VLC/Li-Fi Market By ApplicationVLC/Li-Fi market by application, the hospital segment is expected to grow at the fastest rate from 2024 to 2029.
-
Competitive LandscapeCompany such as Signify Holding (Netherlands), Lucibel SA (France), fSONA Networks Corp. (Canada) were identified as some of the star players in the FSO and VLC/Li-Fi market (global), given their strong market share and product footprint.
-
Competitive LandscapeCompanies such as nextLiFi (Australia), Global LiFi Tech (Canada), Infinity Technology Services Limited (China) VLNComm (US), among others, have distinguished themselves among startups and SMEs by securing strong footholds in specialized niche areas, underscoring their potential as emerging market leaders
One of the key drivers of the FSO & VLC/Li-Fi market is the increasing demand for high-speed wireless connectivity. With the increasing number of connected devices, the need for faster and more reliable wireless networks is increasing rapidly. It is also important for IoT applications, which connect a large number of devices to the Internet and generate significant amounts of data that require high-speed connectivity.

Source: Secondary Research, Interviews with Experts, MarketsandMarkets Analysis
TRENDS & DISRUPTIONS IMPACTING CUSTOMERS' CUSTOMERS
The FSO and VLC / Li-Fi industry is entering a phase of significant transition as emerging technologies, new material systems, and evolving application demands reshape future growth. Advances in amorphous alloys, nanocrystalline cores, and high-permeability ferrites are enabling next-generation optical communication components with higher efficiency, stability, and performance. Rising demand for high-speed, low-latency connectivity across consumer electronics, medical systems, commercial infrastructure, and aerospace & defense is accelerating adoption, while broader trends such as IoT expansion, 5G deployment, AI-driven automation, and Industry 4.0/5.0 are further amplifying the need for robust optical links. Companies such as Signify, pureLiFi, and Kyocera SLD Laser are actively launching new Li-Fi platforms, forging technology partnerships, and expanding into industrial and enterprise environments to capture this momentum. As these dynamics intensify, market participants must adapt their portfolios, pivot toward high-growth material technologies, and align with emerging use cases to remain competitive in the evolving FSO and VLC/Li-Fi landscape.

Source: Secondary Research, Interviews with Experts, MarketsandMarkets Analysis
FSO & VLC / LI-FI MARKET DYNAMICS
Level
-
Limited last-mile connectivity in FSO

-
Faster and safer data transfer in VLC/Li-Fi

Level
-
High installation costs of FSO solutions

Level
-
Growing adoption of Li-Fi in various industries

-
Emergence of new applications such as IoT and 5G

Level
-
Lack of technological awareness

-
Reliability issues due to fading signals during propagation

Source: Secondary Research, Interviews with Experts, MarketsandMarkets Analysis
Driver: Limited last-mile connectivity
The term ‘last mile’ signifies the last phase of the telecommunications network that delivers communications connectivity to customers. For example, a subscriber line reaches individual homes through utility poles. The last mile has been a speed bottleneck in communication networks; its bandwidth limits the bandwidth of the data that is delivered to the customer. This is because retail telecommunication networks have the topology of ‘trees’, with relatively few high capacity ‘trunk’ communication channels spread out to feed other final mile connections. The data transfer rate is reduced due to these limited final mile connections. The presence of long cables and other mediums causes a huge interference in the transmission and reception of data. Unlike other RF technologies, FSO uses light to transmit data without cables or power lines. A high-bandwidth, cost-effective solution involves connecting high-bandwidth networks from the fiber optic backbone to all businesses with high-bandwidth networks. Thus, using FSO wireless communication in mesh architecture can quickly provide high bandwidth to customers.
Restraint: High installation costs of FSO solutions
The high installation cost of the FSO technology-based devices is a hindrance to the wide adoption of FSO systems. The hardware for a communication system costs approximately USD 3,000 to USD 15,000, while installation costs are approximately USD 500 to USD 1,000; this high initial expenditure could negatively impact a customer’s decision to adopt the FSO technology. Although the cost incurred to install FSO technology is significantly lower than the cost of deploying fiber-optic lines, installing FSO in a smaller area incurs a higher cost than in larger buildings. Hence, installing FSO in larger spaces is expected to be more cost-effective than installing in smaller spaces.
Opportunity: Growing adoption of Li-Fi in various industries
After the deployment of 3G systems, researchers observed that customers were demanding more bandwidth. To fulfil these needs, fourth-generation (4G) and further systems were introduced to ensure the availability of heterogeneous access techniques. Now, the race is not connecting every human with the Internet but focusing on wireless network connection. The requirement for connecting TV, lighting systems, fans, ACs, refrigerators, microwave ovens, and so on with the network drives the need to develop short-range license-free wireless communication networks that enable the transmission of heterogeneous information anywhere, any time. VLC is a promising technology not only for increasing the capacity of indoor wireless communication but also for ensuring security. White LEDs are rapidly penetrating the market and can be used for both, lighting and communication. VLC provides a cost-effective technique for duplex communication for home users and satisfies a small LAN's requirements. The technology is ubiquitous and can be utilized in multiple applications such as smart stores, streetlights, hospitals, aerospace, underwater, and hazardous environments. In late 2017, two-way communication through the VLC/Li-Fi technology was commercialized for hospitals, offices, and several other indoor applications.
Challenge: Lack of technological awareness
Awareness of the still-developing VLC technology is vital in building the market. There is very low awareness of the technology and its anticipated benefits. Till 2013, there were a limited number of companies active in the field of VLC; however, due to the growing interest in this field, the number of players is increasing gradually. However, the VLC technology has not yet been promoted enough. Two-way communication between manufacturers and technology providers is required. However, as the technology is new, players are reluctant to reveal what they are working on, thus creating an information gap between manufacturers and consumers. Technological awareness is expected to grow once the technology is fully commercialized and enters the mainstream in the near future.
FSO AND LI-FI, VLC MARKET SIZE, SHARE, TRENDS: COMMERCIAL USE CASES ACROSS INDUSTRIES
| COMPANY | USE CASE DESCRIPTION | BENEFITS |
|---|---|---|
 |
A data center operator in Mexico City leveraged EC SYSTEM’s FSO-based EL-10GL link to establish a high-capacity, secure wireless point-to-point connection. The solution was deployed to overcome constraints related to underground cabling, RF congestion, and the need for large-volume data transfer. | The FSO solution delivered fiber-like throughput (up to 30 Gbps) with rapid deployment and significantly lower infrastructure costs. It also enhanced network security and reliability in environments where conventional microwave or fiber installations were not feasible. |
|
|
Atlas Communication deployed EC SYSTEM’s FSO-based EL-1GL solution to create a high-speed optical wireless point-to-point link between two buildings in Ebene Cyber City. The deployment enabled rapid, permit-free connectivity over a 1 km distance. | The cable-free optical system delivered reliable, fiber-grade performance with throughput up to 10 Gbps Full Duplex. It reduced deployment time and avoided municipal approval hurdles, ensuring a cost-effective and scalable network upgrade. |
 |
Babcock implemented pureLiFi’s LiFi-X system to enable secure, interference-free wireless data transfer across vibration sensors installed on critical air compressors. The solution integrated LiFi-enabled LED luminaires to provide both illumination and reliable data communication within the facility. | The LiFi network enhanced data reliability and reduced risks associated with RF-based wireless systems, offering a more secure and interference-resistant alternative. It also improved operational monitoring by enabling continuous, high-integrity information gathering from industrial equipment. |
Logos and trademarks shown above are the property of their respective owners. Their use here is for informational and illustrative purposes only.
FSO & VLC / LI-FI MARKET ECOSYSTEM
The market is highly competitive. It is marked by the presence of a few Tier 1 companies, such as Signify Holding (Netherlands), Acuity Brands, Inc. (US), Panasonic Corporation (Japan), and Lucibel SA (France). These companies have created a competitive ecosystem by investing in research & development activities to launch highly efficient and reliable Li-Fi solutions. At the initial stage, manufacturers of LEDs, photodetectors, transmitters, modules, routers, modems, and access points play a vital role. The router provides direct connectivity to the wireless network. All these products are supplied by distributors to operators and consumers.

Logos and trademarks shown above are the property of their respective owners. Their use here is for informational and illustrative purposes only.
FSO & VLC / LI-FI MARKET SEGMENTS

Source: Secondary Research, Interviews with Experts, MarketsandMarkets Analysis
FSO Market, By Component
Modulators and demodulators are the key components of an FSO system. The market for modulators and demodulators is expected to grow at the highest growth rate during the forecast period. FSO is being adopted for various applications, such as backhaul networks, disaster recovery, and military communications. As the market for FSO increases, the overall demand for modulators and demodulators will also increase.
VLC/Li-Fi Market, By Application
The smart stores segment is projected to account for the largest share of the VLC/Li-Fi market during the forecast period. Retailers are increasingly using smart technologies to improve customer experience, boost efficiency, and stay competitive. VLC/Li-Fi provides several benefits over traditional wireless technologies, including faster data rates, better security, and seamless integration with current lighting systems. It can be used for indoor positioning, smart lighting, interactive displays, and inventory management in smart stores. For upgraded secure and high-speed communication in indoor applications, the VLC technology is a cost-effective and energy-efficient solution. Hence, this application is projected to record high demand during the forecast period
FSO Market, By Vertical
The IT & telecommunications vertical holds the largest market share in the FSO market, and this trend is expected to continue during the forecast period. FSO systems typically have lower latency compared to radio-based solutions, which is important for real-time applications. The FSO technology can alleviate data traffic from congested fiber networks, thereby increasing overall network capacity. Additionally, FSO can act as a backup or redundant communication link in the event of fiber optic cable failures.
FSO & VLC / LI-FI MARKET REGION
The Asia Pacific region is expected to grow at the highest growth rate during the forecast period
Asia Pacific is set to record the fastest growth in the FSO and VLC/Li-Fi market due to rapid urban digitalization, expansion of smart city programs, and strong government-led adoption of next-gen connectivity across countries such as China, Japan, South Korea, and Singapore. The region’s dense metro environments and fiber-deployment constraints further accelerate demand for high-capacity wireless optical links. Major regional players and adopters—including Panasonic’s Li-Fi pilots in Japan and Signify’s Trulifi deployments across Southeast Asia—are also driving ecosystem maturity. This combination of infrastructure push, tech readiness, and commercial rollouts positions APAC for the highest growth momentum.

FSO AND LI-FI, VLC MARKET SIZE, SHARE, TRENDS: COMPANY EVALUATION MATRIX
In the FSO and VLC/Li-Fi companies matrix, Signify Holding (Star) leads with its widely adopted Trulifi solutions, strong optical-wireless engineering capabilities, and broad commercial footprint across enterprise, transportation, education, and industrial environments. Its consistent product innovation and partnerships—such as deployments in airports, corporate campuses, and smart-infrastructure projects—reinforce its position as the benchmark for high-speed, secure optical connectivity. QinetiQ Group plc (Emerging Leader) is rapidly advancing with its specialized focus on resilient, defense-grade free-space optical systems for aerospace, military, and secure government communications. As demand accelerates for high-assurance, interference-free optical links across mission-critical applications, QinetiQ shows strong potential to move closer to the leaders’ quadrant.

Source: Secondary Research, Interviews with Experts, MarketsandMarkets Analysis
KEY MARKET PLAYERS
- Signify Holding (Netherlands)
- Lucibel SA (France)
- fSONA Networks Corp. (Canada)
- Wireless Excellence Limited (UK)
- Oledcomm (France)
- pureLiFi (UK)
- Acuity Brands, Inc. (US)
- Panasonic Corporation (Japan)
- Fraunhofer HHI (Germany)
- Trimble Hungary Kft. (Hungary)
- JSC Mostcom (Russia)
- LVX System (US)
- Velmenni (India)
- LightBee (Spain)
- VLNComm (US)
FSO & VLC / LI-FI MARKET SCOPE
| REPORT METRIC | DETAILS |
|---|---|
| Market Size in 2023 (Value) | USD 2.39 Billion |
| Market Forecast in 2029 (Value) | USD 7.39 Billion |
| Growth Rate | CAGR of 21.6% from 2024-2029 |
| Years Considered | 2020-2029 |
| Base Year | 2023 |
| Forecast Period | 2024-2029 |
| Units Considered | Value (USD Billion) |
| Report Coverage | Revenue forecast, company ranking, competitive landscape, growth factors, and trends |
| Segments Covered |
|
| Regions Covered | North America, Asia Pacific, Europe, South America, Middle East & Africa |
WHAT IS IN IT FOR YOU: FSO AND LI-FI, VLC MARKET SIZE, SHARE, TRENDS REPORT CONTENT GUIDE

DELIVERED CUSTOMIZATIONS
We have successfully delivered the following deep-dive customizations:
| CLIENT REQUEST | CUSTOMIZATION DELIVERED | VALUE ADDS |
|---|---|---|
| Telecom Operator / ISP |
|
|
| Enterprise / Corporate Campus Operator |
|
|
| Defense / Aerospace Agency |
|
|
| Smart City / Infrastructure Developer |
|
|
| Component / Module Supplier |
|
|
RECENT DEVELOPMENTS
- October 2025 : Signify expanded its Trulifi portfolio by partnering with Orange Business Services to deploy secure Li-Fi connectivity across corporate campuses in Europe, enhancing high-speed indoor wireless communication capabilities.
- October 2025 : pureLiFi announced a new collaboration with Getac to integrate Li-Fi modules into rugged tablets and field devices, enabling interference-free communication for defense, industrial, and emergency-response operations.
- November 2025 : LightPointe Communications launched an upgraded FSO backhaul system for telecom operators, introducing higher link stability and improved beam-tracking performance to support dense urban and 5G small-cell deployments.
- COLUMN 'A' SHOULD BE IN TEXT FORMAT AND NOT DATE FORMAT :
Table of Contents
 Exclusive indicates content/data unique to MarketsandMarkets and not available with any competitors.
Methodology
The study involved four major activities in estimating the current size of the FSO & VLC/Li-Fi market —exhaustive secondary research collected information on the market and its peer and parent markets. The next step was to validate these findings, assumptions, and sizing with industry experts across the value chain through primary research. Both top-down and bottom-up approaches were employed to estimate the total market size. After that, market breakdown and data triangulation were used to estimate the market size of segments and subsegments.
Secondary Research
Various secondary sources have been referred to in the secondary research process for identifying and collecting information important for this study. These secondary sources include FSO & VLC/Li-Fi technology journals and magazines, annual reports, press releases, investor presentations of companies, white papers, certified publications and articles from recognized authors, and directories and databases such as Factiva, Hoovers, and OneSource.
Primary Research
Various primary sources from both supply and demand sides have been interviewed in the primary research process to obtain qualitative and quantitative information important for this report. The primary sources from the supply side included industry experts such as CEOs, VPs, marketing directors, technology and innovation directors, and related executives from key companies and organizations operating in the FSO & VLC/Li-Fi market. After complete market engineering (including calculations regarding market statistics, market breakdown, market size estimations, market forecasting, and data triangulation), extensive primary research was conducted to gather information as well as to verify and validate the critical numbers arrived at.
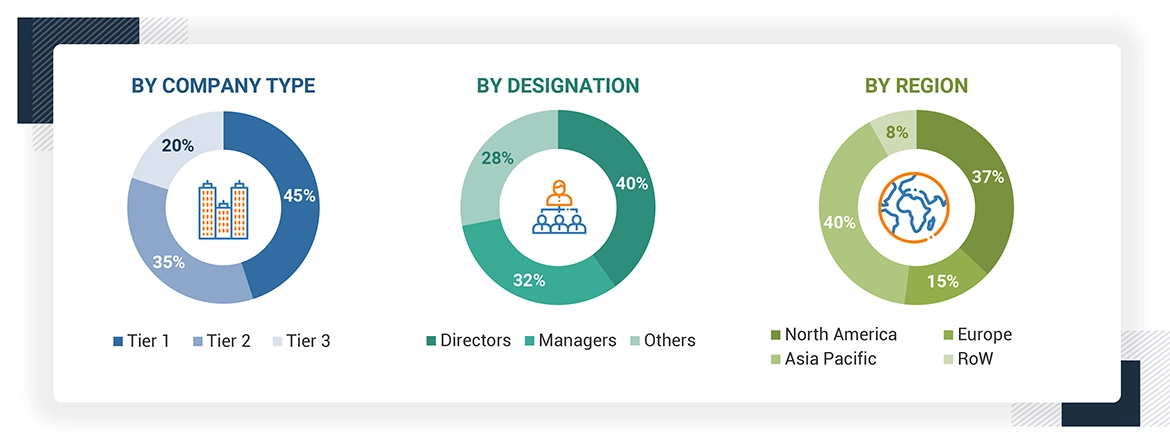
Note: Other designations include sales, marketing, and product managers. Tier 1 = USD 1 billion, Tier 2 = USD 0.5–1.0 billion, and Tier 3 = USD 0.5 billion.
About the assumptions considered for the study, To know download the pdf brochure
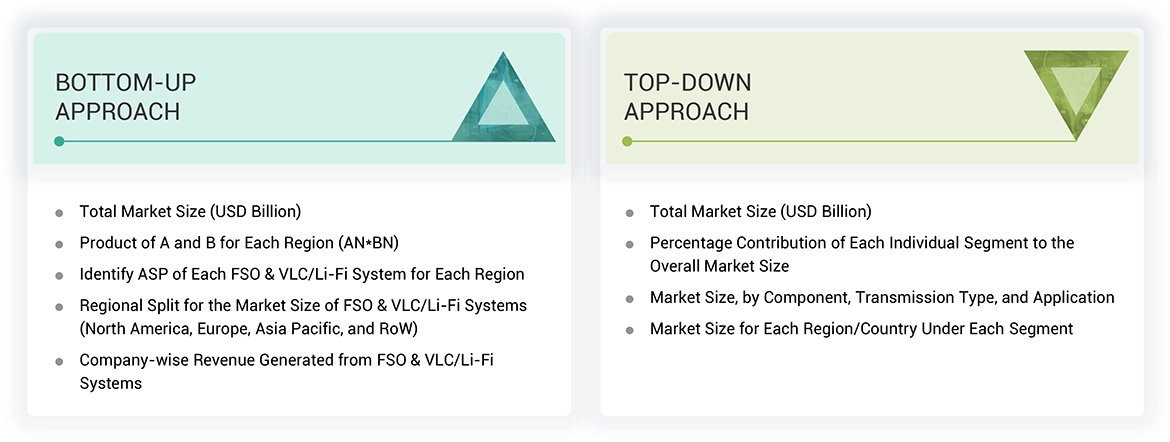
Market Size Estimation
In the complete market engineering process, both top-down and bottom-up approaches have been implemented, along with several data triangulation methods, to estimate and validate the size of the FSO & VLC/Li-Fi market and other dependent submarkets listed in this report.
- Extensive secondary research has identified key players in the industry and market.
- In terms of value, the industry’s supply chain and market size have been determined through primary and secondary research processes.
- All percentage shares, splits, and breakdowns have been determined using secondary sources and verified through primary sources.
FSO & VLC / Li-Fi Market : Top-Down and Bottom-Up Approach
Data Triangulation
After arriving at the overall market size from the estimation process explained above, the global market has been split into several segments and subsegments. Market breakdown and data triangulation procedures have been employed wherever applicable to complete the overall market engineering process and arrive at exact statistics for all segments and subsegments. The data has been triangulated by studying various factors and trends identified from both the demand and supply sides.
Market Definition
Optical wireless communication (OWC) is a technology that uses unguided visible, infrared (IR), or ultraviolet (UV) light rays to transmit data signals for the purpose of optical communication. Based on the range of light spectrum used for communication purposes, OWC can be further categorized into free space optics (FSO) and visible light communication (VLC).
FSO is a line of sight (LoS) technology that uses lasers to transmit data, but instead of enclosing the data stream in a glass fiber, it is transmitted through the air. Generally, lasers are used as transmitters in the FSO system.
VLC is a communication technology in which visible light is used as a medium to transmit and receive data between two devices installed within the LoS. Light fidelity (Li-Fi) is a VLC system that transmits wireless internet communications at very high speeds by using near-IR and near-UV light-emitting diodes (LEDs) to transmit data and photodiodes to receive data. Li-Fi offers better bandwidth, efficiency, connectivity, and security than Wi-Fi systems with VLC technology.
Key Stakeholders
- Raw Material and Manufacturing Equipment Suppliers
- Electronic Design Automation (EDA) and Design Tool Vendors
- Product Manufacturers and Suppliers
- Component Manufacturers
- Original Equipment Manufacturers (OEMs)
- Integrated Device Manufacturers (IDMs)
- Original Design Manufacturers (ODMs)
- ODM and OEM Technology Solution Providers
- Software Service Providers
- Assembly, Testing, and Packaging Vendors
- Technology, Service, and Solution Providers
- Intellectual Property (IP) Core and Licensing Providers
- Suppliers and Distributors
- Government and Other Regulatory Bodies
- Technology Investors
- Research Institutes and Organizations
- Market Research and Consulting Firms
Report Objectives
The following are the primary objectives of the study.
- To forecast the free space optics (FSO) market, in terms of value, based on component, application, vertical, and region
- To forecast the visible light communication (VLC)/light fidelity (Li-Fi) market, in terms of value, based on component, transmission type, application, and region
- To provide detailed information regarding the drivers, restraints, opportunities, and challenges influencing the growth of the market
- To study the complete value chain and related industry segments and conduct a value chain analysis of the FSO & VLC/Li-Fi market landscape
- To describe and forecast the market, in terms of value, for various segments across four main regions: North America, Asia Pacific, Europe, and Rest of the World (RoW)
- To strategically analyze the ecosystem, regulatory landscape, patent landscape, Porter’s Five Forces, import and export scenarios for products covered under HS code 853950 trade landscape, and case studies pertaining to the market under study
- To strategically analyze micromarkets1 with respect to individual growth trends, prospects, and their contributions to the overall market
- To analyze opportunities for stakeholders by identifying high-growth segments in the market
- To strategically profile the key players and provide a detailed competitive landscape of the FSO & VLC/Li-Fi market
- To analyze strategic approaches adopted by the leading players in the FSO & VLC/Li-Fi market, including product launches, recent developments, and acquisitions
Available Customizations
With the given market data, MarketsandMarkets offers customizations according to a company’s specific needs. The following customization options are available for the report:
Company Information
- Detailed analysis and profiling of additional market players (up to 5)
Need a Tailored Report?
Customize this report to your needs
Get 10% FREE Customization
Customize This ReportPersonalize This Research
- Triangulate with your Own Data
- Get Data as per your Format and Definition
- Gain a Deeper Dive on a Specific Application, Geography, Customer or Competitor
- Any level of Personalization
Let Us Help You
- What are the Known and Unknown Adjacencies Impacting the Free Space Optics (FSO) and Visible Light Communication (VLC)/ Li-Fi Market
- What will your New Revenue Sources be?
- Who will be your Top Customer; what will make them switch?
- Defend your Market Share or Win Competitors
- Get a Scorecard for Target Partners

Custom Market Research Services
We Will Customise The Research For You, In Case The Report Listed Above Does Not Meet With Your Requirements
Get 10% Free CustomisationTESTIMONIALS

Tetsuya Ohhira
Business Development Manager-Technology Business
Nikon Corporation,
Leading Japanese MNC specializing in optics and imaging productswww.nikon.com
MarketsandMarkets™ response
is quick. Their attitude is flexible and positive. Analyst Insights are globally considered and
significant. Client Services quickly respond to our inquiry and demand. Their wide range of global
surveys help us make our strategic plan.
We hope Knowledge Store will be easier to search
for a report.
VP - Marketing & Business Development
Leading Provider of Process Control Solutions
We engaged with MarketsandMarkets on a study to perform an analysis and recommend a Go-To-Market strategy for metrology and process control in the semiconductor market. The study was tailored to our targets and needs with well-defined milestones. Our overall experience with the MarketsandMarkets team was very good throughout the project in all aspects including the analysis methodologies used, the quality and depth of primary and secondary data sets, the professionalism and flexibility of the team and the ability to meet the target schedule and milestones. We want to thank MarketsandMarkets team for a job well done.
Growth opportunities and latent adjacency in Free Space Optics (FSO) and Visible Light Communication (VLC)/ Li-Fi Market


Kes
Oct, 2017
Does this FSO report include data by the country? I have seen some report aggregator/reseller has similar report for different regions by country. But I prefer to buy from the original publisher. Also, the number of companies included seems to be a subset in the market (as compared and mentioned by those other reports). Is this the most up to date version?.
Caleb
Apr, 2026
What is the long-term scalability of FSO and Li-Fi compared to traditional RF and optical fiber communication systems.
Liam
Apr, 2026
What role will Li-Fi play in future smart buildings, IoT ecosystems, and indoor connectivity markets?.
tien
Sep, 2014
I am interested in the below mentioned report: Visible Light Communication (VLC)/Light Fidelity (Li-Fi) & Free Space Optics (FSO) Market by Component, Applications (Terrestrial, Mobile, & Satellite for FSO & Communication, Automotive, Healthcare, Aerospace, & Underwater for VLC/Li-Fi), & Geography - Analysis & Forecast to 2014 - 2020.
Gary
Apr, 2026
Is this the right time to invest in the Free Space Optics (FSO) and VLC/Li-Fi market, or should I wait for broader adoption and clearer revenue visibility?.
Roger
Apr, 2026
Are the current market leaders well-positioned to dominate, or is there still room for startups to disrupt and capture significant market share.
Varun
Jun, 2017
Want to learn about the global FSO market. Particularly, who are the key players? How much are they charging? Where is the max opportunity?.
Jean-Philippe
Feb, 2016
I am writing a news article about LIFI. Can you share the VLC market research report please ? Do you update it yearly ?.
Jonas
Mar, 2016
I am a young online marketer and happen to be curious about Life. Do you have some cheaper option for learning more about Life? ($4k is way above my budget).
Josane
Feb, 2019
I want more information about consumer electronics application of FSO market report..
Chien-Ta
Dec, 2013
I am interested in the following sections of the report Visible light communication, wavelength dividing multiplexing, interference rejection, algorithm development..
Manoj
Nov, 2016
We would be interested in the Global report of FSO added by in depth study in Asia & India Market. I am and individual (Senior Citizen) doing Free Social Service in the Education sector and humbly request you to offer me the best commercial terms for my perusal. Your kind co-operation in the matter shall be highly appreciated. Awaiting your early reply per return and oblige..
RAFAEL
May, 2015
We are researching on VLC from 2004 and we have created a spin-off company working on wireless optics..
Rita
Mar, 2019
I would like to get some information of the FSO market breakdown by applications..
David
Feb, 2013
My interest is in the FSO Communications market outlook. Any/all information focused around this would be great..
Mathew
Dec, 2014
Seeking to obtain as much information as possible on Light fidelity, home automation, and Visible Light Communications; along with any other related information..
abdelmoula
Nov, 2019
I need this catalogue: VISIBLE LIGHT COMMUNICATION (VLC)/Li-Fi TECHNOLOGY & FREE SPACE OPTICS (FSO) MARKET (2013 � 2018)..
Jason
Oct, 2015
I want a more detailed explanation as to what have you added in the component section..
Gwen
Oct, 2015
We are interested in the following: Visible Light Communication (VLC) Market by Component, Application (Smart Store, Consumer Electronics, Defense, Transportation, Aviation, Hospital, Underwater, and Hazardous Environment), and by Geography - Global forecast to 2020.
Amit
Oct, 2015
My final year seminar topic is based on Li-Fi Technology and thinking of doing project on this topic. Can you please provide free sample of report?.
Najibu
Aug, 2019
Do you provide only the information related to applications of FSO market?.
Marwa
Jun, 2016
I am interested in the report: Free Space Optics (FSO) and Visible Light Communication (Li Fi) Market by Component, Application (Smart Store, Consumer Electronics, Defense, Transportation, Aviation, Hospital, Underwater, and Hazardous Environment), and by Geography - Global forecast .
Sameer
Jun, 2015
VLC Communication in USA & France. Want to know the list of companies profiled specifically for US & France Market..
Sahar
Jun, 2016
We need to make a network using FSO in some desert area for new investments..
Wojciech
Jan, 2015
I would like to get access to the FSO & VLC report because I am writing a report about VLC for studies..