
Pipe Insulation Market

Pipe Insulation Market by Material Type (Rock wool, Glass wool, PU R /PIR foam, Phenolic foam, Elastomeric foam), by Application (Industrial, Oil, Gas, District Energy Systems, Building & Construction), and Region - Global Forecast to 2030
Updated on : November 27, 2025


PIPE INSULATION MARKET OVERVIEW
Source: Secondary Research, Interviews with Experts, MarketsandMarkets Analysis
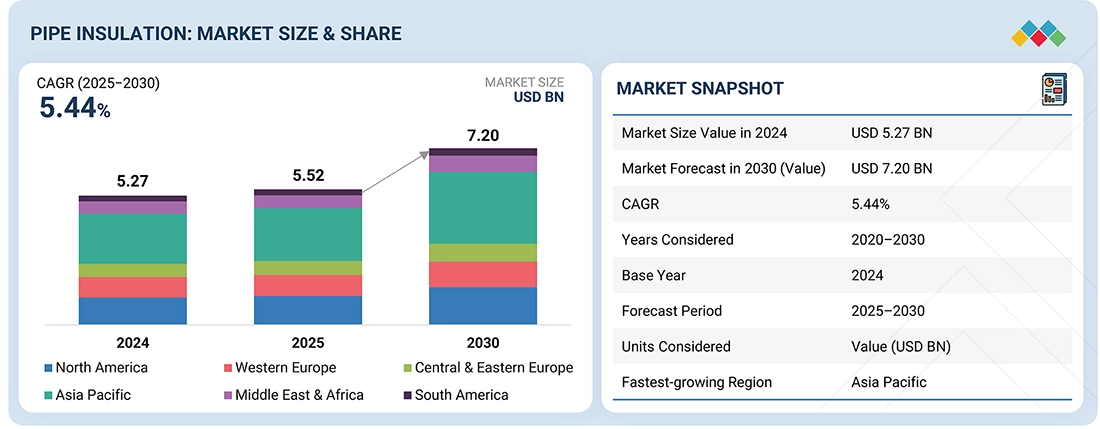
The global pipe insulation market is projected to grow from USD 5.27 billion in 2024 to USD 7.20 billion by 2030, at a CAGR of 5.44% from 2025 to 2030. This growth is driven by demand from building and construction, industrial, oil, gas, district energy systems, and other sectors. Pipe insulations are materials or combinations of materials wrapped around pipes to slow the flow of heat energy. Pipe insulation significantly reduces energy losses and, consequently, energy costs. Piping must be insulated according to the insulation class, operating temperature, and insulation thickness specified in the piping and instrumentation diagram (P&ID). Pipe insulation consists of materials or a combination of materials that add a protective barrier to pipes and reduce heat loss or gain from surfaces operating at temperatures above or below ambient. It prevents condensation on pipework and acts as a barrier against moisture buildup inside pipes, which can lead to various types of corrosion. Pipe insulation solutions can be used across multiple industries, such as industrial, chemical, water treatment, and HVAC, among others, to reduce energy consumption and manage equipment more effectively.
KEY TAKEAWAYS
-
BY MATERIAL TYPEGlass wool is the largest type of pipe insulation material, given its balanced thermal and acoustic properties, cost-effectiveness, and versatility across various industries. Made from fiberglass fibers, it can withstand high temperatures, making it suitable for hot and cold piping systems that require temperature stability. Its non-combustible nature and good fire resistance make it ideal for commercial buildings, HVAC systems, and industrial facilities with strict safety standards. Additionally, its lightweight and flexible qualities make handling, transportation, and installation easier, helping to reduce labor and operational costs. Greater availability and lower raw material costs compared to other high-end options like aerogels or polyisocyanurate make glass wool especially popular in price-sensitive markets and large-scale insulation projects.
-
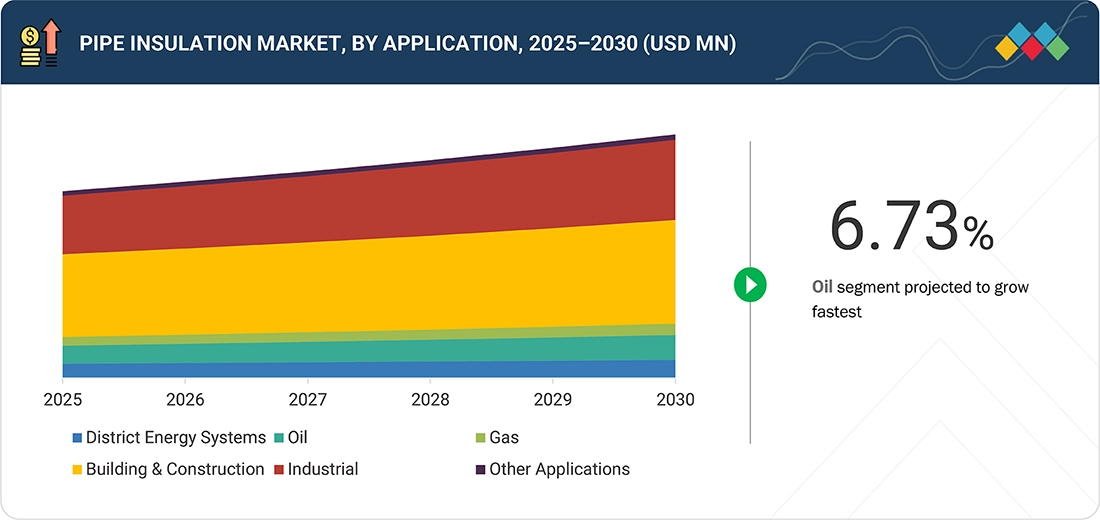
BY APPLICATIONThe building and construction industry is evidently at the forefront of the pipe insulation market. Energy efficiency holds paramount importance, especially as urban skylines expand rapidly and regulatory authorities impose more stringent building codes. Corporations can no longer disregard insulation; it has become an integral component of project specifications. With thriving construction activities across residential, commercial, and institutional sectors, there exists considerable pressure to diminish energy consumption and heat loss within plumbing and HVAC systems. Pipe insulation now plays a crucial role in supporting organizations to meet their energy objectives, control operational expenses, and ensure occupant comfort. Furthermore, government agencies are enforcing compliance with energy standards such as LEED, BREEAM, and rigorous national codes. Developers and asset managers are compelled to incorporate insulation during the design phase to avoid lagging behind. Rising energy prices are also prompting increased investment in insulation to manage long-term utility costs. The growing adoption of advanced HVAC systems—such as underfloor heating and central air conditioning—further fuels demand. Additionally, there is a notable effort to retrofit aging infrastructure in mature markets, while emerging economies are experiencing rapid construction growth. This expansion continues to broaden the market.
-
BY REGIONThe pipe insulation market in South America is expected to have the third-largest CAGR during the forecast period, mainly due to increased investments in infrastructure, energy, and industrial development. Growth in construction, urbanization, and energy demand in Brazil, Argentina, and Chile is boosting the adoption of insulated piping systems. Expansion in the oil & gas industry, especially offshore exploration and pipeline network growth, also drives demand for thermal insulation to enhance operational efficiency and safety. Governments and regulatory bodies in South America are starting to enforce energy efficiency standards and promote sustainable development and construction practices, supporting the adoption of insulation materials. Additionally, the rising need for HVAC systems in residential and commercial buildings, driven by increasing temperatures and urbanization, will raise awareness and use of pipe insulation as part of energy performance strategies. As awareness of energy conservation and building efficiency grows, South America is rapidly becoming a key market for pipe insulation solutions.
-
COMPETITIVE LANDSCAPEThe major market players have adopted both organic and inorganic strategies, including expansion, collaborations, partnerships, acquisitions, and investments. For instance, Saint-Gobain partnered with Knauf Insulation to boost fiberglass insulation production, aiming at North America’s building sector to meet rising energy efficiency demands amidst US tariffs.
Pipe insulation is crucial across various industries because it enhances energy efficiency, safety, and optimal performance. In thermal systems, insulation minimizes heat loss or gain to maintain process temperatures, reduce energy use, and improve overall system efficiency. This is especially important in sectors like oil & gas, power generation, food processing, and chemicals, where precise temperature control is vital for product quality and process stability. Pipe insulation also prevents condensation on chilled surfaces, reducing the risks of corrosion, mold growth, and structural damage—key concerns in HVAC, refrigeration, and water treatment systems. Additionally, it helps create safer workplaces by protecting workers from contact with very hot or cold pipe surfaces. Increasing pressures to meet regulatory, environmental, and corporate reputation standards are encouraging businesses to adopt more pipe insulation, which is further expanding the market in global production and consumption regions.
TRENDS & DISRUPTIONS IMPACTING CUSTOMERS' CUSTOMERS
Megatrends like digital transformation and renewables will influence a company's revenue in the future. Emerging trends and technologies in the industry include ECOSE technology, pure fiber technology, XPS foam technology, interlocking fiber technology, and fiber glass board technology. The pipe insulation market is expected to grow significantly during the forecast period due to increasing demand from end-use industries such as oil & gas..
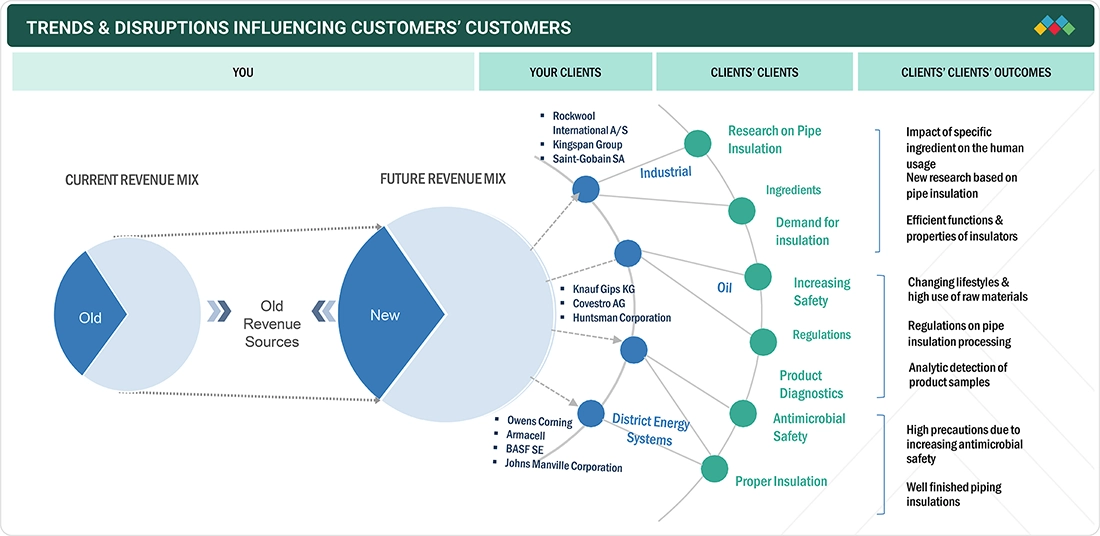
Source: Secondary Research, Interviews with Experts, MarketsandMarkets Analysis
PIPE INSULATION MARKET DYNAMICS
Level
-
Growth in oil and gas demand

-
Development of green buildings

Level
-
Volatile prices of plastic foams

Level
-
Availability of green insulation materials

Level
-
Health and safety related incidents due to Corrosion Under Insulation (CUI)

Source: Secondary Research, Interviews with Experts, MarketsandMarkets Analysis
Driver: Growth in oil and gas demand
Expansion in the oil & gas sector is a major driver for the pipe insulation market because this industry heavily depends on insulated piping systems for upstream and downstream processes. During exploration and production, especially in harsh environments like offshore platforms or the Arctic, insulation is crucial for maintaining optimal flow temperatures, preventing hydrate formation, and avoiding pipe freezing or overheating. When fluids and gases are transported at high temperatures during refining and processing, thermal insulation helps reduce heat loss, improve energy efficiency, and ensure safe operation. Pipe insulation also prevents corrosion under insulation (CUI), a significant issue in oil and gas facilities where pipelines are exposed to moisture and extreme conditions. With global energy demand continuing to grow, investments in new oil and gas facilities, including refineries, LNG terminals, and petrochemical plants, are increasing, particularly in the Middle East, North America, and Asia Pacific. These projects require high-quality, durable insulation materials that can withstand extreme temperatures, pressures, and chemical exposure. Additionally, regulatory requirements for energy conservation and emission control further support the adoption of effective insulation systems, thereby stimulating the growth of the pipe insulation market in the oil and gas industry.
Restraint: Volatile prices of plastic foams
Unstable plastic foam prices significantly hamper the growth of the pipe insulation market. Plastic foams such as polyurethane (PU), polyisocyanurate (PIR), and expanded polystyrene (EPS) are widely used in pipe insulation because of their excellent thermal properties, light weight, and cost-effectiveness. However, their prices are closely linked to crude oil and natural gas costs since they are produced from petrochemical feedstocks. Fluctuations in global oil prices, driven by geopolitical conflicts, supply disruptions, and changing demand patterns, directly impact the cost of producing plastic foam. Such unpredictable cost swings make it challenging for insulation manufacturers and end users to maintain stable budgets, particularly in large industrial and infrastructure projects. Rising raw material costs can lead to decreased adoption of plastic foam insulation, especially in price-sensitive economies or among small contractors. Moreover, repeated price changes can deter long-term purchase agreements and inhibit investment in new insulation technologies or capacity upgrades. Environmental concerns and regulatory initiatives aimed at reducing fossil-based material use are also pushing the market toward greener alternatives, further impacting pricing dynamics. As a result, the volatility in plastic foam prices creates economic uncertainty and limits market growth and competitiveness in the pipe insulation industry.
Opportunity: Availability of green insulation materials
The availability of green insulation materials presents significant growth opportunities for the pipe insulation industry, driven by rising environmental awareness, stricter energy efficiency regulations, and a global shift toward sustainable construction practices. These eco-friendly materials—such as mineral wool, aerogels, cellulose, cork, and bio-based foams—are increasingly adopted as alternatives to traditional petrochemical-based insulation, offering high thermal performance, a lower environmental impact, and improved recyclability. This aligns with global goals for carbon reduction and circular economy initiatives. As governments and industry groups introduce incentives and certifications like LEED, BREEAM, and green tax credits for green buildings and infrastructure, demand for environmentally friendly insulation solutions is rising. Additionally, industries face pressure to meet ESG targets, with green insulation serving as an effective way to bolster sustainability efforts. Technological advancements are making green products more affordable and durable, expanding their use in sectors such as HVAC, industrial processing, and district energy systems. This trend creates new opportunities for manufacturers to innovate, diversify their product lines, and meet consumer demand for safer, non-toxic, energy-efficient products. The growing availability and acceptance of green insulation suggest a powerful, long-term drive toward sustainable growth in the global pipe insulation market.
Challenge: Health and safety related incidents due to Corrosion Under Insulation (CUI)
The corrosion under insulation (CUI) issue is a major one in the pipe insulation market as it involves significant health, safety-, and operational-hazard considerations. Insulated pipes suffer from CUI when water or moisture finds its way through damaged insulation and rests on the surface of the metal pipe, causing accelerated corrosion. Such situations are extremely common in oil & gas, chemical processing, and power generation industries, where pipelines are usually carrying either high-temperature or hazardous fluids. Corrosion weakens pipe walls over a period, raising the chances of pipe leakages, equipment-failure, and, in extreme cases, explosions, or toxic spills. From a health and safety perspective, CUI presents a hazard to workers who might be exposed to hazardous chemicals or may get in touch with extremely hot surfaces if the insulation is compromised. Maintenance and repair are complicated by the concealed nature of corrosion beneath the insulation, leading to delayed detection and costly repairs. Moreover, removal and replacement of insulation often become necessary for the treatment of CUI and that adds to operational downtime and maintenance expenses. The challenge of CUI underscores the importance of selecting appropriate insulation materials, applying correct installation techniques, and implementing effective moisture control strategies. Despite advancements in insulation technology, CUI remains a persistent issue that limits performance and safety, challenging the long-term reliability of pipe insulation systems.
Pipe Insulation Market: COMMERCIAL USE CASES ACROSS INDUSTRIES
| COMPANY | USE CASE DESCRIPTION | BENEFITS |
|---|---|---|
 |
Insulates high-temperature pipelines in industries like oil, gas, and chemicals | Saves energy, improves safety, prevents heat loss, extends pipe life |
 |
Insulates heating and cooling pipes in commercial buildings | Reduces energy use, noise, condensation, and maintenance costs |
 |
Insulates hot and cold water pipes in homes and offices | Prevents freezing, maintains temperature, saves energy, protects pipes |
 |
Insulates ultra-low temperature fluid pipes like LNG or nitrogen | Maintains temperature, reduces product loss, ensures safety, prevents frost |
 |
Insulates urban heating or cooling network pipes | Reduces heat loss, improves efficiency, lowers costs, prolongs system life |
Logos and trademarks shown above are the property of their respective owners. Their use here is for informational and illustrative purposes only.
PIPE INSULATION MARKET ECOSYSTEM
The pipe insulation market ecosystem consists of a well-connected value chain involving raw material suppliers, manufacturers, distributors, and end-users. Raw material suppliers deliver essential inputs such as foams, fiberglass, rockwool, and elastomers, which manufacturers process into insulation products designed for thermal, acoustic, and cryogenic uses. Distributors and channel partners play a vital role in connecting manufacturers with regional markets, ensuring product availability and technical support. End users in industries like oil & gas, power, and construction drive demand by prioritizing energy efficiency, safety, and operational cost savings.
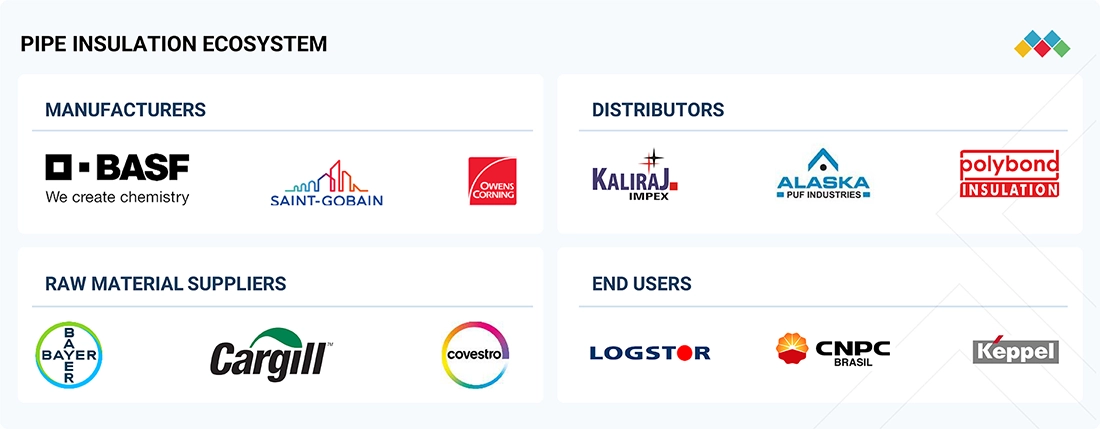
Logos and trademarks shown above are the property of their respective owners. Their use here is for informational and illustrative purposes only.
PIPE INSULATION MARKET SEGMENTS
Source: Secondary Research, Interviews with Experts, MarketsandMarkets Analysis
Pipe Insulation Market, By Material Type
The PU (polyurethane) and PIR (polyisocyanurate) foam materials are expected to have the third-highest CAGR in the pipe insulation market during the forecast period due to their excellent thermal performance, high mechanical strength, and broad range of applications. These foams have low thermal conductivity, making them highly effective for insulating hot and cold applications in industrial, commercial, and district energy settings. While PU offers low thermal resistance, PIR foams provide even greater fire resistance and higher thermal stability than standard PU, giving them an advantage in high-temperature markets such as oil & gas or chemical processing facilities.
Pipe Insulation Market, By Application
The gas application sector is projected to be the third fastest-growing segment within the pipe insulation market during the forecast period, attributable to the rising global demand for natural gas and the expansion of gas infrastructure. Maintaining temperature stability in gas distribution and transmission systems is vital to prevent condensation or freezing, especially in colder climates and high-pressure conditions. Pipe insulation plays a crucial role in ensuring operational efficiency, safety, and energy conservation across the entire gas supply chain, from extraction and processing to transportation and distribution.
REGION
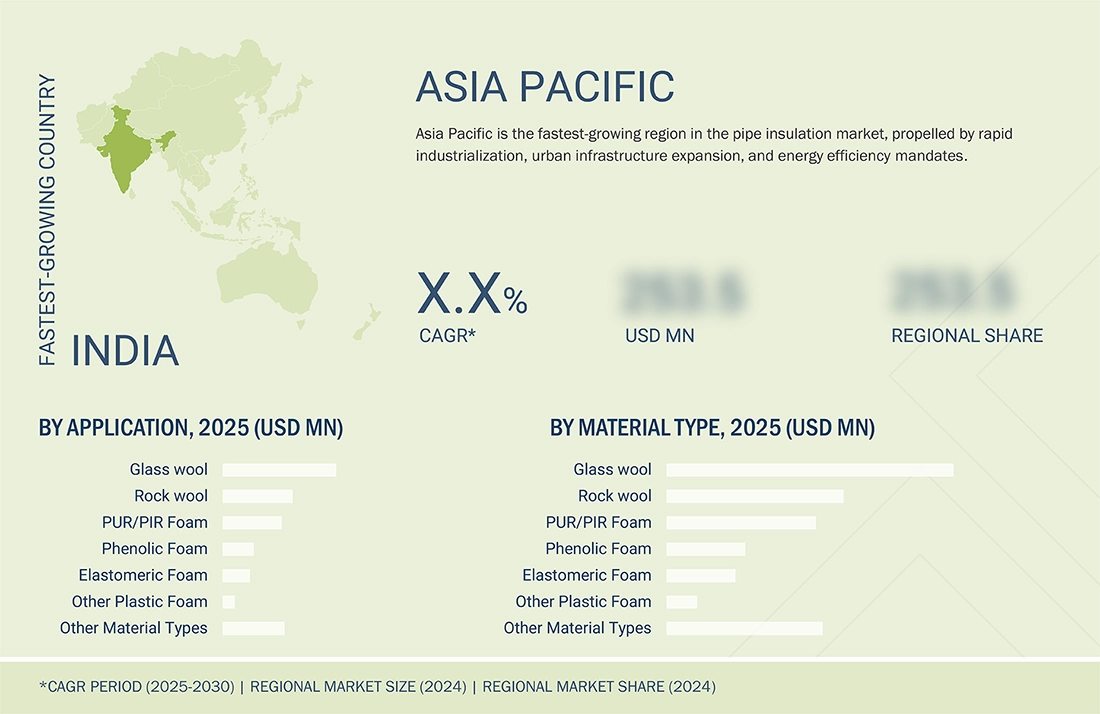
Asia Pacific accounts for largest share of global pipe insulation market
Asia Pacific is not merely participating in the pipe insulation industry; it is assuming a leadership role. Rapid industrialization, ambitious urban planning, and extensive infrastructure development in China, India, Japan, and South Korea are setting the pace. Construction activities are widespread, and pipe insulation has become an essential component for enhancing energy efficiency and preventing operational disruptions. The expanding middle class, rising energy consumption, and a growing emphasis on sustainability—no longer just a trendy term—are compelling factors influencing the market. Governments across the region are enacting stricter regulations on energy conservation, adopting green building codes, and establishing efficiency standards. These developments collectively contribute to increased demand for high-quality pipe insulation solutions across both public and private sectors. Cost efficiency further enhances regional competitiveness; access to inexpensive raw materials and labor enables manufacturers to offer competitive prices without compromising quality. Given these factors—robust economic growth, escalating energy concerns, and a rapidly expanding industrial base—Asia Pacific is evidently commanding the global pipe insulation market in 2024.
Pipe Insulation Market: COMPANY EVALUATION MATRIX
Within the pipe insulation market matrix, Saint-Gobain S.A. (Star) maintains a prominent market position with an extensive product portfolio, fostering widespread adoption across various applications. Covestro AG (Emerging Leader) is progressively gaining momentum owing to its diversified product portfolio and ongoing investments in research and development. While Saint-Gobain S.A. excels through its scale, Covestro AG demonstrates significant growth potential to progress toward the leaders’ quadrant.

Source: Secondary Research, Interviews with Experts, MarketsandMarkets Analysis
PIPE INSULATION MARKET PLAYERS
MARKET SCOPE
| REPORT METRIC | DETAILS |
|---|---|
| Market Size Value in 2024 | USD 5.27 BN |
| Revenue Forecast in 2030 | USD 7.20 BN |
| Growth Rate | CAGR of 5.44% from 2025-2030 |
| Years Considered | 2020-2030 |
| Base Year | 2024 |
| Forecast Period | 2025-2030 |
| Units Considered | Value (USD Billion) |
| Report Coverage | Revenue forecast, company ranking, competitive landscape, growth factors, and trends |
| Segments Covered |
|
| Regional Scope | Asia Pacific, North America, Western Europe, Central & Eastern Europe, South America, Middle East & Africa |
WHAT IS IN IT FOR YOU: Pipe Insulation Market REPORT CONTENT GUIDE
DELIVERED CUSTOMIZATIONS
We have successfully delivered the following deep-dive customizations:
| CLIENT REQUEST | CUSTOMIZATION DELIVERED | VALUE ADDS |
|---|---|---|
| Europe -based Pipe Insulation Manufacturer |
|
|
| Asia Pacific-based Pipe Insulation Manufacturer |
|
|
RECENT DEVELOPMENTS
- April 2025 : Saint-Gobain partnered with Knauf Insulation to enhance fiberglass insulation production, targeting North America’s building sector to meet rising energy efficiency demands amidst US tariffs.
- May 2025 : BASF SE acquired DOMO Chemicals’ 49% share in Alsachimie JV, strengthening its position in polyamide-based insulation materials for pipe applications in Europe’s construction sector.
- November 2024 : BASF SE collaborated with Acies Bio to develop a platform for producing fatty alcohols from methanol, enhancing sustainable pipe insulation materials for construction and industrial use.
- August 2024 : Saint-Gobain S.A. acquired a minority stake in BioInsulate, a German startup, to develop bio-based insulation materials, supporting Europe’s Green Deal goals for sustainable pipe insulation solutions.
Table of Contents
 Exclusive indicates content/data unique to MarketsandMarkets and not available with any competitors.
Methodology
The study involved four major activities in estimating the market size for the pipe insulation market. Exhaustive secondary research was done to collect information on the market, the peer market, and the parent market. The next step was to validate these findings, assumptions, and sizing with industry experts across the value chain through primary research. Both top-down and bottom-up approaches were employed to estimate the complete market size. After that, the market breakdown and data triangulation procedures were used to estimate the market size of the segments and subsegments.
Secondary Research
Secondary sources used in this study included annual reports, press releases, and investor presentations of companies; white papers; certified publications; articles from recognized authors; and gold standard & silver standard websites such as Factiva, ICIS, Bloomberg, and others. The findings of this study were verified through primary research by conducting extensive interviews with key officials such as CEOs, VPs, directors, and other executives. The breakdown of profiles of the primary interviewees is illustrated in the figure below:
Primary Research
The pipe insulation market comprises several stakeholders, such as raw material suppliers, end-product manufacturers, and regulatory organizations in the supply chain. The demand side of this market is characterized by key opinion leaders in various applications for the pipe insulation market. The supply side is characterized by advancements in technology and diverse application industries. Various primary sources from both the supply and demand sides of the market were interviewed to obtain qualitative and quantitative information.
Breakdown Of Primary Participants

Note: Tier 1, Tier 2, and Tier 3 companies are classified based on their market revenue in 2023/2024, available in the public domain, product portfolios, and geographical presence.
Other designations include consultants and sales, marketing, and procurement managers.
To know about the assumptions considered for the study, download the pdf brochure
| COMPANY NAME | DESIGNATION | |
|---|---|---|
| Saint-Gobain S.A. | Senior Manager | |
| BASF SE | Innovation Manager | |
| Johns Manville | Vice-President | |
| Owens Corning | Production Supervisor | |
| Kingspan Group plc | Sales Manager | |
Market Size Estimation
Both top-down and bottom-up approaches were used to estimate and validate the total size of the pipe insulation market. These methods were also used extensively to estimate the size of various subsegments in the market. The research methodology used to estimate the market size includes the following:
- The key players in the industry have been identified through extensive secondary research.
- The supply chain of the industry has been determined through primary and secondary research.
- All percentage shares, splits, and breakdowns have been determined using secondary sources and verified through primary sources.
- All possible parameters that affect the markets covered in this research study have been accounted for, viewed in extensive detail, verified through primary research, and analyzed to obtain the final quantitative and qualitative data.

Data Triangulation
After arriving at the overall market size—using the market size estimation processes as explained above—the market was split into several segments and subsegments. To complete the overall market engineering process and arrive at the exact statistics of each market segment and subsegment, data triangulation, and market breakdown procedures were employed, wherever applicable. The data was triangulated by studying various factors and trends from both the demand and supply sides in the pipe insulation industry.
Market Definition
Pipe insulations are materials or combinations of materials wrapped around pipes that hinder the flow of heat energy. Pipe insulation significantly reduces energy losses and consequently lowers energy costs. Piping must be insulated according to the insulation class, operating temperature, and insulation thickness specified in the piping and instrumentation diagram (P&ID). Pipe insulation includes materials or a combination of materials that provide a protective covering for pipes and minimize heat loss or heat gain from surfaces operating at temperatures above or below the ambient temperature. It prevents condensation on pipework, serving as a protective barrier against moisture that can accumulate inside a pipe and cause various types of corrosion. Pipe insulation solutions can be implemented across multiple industries, such as industrial, chemical & water treatment, and HVAC, among others, to decrease energy consumption and efficiently manage equipment.
Stakeholders
- Pipe Insulation Manufacturers
- Pipe Insulation Distributors
- Raw Material Suppliers
- Service Providers
- Packaging Companies
- Government and Research Organizations
Report Objectives
- To analyze and forecast the size of the global pipe insulation market in terms of value
- To provide detailed information about the important drivers, restraints, challenges, and opportunities influencing market growth
- To define, describe, and segment the market based on material type, application, and region
- To forecast the size of the market segments based on regions such as Asia Pacific, North America, Western Europe, Central & Eastern Europe, the Middle East & Africa, and South America
- To strategically analyze the segmented markets with respect to individual growth trends, prospects, and contributions to the overall market
- To identify and analyze opportunities for stakeholders in the market
- To analyze competitive developments such as expansions, partnerships & collaborations, mergers & acquisitions, agreements, and product launches in the market
- To strategically profile the key companies and comprehensively analyze their core competencies
Key Questions Addressed by the Report
Who are the major players in the pipe insulation market?
The key players include Saint-Gobain S.A. (France), BASF SE (Germany), Johns Manville (US), Owens Corning (US), Kingspan Group PLC (UK), Rockwool A/S (Denmark), Covestro AG (Germany), Huntsman Corporation (US), Armacell (Luxembourg), and Knauf Insulation (US), among others.
What are the drivers and opportunities for the pipe insulation market?
Major drivers include growth in oil & gas demand, development of green buildings, stringent regulations, and the need to reduce energy consumption and costs. The availability of green insulation materials presents new market opportunities.
Which strategies are the key players focusing on in the pipe insulation market?
Product launches, partnerships, mergers & acquisitions, agreements, and expansions are key strategies used to enhance global market presence.
What is the expected growth rate of the pipe insulation market between 2025 and 2030?
The market is projected to grow at a CAGR of 5.4% during the forecast period.
What major factors are likely to hinder the growth of the pipe insulation market during the forecast period?
Volatile prices of plastic foams are expected to restrict market growth.
Need a Tailored Report?
Customize this report to your needs
Get 10% FREE Customization
Customize This ReportPersonalize This Research
- Triangulate with your Own Data
- Get Data as per your Format and Definition
- Gain a Deeper Dive on a Specific Application, Geography, Customer or Competitor
- Any level of Personalization
Let Us Help You
- What are the Known and Unknown Adjacencies Impacting the Pipe Insulation Market
- What will your New Revenue Sources be?
- Who will be your Top Customer; what will make them switch?
- Defend your Market Share or Win Competitors
- Get a Scorecard for Target Partners

Custom Market Research Services
We Will Customise The Research For You, In Case The Report Listed Above Does Not Meet With Your Requirements
Get 10% Free CustomisationTESTIMONIALS

We at Nissan Chemicals Corporation have been clients of MarketsandMarkets for more than a year now. We recently consulted MarketsandMarkets for a study, the team at MarketsandMarkets was extremely professional and organized. The business insights were very detailed and aligned well with our expectations that really helped us formulate the Business Plans and device new strategies for development themes. MarketsandMarkets offers a unique combination of expertise and dedicated engagement model. Their research findings have helped us in designing our Pricing Strategy which will make it easier for us to predict the future sales and profits for the next ten years. We look forward to working with MarketsandMarkets in the future.
VP of Strategy & New Business Development
Leading Specialty Chemical Company
The MarketsandMarkets Engagement Model, composed of both the Knowledge Store and advisory custom research, has greatly helped us in understanding our markets and making strategic decisions. The Knowledge Store is a fast way to allow everyone in our organization to understand more about most any market they are interested in. The ability to then get custom research done and get answers to specific strategic questions and market insight has been spectacular. The Markets and Markets team feel more like colleagues than vendors and their services have helped us change our culture where statements of things like growth opportunities and competitive position are always backed by industry research.

Rich Gibson,
Director, Corporate Strategy
Milliken & Company,
Leading Industrial Manufacturer of specialty chemical, floor covering, performance and protective textile materials, and healthcaremilliken.com
MarketsandMarkets is a trusted resource that helps us to better understand markets that are near-adjacencies-whether its technology, value chain or geography. Their Knowledge Store platform provides a dashboard of markets and their characteristics which is easy to use and saves us time.
Adam Shaw,
Market Development and Strategy Manager
AdvanSix Inc. USA,
An American Leader in Chemicalswww.advansix.com
The Knowledge Store from MarketsandMarkets is a valuable tool which has helped my team acquire greater insight in to the end markets that our business serves. This has enabled us to help our company build stronger strategies throughout our planning process.
TOSHIO KINOSHITA
Senior Chif Consultion Research & Consulting Division
Mitsubishi Chemical Research Corporation,
Leading Manufacturer of Chemical Productswww.mitsubishichem-res.co.jp/en/

We recently engaged with MarketsandMarkets for a study, the team not only clearly understood our business objectives but was also extremely professional in the way they handled the entire project. The study was efficiently conducted in a phase-wise manner, and the engagement model furnished us with high-quality business insights that far exceeded our expectations at each phase. We were especially happy that MarketsandMarkets could provide us with both, an English as well as a Japanese version of the study. A special thanks to the Analyst Team and Client Services Team, whose fluency in Japanese enhanced our comfort level, as we could converse with them in our preferred language.
Independent entrepreneurs
Arrow Precision
We approached MarketsandMarkets for study on Proppants Market, and their work exceeded our expectations. The study conducted was comprehensive and enabled us to view the market through the various dimensions. In addition, the team was extraordinarily responsive throughout the process and resolved our queries on time. I strongly recommend MarketsandMarkets and will certainly consider them for additional market assessments we will need in the future.
Global engineering company, Japan
Deputy Manager,
Strategic Planning OfficeThe high-quality insights shared by the MarketsandMarkets team helped us understand the pharmaceutical plant designers in a specific geography. It also captured the risks that we may likely face in communicating with our potential partners. The study would enable us identify partners, which would impact our future growth.


Growth opportunities and latent adjacency in Pipe Insulation Market