The study involved four major activities in estimating the current size of the insulation products market—extensive secondary research collected information on the market, peer, and parent markets. The next step was to validate these findings, assumptions, and measures with industry experts across the value chain of insulation products through primary research. Both top-down and bottom-up approaches were employed to estimate the total market size. After that, market breakdown and data triangulation were used to estimate the size of the segments and sub-segments of the market.
Secondary Research
The research methodology used to estimate and forecast the access control market begins with capturing data on the revenues of key vendors in the market through secondary research. In the secondary research process, various secondary sources, such as Hoovers, Bloomberg BusinessWeek, Factiva, World Bank, and Industry Journals, were referred to to identify and collect information for this study. These secondary sources included annual reports, press releases, investor presentations of companies, white papers, certified publications, articles by recognized authors, notifications by regulatory bodies, trade directories, and databases. Vendor offerings have also been taken into consideration to determine market segmentation.
Primary Research
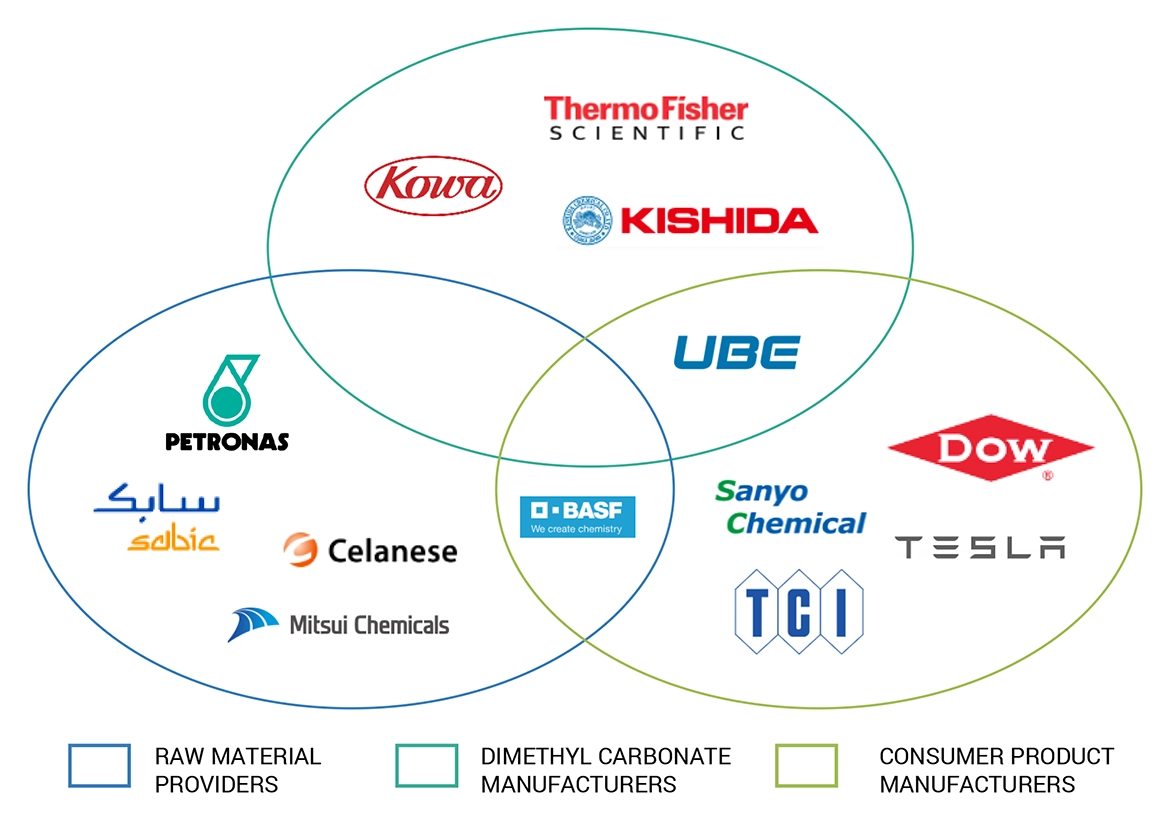
The insulation products market comprises several stakeholders in the supply chain, such as manufacturers, end-users, traders, associations, and regulatory organizations. The development of various end-use industries characterizes the demand side of this market. Various primary sources from the supply and demand sides of the market were interviewed to obtain qualitative and quantitative information. Following is the breakdown of the primary respondents:

Note: “Others” includes sales, marketing, and product managers
To know about the assumptions considered for the study, download the pdf brochure
Market Size Estimation
The top-down and bottom-up approaches were used to estimate and validate the total size of the insulation products market. These methods were also used extensively to determine the market size of various segments. The research methodology used to estimate the market size included the following:
-
The key players were identified through extensive primary and secondary research.
-
The value chain and market size of the insulation market, in terms of value, were determined through primary and secondary research.
-
All percentage shares, splits, and breakdowns were determined using secondary sources and verified through primary sources.
-
All possible parameters that affect the market covered in this research study were accounted for, viewed in extensive detail, verified through primary research, and analyzed to obtain the final quantitative and qualitative data.
-
The research included the study of reports, reviews, and newsletters of top market players, along with extensive interviews for opinions from key leaders, such as CEOs, directors, and marketing executives.
Global Insulation products Market Size: Bottom-Up Approach

To know about the assumptions considered for the study, Request for Free Sample Report
Global Insulation products Market Size: Top-Down Approach

Data Triangulation
After arriving at the overall market size using the market size estimation processes as explained above, the market was split into several segments and sub-segments. Data triangulation and market breakdown procedures were employed to complete the overall market engineering process and determine each market segment’s and subsegment’s exact statistics. The market size was calculated globally by summing up the country-level and regional-level data.
Market Definition
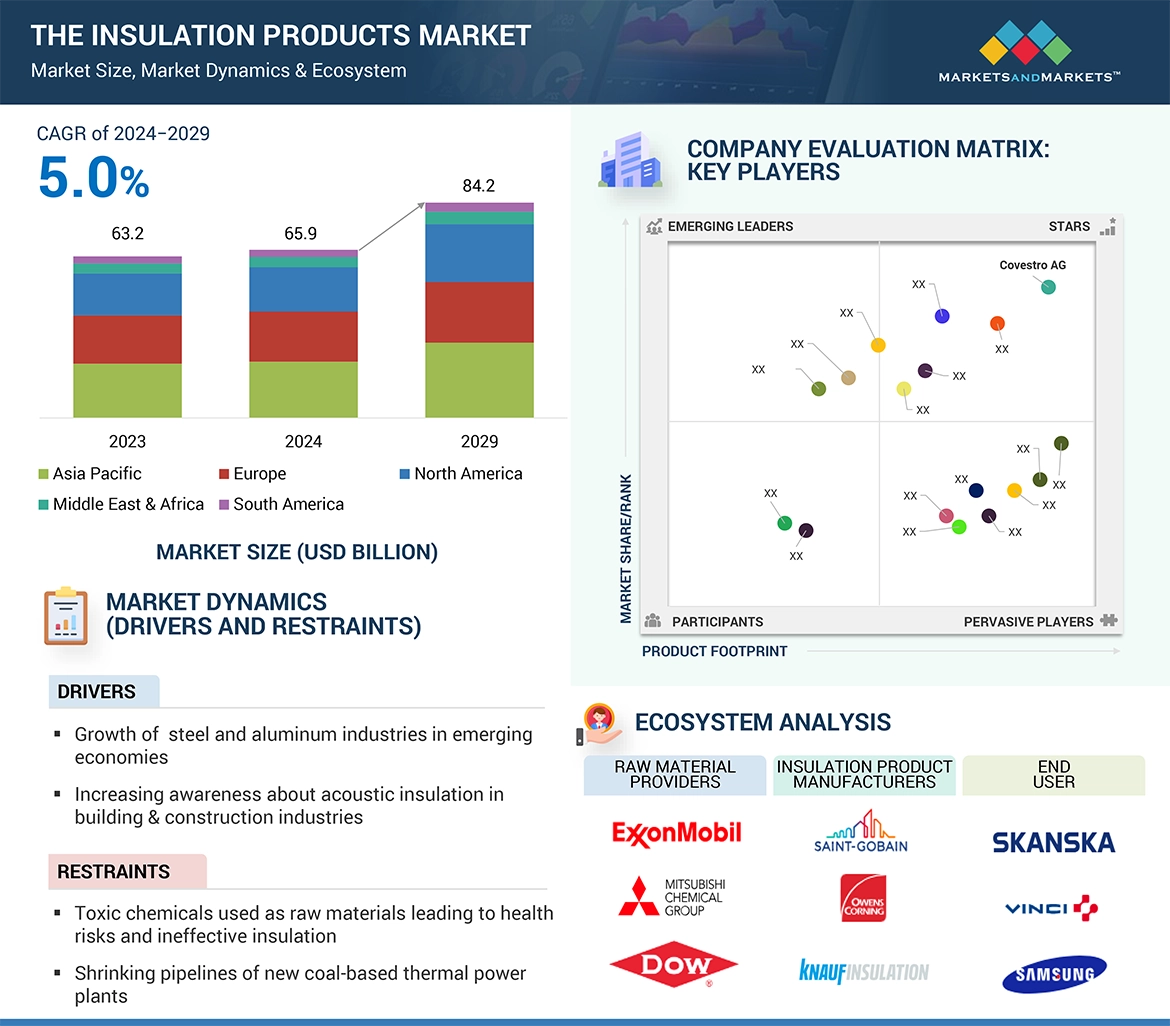
The market definition of insulation products refers to The market for insulation products encompasses a wide range of materials and solutions designed to enhance the thermal, acoustic, and moisture control performance of buildings and industrial facilities. These products include but are not limited to fiberglass, mineral wool, foam plastics (such as expanded polystyrene, extruded polystyrene, and polyurethane), cellulose, aerogels, and reflective insulation materials. Insulation products are utilized across various segments of the construction industry, including residential, commercial, and industrial applications, as well as in HVAC (Heating, Ventilation, and Air Conditioning) systems and refrigeration equipment. The market is driven by factors such as energy efficiency regulations, environmental concerns, technological advancements, and the need for improved comfort and indoor air quality. As construction activity continues to rise globally, coupled with growing awareness of energy conservation and sustainability, the demand for insulation products is expected to remain robust, driving market expansion and innovation.
Key Stakeholder
-
Manufacturers of insulation products
-
Traders, distributors, and suppliers of insulation products
-
Government and research organizations
-
Associations and industrial bodies
-
Research and consulting firms
-
R&D institutions
-
Environment support agencies
-
Investment banks and private equity firms
Report Objectives:
-
To define, describe, and forecast the size of the global insulation market in terms of value
-
To provide detailed information regarding the key factors, such as drivers, restraints, opportunities, and industry-specific challenges, influencing the growth of the insulation products market.
-
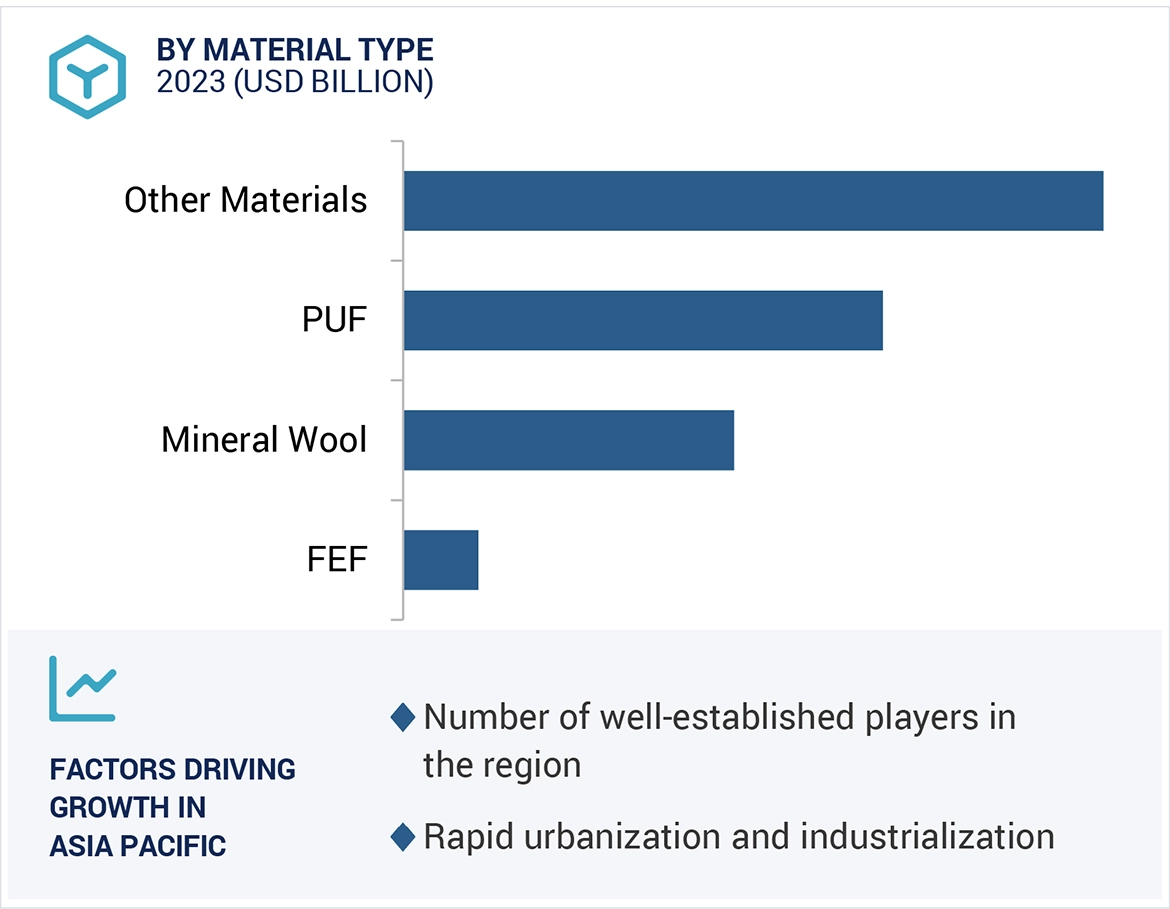
To analyze and forecast the size of various segments (material type, insulation type and end-use industry) of the insulation products market based on five major regions—North America, Europe, Asia Pacific, South America, Middle East & Africa—along with key countries
-
To analyze recent developments and competitive strategies, such as expansions, new product developments, partnerships, and acquisitions, product launches to draw the competitive landscape of the market
-
To strategically profile the key players in the market and comprehensively analyze their core competencies
Available Customizations:
With the given market data, MarketsandMarkets offers customizations according to client-specific needs. The following customization options are available for the report:
Additional country-level analysis of the insulation products market
Profiling of additional market players (up to 5)
Product matrix, which gives a detailed comparison of the product portfolio of each company.


Growth opportunities and latent adjacency in Insulation Products Market