Polyolefin Powders Market by Chemistry (Polyethylene, Polypropylene, and EVA), Application (Rotomolding, Masterbatch), End-Use Industry (Tanks & Containers, Transportation, Coatings, Cosmetics, Battery, Construction), and Region - Global Forecast to 2022


[146 Pages Report] polyolefin powders market was valued at USD 6.46 Billion in 2016 and is projected to reach USD 8.48 Billion by 2022, at a CAGR of 4.62% between 2017 and 2022. The report segments the polyolefin powders market on the basis of chemistry into polyethylene, polypropylene and EVA; on the basis of end-use industry into toys, tanks & containers, automotive & transportation, paints & coatings, cosmetics, batteries, building & construction, and others; on the basis of application into rotomolding, masterbatch, and others, and region into North America, Europe, APAC, the Middle East & Africa, and South America. Base year considered for the study is 2016, while the forecast period is between 2017 and 2022. The rise in demand for polyolefin powders in various end-use industries, such as toys, tanks & containers, automotive & transportation, and paints & coatings is driving the polyolefin powders market.
Top-down and bottom-up approaches have been used to estimate and validate the size of the global market and various other dependent submarkets in the overall polyolefin powders market. The research study involves the use of extensive secondary sources, directories, and databases such as Hoovers, Bloomberg, Chemical Weekly, Factiva, Chemical Fabrics & Film Association (CFFA), The Association of Rotational Molders (ARM), European Chemical Agency (ECA), European Automobile Manufacturers Association (ACEA), Independent Cosmetics Manufacturers And Distributors (ICMAD) and other government and private websites to identify and collect information useful for the technical, market-oriented, and commercial study of the polyolefin powders market.
To know about the assumptions considered for the study, download the pdf brochure
Polyolefin powders are manufactured by grinding raw polyolefin pellets under cryogenic conditions in the presence of grinding aids. Major players in the market are LyondellBasell (Netherlands), Ineos (Switzerland), Borealis (Austria), Mitsui Chemical (Japan), SABIC (Saudi Arabia), Exxon Mobil (US), and others.
Key Target Audience:
- Polyolefin Powders Manufacturers
- Raw Material Suppliers
- Traders, Distributors, and Suppliers of Polyolefin Powders
- Regional Manufacturer Associations and General Polyolefin Powders Associations
- Government & Regional Agencies and Research Organizations
- Investment Research Firms
Scope of the Report:
This research report categorizes the polyolefin powders market on the basis of chemistry, application, end-use industry, and region.
On the Basis of Chemistry:
- Polyethylene
- Polypropylene
- EVA
On the Basis of Application:
- Rotomolding
- Masterbatch
- Others
On the Basis of End-use Industry:
- Toys, tanks & containers
- Automotive & transportation
- Paints & coatings
- Cosmetics
- Battery
- Building & construction
- Others
On the Basis of Region:
- North America
- Europe
- APAC
- Middle East & Africa
- South America
The market is further analyzed for key countries in each of these regions.
Available Customizations:
Along with the market data, MarketsandMarkets offers customizations according to the company�s specific needs. The following customization options are available for the report:
Regional Analysis:
- Country-level analysis of varied end-use industries of polyolefin powders
Company Information:
- Detailed analysis and profiling of additional market players
The polyolefin powders market is estimated to be USD 6.76 Billion in 2017 and is projected to reach USD 8.48 Billion by 2022, at a CAGR of 4.62% during the forecast period. It is driven by its use in different end-use industries, namely, toys, tanks & containers, automotive & transportation, paints & coatings, cosmetics, batteries, building & construction, and others. The high demand for polyolefin powders from the rotomolding application of toys, tanks & containers end-use industry, and SMC, BMC, and carpet applications of the automotive end-use industry is also driving the polyolefin powders market.
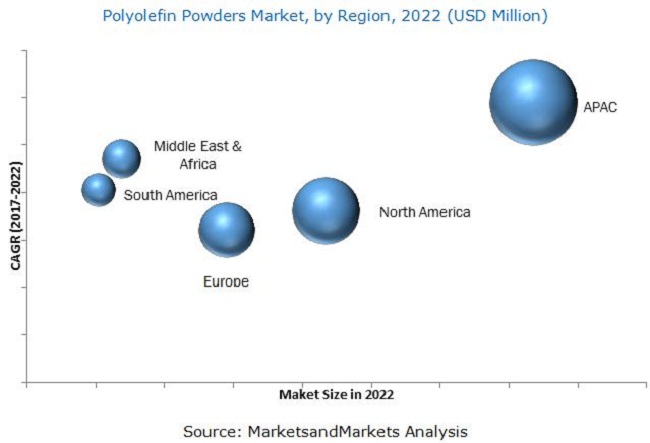
The demand for polyolefin powders in the rotomolding application and automotive & transportation, and paints & coatings end-use industries is high, especially in China, India, and Brazil. Emerging technologies and innovations drive the demand for polyolefin powder in these industries. APAC is estimated to witness strong growth over the next 5 years.
Different grades of polyolefin powders are used in the industries based on their requirements. They have distinct properties, which vary according to application requirements. These are classified based on their chemistry, namely, polyethylene, polypropylene, and EVA. Polyolefin powders is a thermoplastic powder, and this market is based on its demand from various applications such as rotomolding and masterbatch. There is a huge demand for polyethylene powder in the rotomolding application. The growing demand for polyolefin powders from the rotomolding application in end-use industries such as toys, tanks & containers, and automotive & transportation, and masterbatch applications for industries such as paints & coatings, cosmetics, and battery is expected to drive the market. However, government regulations and economic slowdown are affecting market growth.
Products based on plastics microbeads such as PE and PP are banned in most countries of Europe and North America due to their effects on the environment and marine food cycle. Thus, this factor is restraining the growth of polyolefin powder market in these regions.
Key players operating in the polyolefin powders market include LyondellBasell (Netherlands), Ineos (Switzerland), Borealis (Austria), Mitsui Chemical (Japan), SABIC (Saudi Arabia), Exxon Mobil (US), Eastman (US), Merck (Germany), Wacker Chemie (Germany), Axalta Coating Systems (US), and others. Diverse product portfolio, strategically positioned R&D centers, continuous adoption of development strategies, and technological advancements are factors strengthening the market position of these companies. These companies have adopted various organic and inorganic growth strategies to enhance their current market share of the polyolefin powders market.
To speak to our analyst for a discussion on the above findings, click Speak to Analyst
 Exclusive indicates content/data unique to MarketsandMarkets and not available with any competitors.
Table of Contents
1 Introduction (Page No. - 16)
1.1 Objectives of the Study
1.2 Market Definition
1.3 Market Scope
1.3.1 Years Considered for the Study
1.4 Currency
1.5 Units Considered
1.6 Stakeholders
2 Research Methodology (Page No. - 19)
2.1 Research Data
2.2 Secondary Data
2.2.1 Key Data From Secondary Sources
2.3 Primary Data
2.3.1 Key Data From Primary Sources
2.3.2 Key Industry Insights
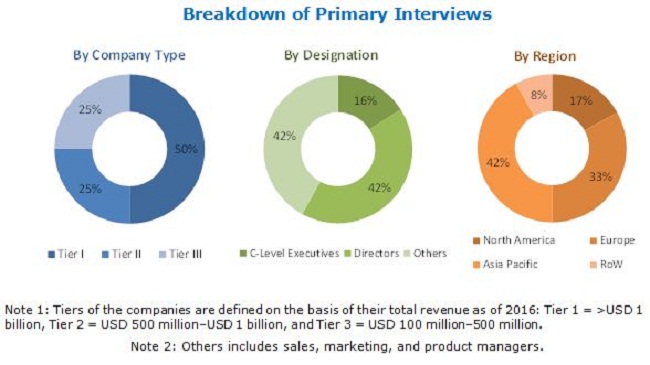
2.3.3 Breakdown of Primary Interviews
2.4 Market Size Estimation
2.4.1 Bottom-Up Approach
2.4.2 Top-Down Approach
2.5 Data Triangulation
2.6 Assumptions
2.7 Limitations
3 Executive Summary (Page No. - 28)
4 Premium Insights (Page No. - 31)
4.1 Significant Opportunities in the Polyolefin Powders Market
4.2 Polyolefin Powders Market, By End-Use Industry
4.3 Polyolefin Powders Market, By End-Use Industry and Country (2016)
4.4 Polyolefin Powders Market: Developed vs Developing Countries
4.5 Polyolefin Powders Market, By C0untry
5 Market Overview (Page No. - 35)
5.1 Introduction
5.2 Market Dynamics
5.2.1 Drivers
5.2.1.1 High Growth of End-Use Industries
5.2.1.2 High Demand for Polyolefin Powders in APAC
5.2.2 Restraints
5.2.2.1 Concerns Regarding the Environmental Impact of Small Plastic Beads
5.2.3 Opportunities
5.2.3.1 Growing Demand for 3D Printing
5.2.4 Challenges
5.2.4.1 Stringent Regulations
5.3 Porter�s Five Forces Analysis
5.3.1 Threat of New Entrants
5.3.2 Threat of Substitutes
5.3.3 Bargaining Power of Suppliers
5.3.4 Bargaining Power of Buyers
5.3.5 Intensity of Competitive Rivalry
5.4 Macroeconomic Overview and Key Trends
5.4.1 Introduction
5.4.2 Trends and Forecast of GDP
5.4.3 Trends and Forecast of Construction Industry
5.4.4 Trends and Forecast of Automotive Industry
6 Polyolefin Powders Market, By Chemistry (Page No. - 43)
6.1 Introduction
6.2 Polyethylene Powder
6.2.1 Linear Low Density Polyethylene (LLDPE) Powder
6.2.2 Low Density Polyethylene (LDPE) Powder
6.2.3 High Density Polyethylene (HDPE) Powder
6.3 Polypropylene Powder
6.4 EVA Powder
7 Polyolefin Powders Market, By Application (Page No. - 48)
7.1 Introduction
7.2 Rotomolding
7.3 Masterbatch
7.4 Others
8 Polyolefin Powders Market, By End-Use Industry (Page No. - 49)
8.1 Introduction
8.2 Toys, Tanks & Containers
8.3 Automotive & Transportation
8.4 Paints & Coatings
8.5 Cosmetics
8.6 Battery
8.7 Building & Construction
8.8 Others
8.8.1 Industrial Soaps & Cleaners
8.8.2 Rubber & Carpet
8.8.3 Hot Melt Adhesives (HMA) & Pressure Sensitive Adhesives (PSA)
8.8.4 Printer & Flexo and Gravure Ink
8.8.5 Grease
9 Polyolefin Powders Market, By Region (Page No. - 60)
9.1 Introduction
9.2 North America
9.2.1 US
9.2.2 Canada
9.2.3 Mexico
9.3 Europe
9.3.1 Germany
9.3.2 France
9.3.3 Italy
9.3.4 UK
9.3.5 Spain
9.3.6 Poland
9.3.7 Scandinavia
9.3.8 Rest of Europe
9.4 APAC
9.4.1 China
9.4.2 India
9.4.3 Japan
9.4.4 South Korea
9.4.5 Malaysia
9.4.6 Thailand
9.4.7 Australia & New Zealand
9.4.8 Rest of APAC
9.5 Middle East & Africa
9.5.1 South Africa
9.5.2 Iran
9.5.3 Saudi Arabia
9.5.4 Rest of the Middle East & Africa
9.6 South America
9.6.1 Brazil
9.6.2 Argentina
9.6.3 Colombia
9.6.4 Rest of South America
10 Competitive Landscape (Page No. - 109)
10.1 Overview
10.2 Major Player Ranking
10.3 Investment & Expansion
10.4 Merger & Acquisition
10.5 Joint Venture, Partnership, Contract & Agreement
10.6 New Product Launch
11 Company Profiles (Page No. - 113)
11.1 Lyondellbasell
11.1.1 Business Overview
11.1.2 Products Offered
11.1.3 Recent Developments
11.1.4 SWOT Analysis
11.1.5 MnM View
11.2 Exxon Mobil
11.2.1 Business Overview
11.2.2 Products Offered
11.2.3 Recent Developments
11.2.4 SWOT Analysis
11.2.5 MnM View
11.3 Ineos Group Holdings S.A.
11.3.1 Business Overview
11.3.2 Products Offered
11.3.3 Recent Developments
11.3.4 SWOT Analysis
11.3.5 MnM View
11.4 Merck KGaA
11.4.1 Business Overview
11.4.2 Products Offered
11.4.3 Recent Developments
11.4.4 SWOT Analysis
11.4.5 MnM View
11.5 Borealis AG
11.5.1 Business Overview
11.5.2 Products Offered
11.5.3 Recent Developments
11.5.4 SWOT Analysis
11.5.5 MnM View
11.6 SABIC
11.6.1 Business Overview
11.6.2 Products Offered
11.6.3 Recent Developments
11.7 Eastman Chemical
11.7.1 Business Overview
11.7.2 Products Offered
11.7.3 Recent Developments
11.8 Axalta Coating Systems
11.8.1 Business Overview
11.8.2 Products Offered
11.8.3 Recent Developments
11.9 Wacker Chemie
11.9.1 Business Overview
11.9.2 Products Offered
11.9.3 Recent Developments
11.10 Mitsui Chemicals
11.10.1 Business Overview
11.10.2 Products Offered
11.10.3 Recent Developments
11.11 Additional Companies
11.11.1 Micro Powders
11.11.2 Rapid Coat
11.11.3 RoWak
11.11.4 Moretex Chemical
11.11.5 Schaetti
11.11.6 Abifor
11.11.7 Asahi Kasei
11.11.8 Dairen Chemical
11.11.9 Sumitomo Seika
11.11.10 Goonvean Fibres
12 Appendix (Page No. - 139)
12.1 Key Insights From Industry Experts
12.2 Discussion Guide
12.3 Knowledge Store: Marketsandmarkets� Subscription Portal
12.4 Introducing RT: Real-Time Market Intelligence
12.5 Available Customizations
12.6 Related Reports
12.7 Author Details
List of Tables (124 Tables)
Table 1 Polyolefin Powders Market Snapshot (2017 vs 2022)
Table 2 Trends and Forecast of GDP: Annual Percentage Change
Table 3 Contribution of Construction Industry to GDP of North America, By Country, 2014�2021 (USD Billion)
Table 4 Contribution of Construction Industry to GDP of Europe, By Country, 2014�2021 (USD Billion)
Table 5 Contribution of Construction Industry to GDP of APAC, By Country, 2014�2021 (USD Billion)
Table 6 Contribution of Construction Industry to GDP of Middle East & Africa, By Country, 2014�2021 (USD Billion)
Table 7 Contribution of Construction Industry to GDP of South America, By Country, 2014�2021 (USD Billion)
Table 8 Automotive Production, 2012�2016 (Million Unit)
Table 9 Polyolefin Powders Market Size, By Chemistry, 2015�2022 (USD Million)
Table 10 Polyolefin Powders Market Size, By Chemistry, 2015�2022 (Kiloton)
Table 11 PE Powders Market Size, By Region, 2015�2022 (USD Million)
Table 12 PE Powders Market Size, By Region, 2015�2022 (Kiloton)
Table 13 PP Powders Market Size, By Region, 2015�2022 (USD Million)
Table 14 PP Powders Market Size, By Region, 2015�2022 (Kiloton)
Table 15 EVA Powders Market Size, By Region, 2015�2022 (USD Million)
Table 16 EVA Powders Market Size, By Region, 2015�2022 (Kiloton)
Table 17 Polyolefin Powders Market Size, By End-Use Industry, 2015�2022 (USD Million)
Table 18 Polyolefin Powders Market Size, By End-Use Industry, 2015�2022 (Kiloton)
Table 19 Polyolefin Powders Market Size in Toys, Tanks & Containers End-Use Industry, By Region, 2015�2022 (USD Million)
Table 20 Polyolefin Powders Market Size in Toys, Tanks & Containers End-Use Industry, By Region, 2015�2022 (Kiloton)
Table 21 Polyolefin Powders Market Size in Automotive & Transportation End-Use Industry, By Region, 2015�2022 (USD Million)
Table 22 Polyolefin Powders Market Size in Automotive & Transportation End-Use Industry, By Region, 2015�2022 (Kiloton)
Table 23 Role & Functions of Polyolefin Powders in the Paints & Coatings Industry
Table 24 Polyolefin Powders Market Size in Paints & Coatings End-Use Industry, By Region, 2015�2022 (USD Million)
Table 25 Polyolefin Powders Market Size in Paints & Coatings End-Use Industry, By Region, 2015�2022 (Kiloton)
Table 26 Polyolefin Powders Market Size in Cosmetics End-Use Industry, By Region, 2015�2022 (USD Million)
Table 27 Polyolefin Powders Market Size in Cosmetics End-Use Industry, By Region, 2015�2022 (Kiloton)
Table 28 Polyolefin Powders Market Size in Battery End-Use Industry, By Region, 2015�2022 (USD Million)
Table 29 Polyolefin Powders Market Size in Battery End-Use Industry, By Region, 2015�2022 (Kiloton)
Table 30 Polyolefin Powders Market Size in Building & Construction End-Use Industry, By Region, 2015�2022 (USD Million)
Table 31 Polyolefin Powders Market Size in Building & Construction End-Use Industry, By Region, 2015�2022 (Kiloton)
Table 32 Polyolefin Powders Market Size in Other End-Use Industries, By Region, 2015�2022 (USD Million)
Table 33 Polyolefin Powders Market Size in Other End-Use Industries, By Region, 2015�2022 (Kiloton)
Table 34 Polyolefin Powders Market Size, By Region, 2015�2022 (USD Million)
Table 35 Polyolefin Powders Market Size, By Region, 2015�2022 (Kiloton)
Table 36 North America: Polyolefin Powders Market Size, By Country, 2015�2022 (USD Million)
Table 37 North America: Polyolefin Powders Market Size, By Country, 2015�2022 (Kiloton)
Table 38 North America: Polyolefin Powders Market Size, By Chemistry, 2015�2022 (USD Million)
Table 39 North America: Polyolefin Powders Market Size, By Chemistry, 2015�2022 (Kiloton)
Table 40 North America: Polyolefin Powders Market Size, By End-Use Industry, 2015�2022 (USD Million)
Table 41 North America: Polyolefin Powders Market Size, By End-Use Industry, 2015�2022 (Kiloton)
Table 42 US: Polyolefin Powders Market Size, By End-Use Industry, 2015�2022 (USD Million)
Table 43 US: Polyolefin Powders Market Size, By End-Use Industry, 2015�2022 (Kiloton)
Table 44 Canada: Polyolefin Powders Market Size, By End-Use Industry, 2015�2022 (USD Million)
Table 45 Canada: Polyolefin Powders Market Size, By End-Use Industry, 2015�2022 (Kiloton)
Table 46 Mexico: Polyolefin Powders Market Size, By End-Use Industry, 2015�2022 (USD Million)
Table 47 Mexico: Polyolefin Powders Market Size, By End-Use Industry, 2015�2022 (Kiloton)
Table 48 Europe: Polyolefin Powders Market Size, By Country, 2015�2022 (USD Million)
Table 49 Europe: Polyolefin Powders Market Size, By Country, 2015�2022 (Kiloton)
Table 50 Europe: Polyolefin Powders Market Size, By Chemistry, 2015�2022 (USD Million)
Table 51 Europe: Polyolefin Powders Market Size, By Chemistry, 2015�2022 (Kiloton)
Table 52 Europe: Polyolefin Powders Market Size, By End-Use Industry, 2015�2022 (USD Million)
Table 53 Europe: Polyolefin Powders Market Size, By End-Use Industry, 2015�2022 (Kiloton)
Table 54 Germany: Polyolefin Powders Market Size, By End-Use Industry, 2015�2022 (USD Million)
Table 55 Germany: Polyolefin Powders Market Size, By End-Use Industry, 2015�2022 (Kiloton)
Table 56 France: Polyolefin Powders Market Size, By End-Use Industry, 2015�2022 (USD Million)
Table 57 France: Polyolefin Powders Market Size, By End-Use Industry, 2015�2022 (Kiloton)
Table 58 Italy: Polyolefin Powders Market Size, By End-Use Industry, 2015�2022 (USD Million)
Table 59 Italy: Polyolefin Powders Market Size, By End-Use Industry, 2015�2022 (Kiloton)
Table 60 UK: Polyolefin Powders Market Size, By End-Use Industry, 2015�2022 (USD Million)
Table 61 UK: Polyolefin Powders Market Size, By End-Use Industry, 2015�2022 (Kiloton)
Table 62 Spain: Polyolefin Powders Market Size, By End-Use Industry, 2015�2022 (USD Million)
Table 63 Spain: Polyolefin Powders Market Size, By End-Use Industry, 2015�2022 (Kiloton)
Table 64 Poland: Polyolefin Powders Market Size, By End-Use Industry, 2015�2022 (USD Million)
Table 65 Poland: Polyolefin Powders Market Size, By End-Use Industry, 2015�2022 (Kiloton)
Table 66 Scandinavia: Polyolefin Powders Market Size, By End-Use Industry, 2015�2022 (USD Million)
Table 67 Scandinavia: Polyolefin Powders Market Size, By End-Use Industry, 2015�2022 (Kiloton)
Table 68 Rest of Europe: Polyolefin Powders Market Size, By End-Use Industry, 2015�2022 (USD Million)
Table 69 Rest of Europe: Polyolefin Powders Market Size, By End-Use Industry, 2015�2022 (Kiloton)
Table 70 APAC: Polyolefin Powders Market Size, By Country, 2015�2022 (USD Million)
Table 71 APAC: Polyolefin Powders Market Size, By Country, 2015�2022 (Kiloton)
Table 72 APAC: Polyolefin Powders Market Size, By Chemistry, 2015�2022 (USD Million)
Table 73 APAC: Polyolefin Powders Market Size, By Chemistry, 2015�2022 (Kiloton)
Table 74 APAC: Polyolefin Powders Market Size, By End-Use Industry, 2015�2022 (USD Million)
Table 75 APAC: Polyolefin Powders Market Size, By End-Use Industry, 2015�2022 (Kiloton)
Table 76 China: Polyolefin Powders Market Size, By End-Use Industry, 2015�2022 (USD Million)
Table 77 China: Polyolefin Powders Market Size, By End-Use Industry, 2015�2022 (Kiloton)
Table 78 India: Polyolefin Powders Market Size, By End-Use Industry, 2015�2022 (USD Million)
Table 79 India: Polyolefin Powders Market Size, By End-Use Industry, 2015�2022 (Kiloton)
Table 80 Japan: Polyolefin Powders Market Size, By End-Use Industry, 2015�2022 (USD Million)
Table 81 Japan: Polyolefin Powders Market Size, By End-Use Industry, 2015�2022 (Kiloton)
Table 82 South Korea: Polyolefin Powders Market Size, By End-Use Industry, 2015�2022 (USD Million)
Table 83 South Korea: Polyolefin Powders Market Size, By End-Use Industry, 2015�2022 (Kiloton)
Table 84 Malaysia: Polyolefin Powders Market Size, By End-Use Industry, 2015�2022 (USD Million)
Table 85 Malaysia: Polyolefin Powders Market Size, By End-Use Industry, 2015�2022 (Kiloton)
Table 86 Thailand: Polyolefin Powders Market Size, By End-Use Industry, 2015�2022 (USD Million)
Table 87 Thailand: Polyolefin Powders Market Size, By End-Use Industry, 2015�2022 (Kiloton)
Table 88 Australia & New Zealand: Polyolefin Powders Market Size, By End-Use Industry, 2015�2022 (USD Million)
Table 89 Australia & New Zealand: Polyolefin Powders Market Size, By End-Use Industry, 2015�2022 (Kiloton)
Table 90 Rest of APAC: Polyolefin Powders Market Size, By End-Use Industry, 2015�2022 (USD Million)
Table 91 Rest of APAC: Polyolefin Powders Market Size, By End-Use Industry, 2015�2022 (Kiloton)
Table 92 Middle East & Africa: Polyolefin Powders Market Size, By Country, 2015�2022 (USD Million)
Table 93 Middle East & Africa: Polyolefin Powders Market Size, By Country, 2015�2022 (Kiloton)
Table 94 Middle East & Africa: Polyolefin Powders Market Size, By Chemistry, 2015�2022 (USD Million)
Table 95 Middle East & Africa: Polyolefin Powders Market Size, By Chemistry, 2015�2022 (Kiloton)
Table 96 Middle East & Africa: Polyolefin Powders Market Size, By End-Use Industry, 2015�2022 (USD Million)
Table 97 Middle East & Africa: Polyolefin Powders Market Size, By End-Use Industry, 2015�2022 (Kiloton)
Table 98 South Africa: Polyolefin Powders Market Size, By End-Use Industry, 2015�2022 (USD Million)
Table 99 South Africa: Polyolefin Powders Market Size, By End-Use Industry, 2015�2022 (Kiloton)
Table 100 Iran: Polyolefin Powders Market Size, By End-Use Industry, 2015�2022 (USD Million)
Table 101 Iran: Polyolefin Powders Market Size, By End-Use Industry, 2015�2022 (Kiloton)
Table 102 Saudi Arabia: Polyolefin Powders Market Size, By End-Use Industry, 2015�2022 (USD Million)
Table 103 Saudi Arabia: Polyolefin Powders Market Size, By End-Use Industry, 2015�2022 (Kiloton)
Table 104 Rest of the Middle East & Africa: Polyolefin Powders Market Size, By End-Use Industry, 2015�2022 (USD Million)
Table 105 Rest of the Middle East & Africa: Polyolefin Powders Market Size, By End-Use Industry, 2015�2022 (Kiloton)
Table 106 South America: Polyolefin Powders Market Size, By Country, 2015�2022 (USD Million)
Table 107 South America: Polyolefin Powders Market Size, By Country, 2015�2022 (Kiloton)
Table 108 South America: Polyolefin Powders Market Size, By Chemistry, 2015�2022 (USD Million)
Table 109 South America: Polyolefin Powders Market Size, By Chemistry, 2015�2022 (Kiloton)
Table 110 South America: Polyolefin Powders Market Size, By End-Use Industry, 2015�2022 (USD Million)
Table 111 South America: Polyolefin Powders Market Size, By End-Use Industry, 2015�2022 (Kiloton)
Table 112 Brazil: Polyolefin Powders Market Size, By End-Use Industry, 2015�2022 (USD Million)
Table 113 Brazil: Polyolefin Powders Market Size, By End-Use Industry, 2015�2022 (Kiloton)
Table 114 Argentina: Polyolefin Powders Market Size, By End-Use Industry, 2015�2022 (USD Million)
Table 115 Argentina: Polyolefin Powders Market Size, By End-Use Industry, 2015�2022 (Kiloton)
Table 116 Colombia: Polyolefin Powders Market Size, By End-Use Industry, 2015�2022 (USD Million)
Table 117 Colombia: Polyolefin Powders Market Size, By End-Use Industry, 2015�2022 (Kiloton)
Table 118 Rest of South America: Polyolefin Powders Market Size, By End-Use Industry, 2015�2022 (USD Million)
Table 119 Rest of South America: Polyolefin Powders Market Size, By End-Use Industry, 2015�2022 (Kiloton)
Table 120 Market Ranking Analysis (2016)
Table 121 Investment & Expansion, 2015�2018
Table 122 Merger & Acquisition, 2015�2018
Table 123 Joint Venture, Partnership, Contract, & Agreement, 2015�2018
Table 124 New Product Launch, 2015�2018
List of Figures (41 Figures)
Figure 1 Polyolefin Powders: Market Segmentation
Figure 2 Polyolefin Powders Market: Research Design
Figure 3 Market Size Estimation: Bottom-Up Approach
Figure 4 Market Size Estimation: Top-Down Approach
Figure 5 Polyolefin Powders Market: Data Triangulation
Figure 6 APAC to Lead the Polyolefin Powders Market
Figure 7 Toys, Tanks & Containers End-Use Industry to Dominate Polyolefin Powders Market
Figure 8 APAC to Be the Largest and Fastest-Growing Polyolefin Powders Market Between 2017 and 2022
Figure 9 Emerging Economies to Offer Lucrative Growth Opportunities to Market Players
Figure 10 Toys, Tanks & Containers to Be the Largest Segment Between 2017 and 2022
Figure 11 China Accounted for the Largest Market Share in 2016
Figure 12 Polyolefin Powders Market to Witness Higher Growth in Developing Countries
Figure 13 India to Register the Highest CAGR in APAC During the Forecast Period
Figure 14 China Dominated the Overall Market in 2016
Figure 15 Factors Governing the Polyolefin Powders Market
Figure 16 Polyethylene Powder to Dominate the Overall Polyolefin Powders Market Till 2022
Figure 17 Rotomolding to Be the Dominant Application of Polyolefin Powders
Figure 18 Toys, Tanks & Containers to Be the Dominant End-Use Industry in the Polyolefin Powders Market, 2017 vs 2022
Figure 19 Regional Snapshot: India and China Emerging as Strategic Locations for the Polyolefin Powders Market
Figure 20 APAC to Be the Fastest-Growing Polyolefin Powders Market in Various End-Use Industries
Figure 21 North America Snapshot: Polyolefin Powders Market
Figure 22 US: Rise in Demand From Toy, Tanks & Containers to Drive the Polyolefin Powders Market
Figure 23 Europe: Toys, Tanks & Containers End-Use Industry to Dominate the Polyolefin Powders Market
Figure 24 Italy to Dominate the Polyolefin Powders Market in Europe During the Forecast Period
Figure 25 APAC Snapshot: Polyolefin Powders Market
Figure 26 Companies Adopted Investment & Expansion as the Key Growth Strategy Between 2015 and 2018
Figure 27 Lyondellbasell: Company Snapshot
Figure 28 Lyondellbasell: SWOT Analysis
Figure 29 Exxon Mobil: Company Snapshot
Figure 30 Exxon Mobil: SWOT Analysis
Figure 31 Ineos Group Holdings S.A.: Company Snapshot
Figure 32 Ineos: SWOT Analysis
Figure 33 Merck KGaA: Company Snapshot
Figure 34 Merck KGaA: SWOT Analysis
Figure 35 Borealis AG: Company Snapshot
Figure 36 Borealis AG: SWOT Analysis
Figure 37 SABIC: Company Snapshot
Figure 38 Eastman Chemical: Company Snapshot
Figure 39 Axalta Coating Systems: Company Snapshot
Figure 40 Wacker Chemie: Company Snapshot
Figure 41 Mitsui Chemicals: Company Snapshot


Growth opportunities and latent adjacency in Polyolefin Powders Market