RF Semiconductor Market by Device (Filter, Power Amplifier, Switch, Low Noise Amplifier), Frequency Band, Material (GaAs, GaN, Si) Application (Consumer Devices, Automotive, Telecommunication, Aerospace & Defense), and Region - Global Forecast to 2036


RF Semiconductor Market Summary
The RF Semiconductor Market was valued at approximately USD 28 billion in 2025 and is projected to reach USD 78 billion by 2036, growing at a CAGR of 10% during the forecast period (2025–2036). The market is experiencing strong growth driven by the rapid expansion of wireless communication technologies and the increasing demand for high-frequency, high-performance electronic components. This growth is fueled by the proliferation of 5G networks, rising adoption of Internet of Things (IoT) devices, and increasing integration of artificial intelligence (AI) in communication systems. RF semiconductors play a critical role in enabling high-speed data transmission, low-latency communication, and efficient power management in modern devices. As industries accelerate digital transformation, the demand for RF components in smartphones, automotive systems, smart infrastructure, and industrial automation is significantly increasing, positioning the RF Semiconductor Market as a key enabler of next-generation connectivity.
Key Market Trends & Insights
The RF Semiconductor Market is evolving rapidly, influenced by technological advancements and increasing connectivity requirements. North America currently leads the market due to its advanced telecommunications infrastructure and early adoption of 5G technologies. Asia Pacific is the fastest-growing region, driven by large-scale electronics manufacturing and expanding mobile network deployments. The RF front-end module segment dominates the market, as it integrates multiple components required for signal transmission and reception. Emerging trends include the adoption of gallium nitride (GaN) and silicon carbide (SiC) technologies for improved efficiency and performance. AI-driven design and automation are enhancing semiconductor manufacturing processes, enabling higher precision and reduced time-to-market. Additionally, the convergence of RF semiconductors with IoT ecosystems is driving innovation in smart devices and connected systems.
Market Size & Forecast
-
Base Year Market Size (2025): USD 28 Billion
-
Forecast Value (2036): USD 78 Billion
-
CAGR (2025–2036): 10%
-
Growth is driven by 5G adoption, increasing demand for connected devices, and advancements in semiconductor technologies.
RF Semiconductor Market Top 10 key takeaway
-
The RF Semiconductor Market is projected to grow at a CAGR of 10% through 2036.
-
North America leads due to strong telecom infrastructure.
-
Asia Pacific is the fastest-growing region with high electronics production.
-
RF front-end modules dominate the product segment.
-
5G deployment is a major growth driver.
-
GaN and SiC technologies are gaining traction.
-
AI integration is optimizing semiconductor design and manufacturing.
-
IoT adoption is increasing demand for RF components.
-
Automotive and smart devices are key application areas.
-
Automation is improving efficiency in semiconductor fabrication.
Product Insights
The RF front-end module segment dominates the RF Semiconductor Market, as it integrates essential components such as power amplifiers, filters, switches, and duplexers into a single package. This integration enhances performance, reduces power consumption, and minimizes the size of electronic devices, making it highly suitable for smartphones and IoT devices. The increasing complexity of wireless communication systems, particularly with the rollout of 5G networks, has further strengthened the demand for RF front-end modules.
Power amplifiers and RF filters also hold significant market shares, as they are critical for signal amplification and frequency selection in communication systems. Emerging product categories include advanced antenna tuners and integrated RF solutions designed for multi-band and multi-mode operations. AI-driven design tools are enabling manufacturers to optimize component performance, reduce design cycles, and improve reliability. The growing trend toward system-on-chip (SoC) integration is also driving innovation in RF semiconductor products.
Technology / Component Insights
The RF Semiconductor Market is driven by advancements in materials and fabrication technologies, including gallium arsenide (GaAs), gallium nitride (GaN), and silicon carbide (SiC). GaN technology, in particular, is gaining popularity due to its ability to operate at higher frequencies and power levels with improved efficiency. These materials are essential for meeting the performance requirements of modern communication systems.
AI and machine learning are playing a transformative role in semiconductor manufacturing by enabling predictive maintenance, process optimization, and defect detection. IoT integration is increasing the demand for RF semiconductors, as connected devices require reliable and efficient communication capabilities. Cloud computing is supporting design and simulation processes, allowing for faster development and testing of RF components.
Automation is a key factor in improving manufacturing efficiency, reducing costs, and ensuring consistent quality. Future innovation trends include the development of advanced packaging technologies, such as 3D integration and heterogeneous integration, as well as the adoption of software-defined radio (SDR) and cognitive radio technologies.
Application Insights
The telecommunications sector is the leading application segment in the RF Semiconductor Market, driven by the deployment of 5G networks and the increasing demand for high-speed wireless communication. RF semiconductors are essential for enabling efficient signal transmission and reception in mobile networks, base stations, and communication devices.
Consumer electronics is another major application area, with smartphones, tablets, and wearable devices driving significant demand for RF components. The automotive sector is also witnessing growing adoption of RF semiconductors, particularly in applications such as advanced driver-assistance systems (ADAS), vehicle-to-everything (V2X) communication, and infotainment systems.
Industrial applications, including smart manufacturing and automation, are further expanding the scope of the RF Semiconductor Market. Future opportunities lie in the integration of RF technologies with emerging applications such as smart cities, autonomous vehicles, and next-generation IoT devices.
Regional Insights
North America leads the RF Semiconductor Market, supported by strong investments in telecommunications infrastructure, advanced semiconductor manufacturing capabilities, and early adoption of 5G technologies. The presence of major technology companies further strengthens the region’s market position.
Europe is experiencing steady growth, driven by increasing adoption of advanced communication technologies and investments in automotive and industrial applications. The region is focusing on innovation and sustainability, contributing to the growth of the RF Semiconductor Market.
Asia Pacific is the fastest-growing region, fueled by large-scale electronics manufacturing, expanding mobile networks, and increasing demand for consumer electronics. Countries such as China, Japan, and South Korea are major contributors to market growth, supported by strong government initiatives and investments in technology development.
-
North America leads due to advanced telecom infrastructure
-
Europe shows steady growth driven by industrial and automotive sectors
-
Asia Pacific is the fastest-growing region
-
Government initiatives are supporting semiconductor development
-
Rising demand for consumer electronics is driving growth
Country-Specific Market Trends
In Asia Pacific, China dominates the RF Semiconductor Market with a projected CAGR of 11.2%, driven by its strong electronics manufacturing base and investments in 5G infrastructure. Japan follows with a CAGR of 9.5%, focusing on advanced semiconductor technologies and innovation.
In North America, the United States leads the market due to its advanced technological ecosystem and significant investments in telecommunications and defense. Canada and Mexico are experiencing steady growth, with CAGRs ranging from 8.2% to 9.0%, supported by increasing adoption of wireless technologies.
In Europe, Germany and France are key contributors to market growth, with CAGRs of approximately 8.8% and 8.5%, respectively. These countries are focusing on integrating RF semiconductor technologies into automotive and industrial applications.
-
China leads APAC with strong manufacturing and 5G deployment
-
Japan focuses on advanced semiconductor innovation
-
United States dominates North America market
-
Canada and Mexico show steady growth trends
-
Germany and France lead Europe in RF adoption
Key RF Semiconductor Company Insights
The RF Semiconductor Market is highly competitive, with leading companies focusing on innovation, AI integration, and strategic collaborations to strengthen their market position. Key players are investing in advanced materials, next-generation technologies, and high-performance products to meet the evolving demands of the market.
Major companies include Qualcomm Incorporated, Broadcom Inc., Skyworks Solutions, Inc., Qorvo, Inc., NXP Semiconductors N.V., Infineon Technologies AG, Murata Manufacturing Co., Ltd., Analog Devices, Inc., STMicroelectronics N.V., and MediaTek Inc. These companies are leveraging AI and automation to enhance product performance, improve manufacturing efficiency, and expand their global presence.
-
Companies are investing in advanced RF technologies
-
AI-driven design and manufacturing are key focus areas
-
Strategic partnerships are driving innovation
-
Expansion into emerging markets is a major growth strategy
-
Integration of advanced materials is enhancing performance
Recent Developments
Recent developments in the RF Semiconductor Market highlight the focus on innovation and performance enhancement. In 2025, a leading semiconductor company launched a GaN-based RF power amplifier designed for 5G base stations, offering improved efficiency and higher power output. Another major player introduced an AI-driven design platform to accelerate RF component development and optimize performance. Additionally, a strategic partnership between a semiconductor manufacturer and a telecom provider aims to develop advanced RF solutions for next-generation communication networks.
Market Segmentation
The RF Semiconductor Market is segmented based on product, technology/component, application, and region. By product, the market includes RF front-end modules, power amplifiers, RF filters, switches, and antenna tuners, with RF front-end modules dominating due to their integrated functionality. By technology, the market is segmented into GaAs, GaN, SiC, and silicon-based technologies. Application-wise, the market covers telecommunications, consumer electronics, automotive, and industrial sectors. Regionally, the market is divided into North America, Europe, Asia Pacific, and Rest of the World.
-
RF front-end modules dominate the product segment
-
GaN and GaAs are key technology segments
-
Telecommunications is the leading application area
-
Asia Pacific offers the highest growth potential
-
Automotive and IoT applications are gaining traction
The RF Semiconductor Market is poised for substantial growth through 2036, driven by the increasing demand for high-speed wireless communication, advancements in AI and automation, and the expansion of IoT ecosystems. As industries continue to embrace digital transformation, RF semiconductors will play a critical role in enabling efficient and reliable connectivity. The integration of advanced materials, AI-driven design, and next-generation technologies is expected to further enhance performance and scalability. With strong growth potential across regions and applications, the RF Semiconductor Market represents a strategic opportunity for businesses to innovate and stay competitive in the evolving technology landscape.
FAQs
1. What is the current market size of the RF Semiconductor Market?
The RF Semiconductor Market was valued at approximately USD 28 billion in 2025.
2. What is the expected growth rate of the market?
The market is expected to grow at a CAGR of 10% from 2025 to 2036.
3. What are the key drivers of market growth?
Key drivers include 5G adoption, IoT expansion, AI integration, and increasing demand for wireless communication.
4. Which region dominates the RF Semiconductor Market?
North America currently holds the largest market share.
5. Who are the key players in the market?
Major companies include Qualcomm Incorporated, Broadcom Inc., and Skyworks Solutions, Inc.
To speak to our analyst for a discussion on the above findings, click Speak to Analyst
 Exclusive indicates content/data unique to MarketsandMarkets and not available with any competitors.
TABLE OF CONTENTS
1 INTRODUCTION (Page No. - 1)
1.1 STUDY OBJECTIVES
1.2 MARKET DEFINITION AND SCOPE
1.3 INCLUSIONS AND EXCLUSIONS
1.4 STUDY SCOPE
1.4.1 MARKETS COVERED
1.4.2 YEARS CONSIDERED
1.5 CURRENCY
1.6 LIMITATIONS
1.7 STAKEHOLDERS
2 RESEARCH METHODOLOGY (Page No. - 5)
2.1 RESEARCH DATA
2.1.1 SECONDARY DATA
2.1.1.1 Secondary sources
2.1.2 PRIMARY DATA
2.1.2.1 Breakdown of primaries
2.1.2.2 Key data from primary sources
2.1.2.3 Key industry insights
2.2 MARKET SIZE ESTIMATION
2.2.1 BOTTOM-UP APPROACH
2.2.1.1 Approach for capturing market size by bottom-up analysis (demand side)
2.2.2 TOP-DOWN APPROACH
2.2.2.1 Approach for capturing market size by top-down analysis (supply side)
2.3 MARKET BREAKDOWN AND DATA TRIANGULATION
2.4 RESEARCH ASSUMPTIONS
3 EXECUTIVE SUMMARY (Page No. - 16)
4 PREMIUM INSIGHTS (Page No. - 20)
4.1 ATTRACTIVE OPPORTUNITIES IN RF SEMICONDUCTOR MARKET
4.2 MARKET IN APAC, BY DEVICE AND APPLICATION
4.3 MARKET, BY FREQUENCY BAND
4.4 COUNTRY-WISE RF SEMICONDUCTOR MARKET GROWTH RATE
5 MARKET OVERVIEW (Page No. - 23)
6 RF SEMICONDUCTOR MARKET, BY DEVICE (Page No. - 30)
6.1 INTRODUCTION
6.2 FILTER & DUPLEXER
1.2.1 FILTERS TO HOLD LARGEST MARKET SHARE DURING FORECAST PERIOD
6.3 POWER AMPLIFIER
1.3.1 GAN-BASED POWER AMPLIFIERS FIND INCREASING APPLICATIONS IN BASE STATIONS
6.4 SWITCH
6.4.1 TECHNOLOGICAL ADVANCEMENTS IN TELECOM INDUSTRY TO DRIVE MARKET GROWTH
6.5 LOW NOISE AMPLIFIER
6.5.1 LOW NOISE AMPLIFIER FINDS INCREASED APPLICATIONS IN AEROSPACE & DEFENSE, AUTOMOTIVE, CONSUMER DEVICES, AND TELECOMMUNICATION
6.6 OTHERS (OSCILLATORS, ATTENUATORS, ANTENNA TUNERS, PHASE SHIFTERS, AND COUPLERS)
7 RF SEMICONDUCTOR MARKET, BY FREQUENCY BAND (Page No. - 41)
7.1 INTRODUCTION
7.2 VHF AND UHF
7.2.1 VHF & UHF FREQUENCY BANDS ARE AMONG MOST IMPORTANT FREQUENCY BANDS FOR MODERN WIRELESS COMMUNICATION SYSTEMS
7.3 SHF
7.3.1 SHF FREQUENCY BAND IS EXPECTED TO GROW AT HIGHEST CAGR DURING FORECAST PERIOD
7.4 EHF
7.4.1 EHF FREQUENCY BAND IS HIGHEST AVAILABLE FREQUENCY BAND IN RF SPECTRUM
8 RF SEMICONDUCTOR MARKET, BY MATERIAL (Page No. - 47)
8.1 INTRODUCTION
8.2 GALLIUM ARSENIDE (GaAs) AND PIEZOELECTRIC SUBSTRATE
8.2.1 GALLIUM ARSENIDE HAS MAJOR APPLICATIONS IN SMARTPHONES
8.3 SILICON (Si)/LDMOS
8.3.1 SILICON DEVICES ARE LEAST EXPENSIVE TO MANUFACTURE AS COMPARED TO OTHER DEVICES
8.4 SILICON GERMANIUM (SiGe)
8.4.1 SILICON GERMANIUM-BASED RF DEVICES FIND APPLICATIONS IN CONSUMER DEVICES, TELECOMMUNICATION, AND CATV & WIRED BROADBAND
8.5 GALLIUM NITRIDE (GaN) and GaN-on-SiC
8.5.1 MARKET FOR GALLIUM NITRIDE-BASED RF DEVICES EXPECTED TO GROW AT HIGHEST CAGR DURING FORECAST PERIOD
8.6 INDIUM PHOSPHIDE (InP)
8.6.1 InP OFFERS AN ALTERNATIVE TO GAAS IN PROVIDING INCREASED PERFORMANCE AT HIGHER PERFORMANCE WITH LOWER POWER CONSUMPTION
9 RF SEMICONDUCTOR, BY OPERATING VOLTAGE (Page No. - 54)
9.1 INTRODUCTION
9.2 UP TO 5 V
9.3 5.1 TO 20 V
9.4 ABOVE 20 V
10 RF SEMICONDUCTOR MARKET, BY APPLICATION (Page No. - 56)
10.1 INTRODUCTION
10.2 CONSUMER DEVICES
10.2.1 SMARTPHONES
10.2.1.1 Increasing adoption of smartphones and increasing RF components in smartphones drives market growth
10.2.2 LAPTOPS & TABLETS
10.2.2.1 Increasing adoption of GaAs-based RF devices in laptops and tablets to drive market
10.3 TELECOMMUNICATION
10.3.1.1 Telecommunication infrastructure expected to provide opportunities for GaN RF devices
10.4 AEROSPACE & DEFENSE AND SATCOM
10.4.1 RADAR
10.4.1.1 Increasing importance of advanced radar systems for aerospace & defense applications to drive market
10.4.2 ELECTRONIC WARFARE
10.4.2.1 Growing usage of RF jammers in military installations to drive market growth
10.5 AUTOMOTIVE
10.5.1 INCREASING ADOPTION OF ADAS SYSTEMS IN VEHICLES TO CREATE OPPORTUNITIES FOR RF MARKET
10.6 CATV & WIRED BROADBAND
10.6.1 CATV & WIRED BROADBAND NETWORKS ARE INCREASINGLY OPERATING IN FULLY-LOADED SPECTRUM
10.7 OTHERS
10.7.1 RF ENERGY
10.7.2 TEST & MEASUREMENT
11 GEOGRAPHIC ANALYSIS (Page No. - 68)
11.1 INTRODUCTION
11.2 NORTH AMERICA
11.2.1 US
11.2.1.1 US held largest share in North American RF semiconductor market
11.2.2 CANADA
11.2.2.1 Increasing investments in defense application to drive market in Canada
11.2.3 MEXICO
11.2.3.1 Growing demand for smartphones to drive market growth
11.3 EUROPE
11.3.1 UK
11.3.1.1 UK expected to grow at highest CAGR during forecast period
11.3.2 GERMANY
11.3.2.1 Growing investments in automotive sector to drive market in Germany
11.3.3 FRANCE
11.3.3.1 Development of infrastructure to support 5G technology expected to propel market
11.3.4 ITALY
11.3.4.1 Increasing penetration of broadband subscriptions to drive market growth
11.3.5 REST OF EUROPE
11.3.5.1 Rest of Europe held a significant market share of market
11.4 ASIA PACIFIC (APAC)
11.4.1 CHINA
11.4.1.1 China to hold largest market share in APAC RF semiconductor market
11.4.2 JAPAN
11.4.2.1 Ongoing implementation of 5G services in Japan to drive market
11.4.3 SOUTH KOREA
11.4.3.1 Increasing penetration of 5G technology and growing subscribers onto 5G network to drive market in South Korea
11.4.4 REST OF APAC
11.4.4.1 Rest of APAC presents an attractive opportunity for market players
11.5 REST OF THE WORLD (ROW)
11.5.1 SOUTH AMERICA
11.5.1.1 Growing penetration of LTE technology in Brazil to drive market
11.5.2 MIDDLE EAST AND AFRICA
11.5.2.1 Growing demand for broadband communication to drive market in Middle East & Africa
12 COMPANY PROFILES (Page No. - 111)
12.1 KEY PLAYERS
12.1.1 QORVO
12.1.1.1 Business overview
12.1.1.2 Products offered
12.1.1.3 Recent developments
12.1.1.4 SWOT analysis
12.1.1.5 MnM view
12.1.2 SKYWORKS
12.1.2.1 Business overview
12.1.2.2 Products offered
12.1.2.3 Recent developments
12.1.2.4 SWOT analysis
12.1.2.5 MnM view
12.1.3 QUALCOMM
12.1.3.1 Business overview
12.1.3.2 Products offered
12.1.3.3 Recent developments
12.1.3.4 SWOT analysis
12.1.3.5 MnM view
12.1.4 ANALOG DEVICES
12.1.4.1 Business overview
12.1.4.2 Products offered
12.1.4.3 Recent developments
12.1.4.4 SWOT analysis
12.1.4.5 MnM view
12.1.5 NXP SEMICONDUCTORS
12.1.5.1 Business overview
12.1.5.2 Products offered
12.1.5.3 Recent developments
12.1.5.4 SWOT analysis
12.1.5.5 MnM view
12.1.6 CREE
12.1.6.1 Business overview
12.1.6.2 Products offered
12.1.6.3 Recent developments
12.1.7 MACOM
12.1.7.1 Business overview
12.1.7.2 Products offered
12.1.7.3 Recent developments
12.1.8 MICROCHIP TECHNOLOGY
12.1.8.1 Business overview
12.1.8.2 Products offered
12.1.8.3 Recent developments
12.1.9 MURATA MANUFACTURING
12.1.9.1 Business overview
12.1.9.2 Products offered
12.1.9.3 Recent developments
12.1.10 TEXAS INSTRUMENTS
12.1.10.1 Business overview
12.1.10.2 Products offered
12.1.10.3 Recent developments
12.2 RIGHT TO WIN
12.3 OTHER PLAYERS
12.3.1 MAXIM INTEGRATED
12.3.2 MERCURY SYSTEMS
12.3.3 MITSUBISHI ELECTRIC
12.3.4 ON SEMICONDUCTOR
12.3.5 RFHIC
12.3.6 RICHWAVE
12.3.7 STMICROELECTRONICS
12.3.8 SUMITOMO ELECTRIC DRIVE INNOVATIONS
12.3.9 TDK ELECTRONICS
12.3.10 TELEDYNE
12.3.11 TOSHIBA
13 APPENDIX (Page No. - 144)
13.1 DISCUSSION GUIDE
13.2 KNOWLEDGE STORE: MARKETSANDMARKETS’ SUBSCRIPTION PORTAL
13.3 AVAILABLE CUSTOMIZATIONS
13.4 RELATED REPORTS
LIST OF TABLES (104 Tables)
TABLE 1 RF SEMICONDUCTOR MARKET, BY DEVICE, 2017–2025 (USD MILLION)
TABLE 2 MARKET FOR FILTER, BY APPLICATION 2017–2025 (USD MILLION)
TABLE 3 MARKET FOR FILTER, BY FREQUENCY, 2017–2025 (USD MILLION)
TABLE 4 MARKET FOR FILTER, BY REGION, 2017–2025 (USD MILLION)
TABLE 5 MARKET FOR POWER AMPLIFIER, BY APPLICATION, 2017–2025 (USD MILLION)
TABLE 6 MARKET FOR POWER AMPLIFIER, BY FREQUENCY, 2017–2025 (USD MILLION)
TABLE 7 MARKET FOR POWER AMPLIFIER, BY REGION, 2017–2025 (USD MILLION)
TABLE 8 MARKET FOR SWITCH, BY APPLICATION, 2017–2025 (USD MILLION)
TABLE 9 MARKET FOR SWITCH, BY FREQUENCY, 2017–2025 (USD MILLION)
TABLE 10 MARKET FOR SWITCH, BY REGION, 2017–2025 (USD MILLION)
TABLE 11 MARKET FOR LOW NOISE AMPLIFIER, BY APPLICATION, 2017–2025 (USD MILLION)
TABLE 12 MARKET FOR LOW NOISE AMPLIFIER, BY FREQUENCY, 2017–2025 (USD MILLION)
TABLE 13 MARKET FOR LOW NOISE AMPLIFIER, BY REGION, 2017–2025 (USD MILLION)
TABLE 14 MARKET FOR OTHER DEVICES, BY APPLICATION, 2017–2025 (USD MILLION)
TABLE 15 MARKET FOR OTHER DEVICES, BY FREQUENCY, 2017–2025 (USD MILLION)
TABLE 16 MARKET FOR OTHER DEVICES, BY REGION, 2017–2025 (USD MILLION)
TABLE 17 MARKET, BY FREQUENCY BAND, 2017–2025 (USD MILLION)
TABLE 18 MARKET FOR VHF AND UHF FREQUENCY BAND, BY DEVICE, 2017–2025 (UD MILLION)
TABLE 19 MARKET FOR VHF AND UHF FREQUENCY BANDS BY REGION, 2017–2025 (USD MILLION)
TABLE 20 MARKET FOR SHF FREQUENCY BAND, BY DEVICE, 2017–2025 (USD MILLION)
TABLE 21 MARKET FOR SHF FREQUENCY BAND BY REGION, 2017–2025 (USD MILLION)
TABLE 22 MARKET FOR EHF FREQUENCY BAND, BY DEVICE, 2017–2025 (USD MILLION)
TABLE 23 MARKET FOR EHF FREQUENCY BAND BY REGION, 2017–2025 (USD MILLION)
TABLE 24 MARKET, BY MATERIAL 2017–2025 (USD MILLION)
TABLE 25 MARKET FOR GALLIUM ARSENIDE (GaAs) AND PIEZOELECTRIC SUBSTRATE, BY REGION, 2017–2025 (USD MILLION)
TABLE 26 MARKET FOR SILICON (Si), BY REGION, 2017–2025 (USD MILLION)
TABLE 27 MARKET FOR SILICON GERMANIUM (SiGe), BY REGION, 2017–2025 (USD MILLION)
TABLE 28 MARKET FOR GALLIUM NITRIDE (GaN), BY REGION, 2017–2025 (USD MILLION)
TABLE 29 MARKET FOR INDIUM PHOSPHIDE (InP), BY REGION, 2017–2025 (USD MILLION)
TABLE 30 RF SEMICONDUCTOR DEVICES WITH OPERATING VOLTAGE UP TO 5 V
TABLE 31 RF SEMICONDUCTOR DEVICES WITH OPERATING VOLTAGE FROM 5.1 TO 20 V
TABLE 32 RF SEMICONDUCTOR DEVICES WITH OPERATING VOLTAGE ABOVE 20 V
TABLE 33 RF SEMICONDUCTOR MARKET, BY APPLICATION, 2017–2025 (USD MILLION)
TABLE 34 MARKET FOR CONSUMER DEVICES, BY DEVICE, 2017–2025 (USD MILLION)
TABLE 35 MARKET FOR CONSUMER DEVICES, BY REGION, 2017–2025 (USD MILLION)
TABLE 36 MARKET FOR TELECOMMUNICATION, BY DEVICE, 2017–2025 (USD MILLION)
TABLE 37 MARKET FOR TELECOMMUNICATION, BY REGION, 2017–2025 (USD MILLION)
TABLE 38 MARKET FOR AEROSPACE & DEFENCE, BY DEVICE, 2017–2025 (USD MILLION)
TABLE 39 MARKET FOR AEROSPACE & DEFENCE, BY REGION, 2017–2025 (USD MILLION)
TABLE 40 MARKET FOR AUTOMOTIVE, BY DEVICE, 2017–2025 (USD MILLION)
TABLE 41 MARKET FOR AUTOMOTIVE, BY REGION, 2017–2025 (USD MILLION)
TABLE 42 MARKET FOR CATV & WIRED BROADBAND, BY DEVICE, 2017–2025 (USD MILLION)
TABLE 43 MARKET FOR CATV & WIRED BROADBAND, BY REGION, 2017–2025 (USD MILLION)
TABLE 44 MARKET FOR OTHER APPLICATIONS, BY DEVICE, 2017–2025 (USD MILLION)
TABLE 45 MARKET FOR OTHER APPLICATIONS, BY REGION, 2017–2025 (USD MILLION)
TABLE 46 MARKET, BY REGION, 2017–2025 (USD MILLION)
TABLE 47 MARKET IN NORTH AMERICA, BY COUNTRY, 2017–2025 (USD MILLION)
TABLE 48 MARKET IN NORTH AMERICA, BY DEVICE, 2017–2025 (USD MILLION)
TABLE 49 MARKET IN NORTH AMERICA, BY FREQUENCY BAND, 2017–2025 (USD MILLION)
TABLE 50 MARKET IN NORTH AMERICA, BY MATERIAL, 2017–2025 (USD MILLION)
TABLE 51 MARKET IN NORTH AMERICA, BY APPLICATION, 2017–2025 (USD MILLION)
TABLE 52 MARKET FOR CONSUMER DEVICES APPLICATION IN NORTH AMERICA, BY COUNTRY, 2017–2025 (USD MILLION)
TABLE 53 MARKET FOR TELECOMMUNICATION APPLICATION IN NORTH AMERICA, BY COUNTRY, 2017–2025 (USD MILLION)
TABLE 54 MARKET FOR AEROSPACE & DEFENSE APPLICATION IN NORTH AMERICA, BY COUNTRY, 2017–2025 (USD MILLION)
TABLE 55 MARKET FOR AUTOMOTIVE APPLICATION IN NORTH AMERICA, BY COUNTRY, 2017–2025 (USD MILLION)
TABLE 56 MARKET FOR CATV & WIRED BROADBAND APPLICATION IN NORTH AMERICA, BY COUNTRY, 2017–2025 (USD MILLION)
TABLE 57 MARKET FOR OTHER APPLICATIONS IN NORTH AMERICA, BY COUNTRY, 2017–2025 (USD MILLION)
TABLE 58 MARKET IN US, BY APPLICATION, 2017–2025 (USD MILLION)
TABLE 59 MARKET IN CANADA, BY APPLICATION, 2017–2025 (USD MILLION)
TABLE 60 MARKET IN MEXICO, BY APPLICATION, 2017–2025 (USD MILLION)
TABLE 61 MARKET IN EUROPE, BY COUNTRY, 2017–2025 (USD MILLION)
TABLE 62 MARKET IN EUROPE, BY DEVICE, 2017–2025 (USD MILLION)
TABLE 63 MARKET IN EUROPE, BY FREQUENCY BAND, 2017–2025 (USD MILLION)
TABLE 64 MARKET IN EUROPE, BY MATERIAL, 2017–2025 (USD MILLION)
TABLE 65 MARKET IN EUROPE, BY APPLICATION, 2017–2025 (USD MILLION)
TABLE 66 MARKET FOR CONSUMER DEVICES APPLICATION IN EUROPE, BY COUNTRY, 2017–2025 (USD MILLION)
TABLE 67 MARKET FOR TELECOMMUNICATION APPLICATION IN EUROPE, BY COUNTRY, 2017–2025 (USD MILLION)
TABLE 68 MARKET FOR AEROSPACE & DEFENSE APPLICATION IN EUROPE, BY COUNTRY, 2017–2025 (USD MILLION)
TABLE 69 MARKET FOR AUTOMOTIVE APPLICATION IN EUROPE, BY COUNTRY, 2017–2025 (USD MILLION)
TABLE 70 MARKET FOR CATV & WIRED BROADBAND IN EUROPE, BY COUNTRY, 2017–2025 (USD MILLION)
TABLE 71 MARKET FOR OTHER APPLICATIONS IN EUROPE, BY COUNTRY, 2017–2025 (USD MILLION)
TABLE 72 MARKET IN UK, BY APPLICATION, 2017–2025 (USD MILLION)
TABLE 73 MARKET IN GERMANY, BY APPLICATION, 2017–2025 (USD MILLION)
TABLE 74 MARKET IN FRANCE, BY APPLICATION, 2017–2025 (USD MILLION)
TABLE 75 MARKET IN ITALY, BY APPLICATION, 2017–2025 (USD MILLION)
TABLE 76 MARKET IN REST OF EUROPE, BY APPLICATION, 2017–2025 (USD MILLION)
TABLE 77 MARKET IN APAC, BY COUNTRY, 2017–2025 (USD MILLION)
TABLE 78 MARKET IN APAC, BY DEVICE, 2017–2025 (USD MILLION)
TABLE 79 MARKET IN APAC, BY FREQUENCY BAND, 2017–2025 (USD MILLION)
TABLE 80 MARKET IN APAC, BY MATERIAL, 2017-2025 (USD MILLION)
TABLE 81 MARKET IN APAC, BY APPLICATION, 2017–2025 (USD MILLION)
TABLE 82 MARKET FOR CONSUMER DEVICES APPLICATION IN APAC, BY COUNTRY, 2017–2025 (USD MILLION)
TABLE 83 MARKET FOR TELECOMMUNICATION APPLICATION IN APAC, BY COUNTRY, 2017–2025 (USD MILLION)
TABLE 84 MARKET FOR AEROSPACE & DEFENSE APPLICATION IN APAC, BY COUNTRY, 2017–2025 (USD MILLION)
TABLE 85 MARKET FOR AUTOMOTIVE APPLICATION IN APAC, BY COUNTRY, 2017–2025 (USD MILLION)
TABLE 86 MARKET FOR CATV & WIRED BROADBAND APPLICATION IN APAC, BY COUNTRY, 2017–2025 (USD MILLION)
TABLE 87 MARKET FOR OTHER APPLICATIONS IN APAC, BY COUNTRY, 2017–2025 (USD MILLION)
TABLE 88 MARKET IN CHINA, BY APPLICATION, 2017–2025 (USD MILLION)
TABLE 89 MARKET IN JAPAN, BY APPLICATION, 2017–2025 (USD MILLION)
TABLE 90 MARKET IN SOUTH KOREA, BY APPLICATION, 2017–2025 (USD MILLION)
TABLE 91 MARKET IN REST OF APAC, BY APPLICATION, 2017–2025 (USD MILLION)
TABLE 92 MARKET IN ROW, BY REGION, 2017–2025 (USD MILLION)
TABLE 93 MARKET IN ROW, BY DEVICE, 2017–2025 (USD MILLION)
TABLE 94 MARKET IN ROW, BY FREQUENCY BAND, 2017–2025 (USD MILLION)
TABLE 95 MARKET IN ROW, BY MATERIAL, 2017–2025 (USD MILLION)
TABLE 96 MARKET IN ROW, BY APPLICATION, 2017–2025 (USD MILLION)
TABLE 97 MARKET FOR CONSUMER DEVICES APPLICATION IN ROW, BY REGION, 2017–2025 (USD MILLION)
TABLE 98 MARKET FOR TELECOMMUNICATION APPLICATION IN ROW, BY REGION, 2017–2025 (USD MILLION)
TABLE 99 MARKET FOR AEROSPACE & DEFENSE APPLICATION IN ROW, BY REGION, 2017–2025 (USD MILLION)
TABLE 100 MARKET FOR AUTOMOTIVE APPLICATION IN ROW, BY REGION, 2017–2025 (USD MILLION)
TABLE 101 MARKET FOR CATV & WIRED BROADBAND APPLICATION IN ROW, BY REGION, 2017–2025 (USD MILLION)
TABLE 102 MARKET FOR OTHER APPLICATIONS IN ROW, BY REGION, 2017–2025 (USD MILLION)
TABLE 103 MARKET IN SOUTH AMERICA, BY APPLICATION, 2017–2025 (USD MILLION)
TABLE 104 MARKET IN MIDDLE EAST & AFRICA, BY APPLICATION, 2017–2025 (USD MILLION)
LIST OF FIGURES (42 Figures)
FIGURE 1 RF SEMICONDUCTOR MARKET: PROCESS FLOW OF MARKET SIZE ESTIMATION
FIGURE 2 MARKET: RESEARCH DESIGN
FIGURE 3 RF SEMICONDUCTOR MARKET: BOTTOM-UP APPROACH
FIGURE 4 MARKET: TOP-DOWN APPROACH
FIGURE 5 DATA TRIANGULATION
FIGURE 6 ASSUMPTIONS FOR RESEARCH STUDY
FIGURE 7 FILTERS TO DOMINATE MARKET DURING FORECAST PERIOD
FIGURE 8 GALLIUM NITRIDE (GaN) BASED RF DEVICES TO EXHIBIT HIGHEST CAGR IN MARKET DURING FORECAST PERIOD
FIGURE 9 CONSUMER DEVICES TO LEAD MARKET DURING FORECAST PERIOD
FIGURE 10 MARKET IN APAC TO GROW AT HIGHEST CAGR DURING FORECAST PERIOD
FIGURE 11 RISING TRENDS OF 5G ADOPTION IN VARIOUS COUNTRIES TO DRIVE GROWTH OF RF SEMICONDUCTOR MARKET
FIGURE 12 FILTER AND CONSUMER DEVICES HELD LARGEST MARKET SHARE IN APAC, BY DEVICE AND APPLICATION, RESPECTIVELY, IN 2019
FIGURE 13 RF DEVICES OPERATING IN VHF AND UHF FREQUENCY BAND TO HOLD LARGEST MARKET SIZE DURING FORECAST PERIOD
FIGURE 14 CHINA TO RECORD HIGHEST CAGR IN MARKET DURING FORECAST PERIOD
FIGURE 15 FILTER TO DOMINATE MARKET DURING FORECAST PERIOD
FIGURE 16 RF SEMICONDUCTOR MARKET FOR FILTER IN APAC TO GROW AT HIGHEST CAGR DURING FORECAST PERIOD
FIGURE 17 APAC TO LEAD FOR RF SEMICONDUCTOR MARKET FOR POWER AMPLIFIER, DURING FORECAST PERIOD
FIGURE 18 FIGURE 1 SHF BAND TO GROW AT HIGHEST CAGR DURING FORECAST PERIOD
FIGURE 19 GALLIUM NITRIDE (GaN) BASED RF DEVICES TO GROW AT HIGHEST CAGR DURING FORECAST PERIOD
FIGURE 20 GaAs AND PIEZOELECTRIC SUBSTRATE BASED RF DEVICES TO GROW AT HIGHEST CAGR IN APAC DURING FORECAST PERIOD
FIGURE 21 CONSUMER DEVICES TO LEAD MARKET DURING FORECAST PERIOD
FIGURE 22 APAC TO DOMINATE MARKET FOR CONSUMER DEVICES DURING FORECAST PERIOD
FIGURE 23 MARKET IN APAC TO GROW AT HIGHEST CAGR FOR TELECOMMUNICATION APPLICATION DURING FORECAST PERIOD
FIGURE 24 NORTH AMERICA TO LEAD MARKET FOR AEROSPACE & DEFENSE DURING FORECAST PERIOD
FIGURE 25 MARKET IN APAC TO GROW AT HIGHEST CAGR DURING FORECAST PERIOD
FIGURE 26 NORTH AMERICA: SNAPSHOT OF MARKET
FIGURE 27 MARKET IN US EXPECTED TO GROW AT HIGHEST CAGR IN NORTH AMERICA DURING FORECAST PERIOD
FIGURE 28 EUROPE: SNAPSHOT OF MARKET
FIGURE 29 AUTOMOTIVE APPLICATION IN EUROPE TO GROW AT HIGHEST CAGR FOR MARKET DURING FORECAST PERIOD
FIGURE 30 APAC: SNAPSHOT OF MARKET
FIGURE 31 RF SEMICONDUCTOR MARKET IN CHINA TO GROW AT HIGHEST CAGR DURING FORECAST PERIOD
FIGURE 32 RF SEMICONDUCTOR MARKET IN SOUTH AMERICA TO GROW AT HIGHER CAGR IN ROW DURING FORECAST PERIOD
FIGURE 33 QORVO: COMPANY SNAPSHOT
FIGURE 34 SKYWORKS: COMPANY SNAPSHOT
FIGURE 35 QUALCOMM: COMPANY SNAPSHOT
FIGURE 36 ANALOG DEVICES: COMPANY SNAPSHOT
FIGURE 37 NXP SEMICONDUCTORS: COMPANY SNAPSHOT
FIGURE 38 CREE: COMPANY SNAPSHOT
FIGURE 39 MACOM: COMPANY SNAPSHOT
FIGURE 40 MICROCHIP TECHNOLOGY: COMPANY SNAPSHOT
FIGURE 41 MURATA MANUFACTURING: COMPANY SNAPSHOT
FIGURE 42 TEXAS INSTRUMENTS: COMPANY SNAPSHOT
The study involved four major activities in estimating the current size of the global RF semiconductor market. Exhaustive secondary research has been done to collect information about the market, the peer market, and the parent market. Validating findings, assumptions, and sizing with industry experts across the value chain through primary research has been the next step. Both top-down and bottom-up approaches have been employed to estimate the complete market size. After that, market breakdown and data triangulation methods have been used to estimate the market size of segments and subsegments.
Secondary Research
The research methodology used to estimate and forecast the RF semiconductor market begins with capturing data on revenues of the key vendors in the market through secondary research. This study incorporates the use of extensive secondary sources, directories, and databases such as Hoovers, Bloomberg Businessweek, Factiva, and OneSource to identify and collect information useful for the technical, market-oriented, and commercial study of the RF semiconductor market. Vendor offerings have also been considered to determine the market segmentation. This entire research methodology includes the study of annual and financial reports of top players, presentations, press releases, journals, paid databases, trade directories, and regulatory bodies.
Primary Research
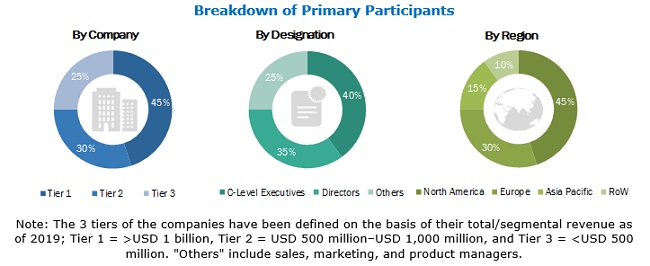
The RF semiconductor market comprises several stakeholders, such as wafer manufacturers and suppliers, integrated device manufacturers, and original equipment manufacturers. Demand-side of this market includes end-users from various applications such as consumer devices, telecommunication, and automotive. Several primary interviews have been conducted with market experts from both the demand and supply sides across four major regions: North America, Europe, APAC, and RoW to gather qualitative and quantitative information. Following is the breakdown of primary respondents.
To know about the assumptions considered for the study, download the pdf brochure
Market Size Estimation
The top-down and bottom-up approaches have been used to estimate and validate the overall size of the RF semiconductor market. These methods have also been used extensively to estimate the size of various market subsegments. The research methodology used to estimate the market size includes the following:
- Key players in major applications and markets have been identified through extensive secondary research.
- The industry's supply chain and market size, in terms of value, have been determined through primary and secondary research processes.
- Players offering different components such as power amplifiers, filters, and switches are considered, and their revenues are observed to arrive at a global number.
- All percentage shares, splits, and breakdowns have been determined using secondary sources and verified through primary sources.
Data Triangulation
After arriving at the overall market size using the estimation processes as explained above, the market was split into several segments and subsegments. To complete the overall market engineering process and arrive at the exact statistics of each market segment and subsegment, data triangulation, and market breakdown procedures have been employed, wherever applicable. The data has been triangulated by studying various factors and trends from both the demand and supply sides in the RF semiconductor market.
Report Objectives
- To describe and forecast the RF semiconductor market by device, material, frequency band, and application in terms of value
- To describe and forecast the market for various segments with regard to main regions, namely, North America, Europe, Asia Pacific (APAC), and Rest of the World (RoW), in terms of value
- To provide detailed information regarding major factors including drivers, restraints, opportunities, and challenges that influence the growth of the RF semiconductor market
- To provide a comprehensive overview of the value chain pertaining to the RF semiconductor ecosystem
- To strategically analyze micromarkets1 with respect to individual growth trends, prospects, and contribution to the total market
- To strategically profile key players and comprehensively analyze their market position in terms of revenue and core competencies2, along with detailing the competitive landscape for market leaders
- To analyze competitive developments such as acquisitions, agreements, partnerships, and product launches in the RF semiconductor market
- To benchmark players within the market using proprietary "Competitive Leadership Mapping" framework, which analyzes market players on various parameters within the broad categories of business and product strategy
Available Customizations
With the given market data, MarketsandMarkets offers customizations according to the company's specific needs. The following customization options are available for the RF semiconductor market report:
Product Analysis
- Product matrix that gives a detailed comparison of the product portfolio of each company
Company Information
- Detailed analysis and profiling of additional market players (up to 5).


Growth opportunities and latent adjacency in RF Semiconductor Market