Quantum Dot Market

Quantum Dot Market by Material (Cadmium-based Quantum Dots, Cadmium-free Quantum Dots), Product (Displays, Lasers, Solar Cells/Modules, Medical Devices, Photodetectors/Sensors, LED Products), Display, Vertical and Region - Global Forecast to 2029

Report Code: SE 3146 May, 2024, by marketsandmarkets.com

[250 Pages Report] The quantum dot market is estimated to be worth USD 10.6 billion in 2024 and is projected to reach USD 23.9 billion by 2029, at a CAGR of 17.7% during the forecast period. The accelerating demand for quantum dot-based displays is one of the major drivers of quantum dot market. Furthermore, the growing adoption of quantum dots in healthcare sector provides growth opportunities in the quantum dot market.

Quantum Dot Market

Quantum Dot Market

Quantum Dot Market Forecast to 2029

To know about the assumptions considered for the study, Request for Free Sample Report

Quantum Dot Market Dynamics

Driver: Accelerating demand for quantum dot based displays

There is a growing deployment of quantum dots in display applications which can be employed in various methods, such as Quantum Dot Enhancement Film (QDEF) or Quantum Dot Color Filters (QDCFs). These methods aim to enhance the color gamut and performance. Quantum dots are nanoparticle entities that enhance the color spectrum, high quality of LCDs, while maintaining the same cost structures. Quantum dots are embedded in resin within barrier layers to create a film (QDEF), which deliver augmented color performance, and advancing quantum dot color filters (QDCFs) for superior color accuracy and display performance. Integrating quantum dots in display applications can provide precise color reproduction, heightened peak brightness, improved energy efficiency, extended lifespan, and reduced burn-in risks, that enhance the visual experiences across diverse display devices. Therefore, accelerating demand for quantum dot based displays drives the growth of the quantum dot market.

Restraint: Presence of alternative display technologies

Alternative display technologies like OLED and LCDs can impede the market growth of quantum dots, even though it provides benefits such as enhanced color resolution, purity, and energy efficiency. OLED displays deliver enhanced picture quality, by offering superior color reproduction and contrast due to each pixel serving as its light source, which leads to true black levels, improved contrast, and wide viewing angles. Additionally, OLED screens are thinner and consume less power which makes them highly preferable in mobile devices. Therefore, presence of alternative display technologies has the potential to hinder the market growth of quantum dots.

Opportunity: Growing adoption of quantum dots in healthcare sector

The utilization of quantum dots for biological and medical imaging is driven by their exceptional properties that make them highly suitable for such applications. Quantum dots offer distinct advantages over traditional dyes, such as high brightness and stability against photobleaching, along with intermittent fluorescence signals, which facilitate precise visualization of cellular components and tissues. Moreover, the tunable emission spectra of quantum dots that are achieved through manipulation of particle size and core composition, enables diverse array of colors and optical characteristics, thereby enhancing imaging capabilities within biological systems. Therefore, the distinctive properties of quantum dot such as high brightness, tunable emission spectra, cellular uptake, and in vivo imaging capabilities, underpin their increasing use for advanced imaging technologies in biomedicine, which is expected to provide opportunities for the market players that manufacture quantum dots.

Challenge: Existence of environmental regulations for quantum dots

Government regulations pertaining to quantum dot materials present a notable obstacle to the expansion of the quantum dot market. The European Union's Regulatory of Hazardous Substances (RoHS) directive imposes restrictions on specific hazardous substances in electronic equipment which impacts the utilization of quantum dots in display applications. Therefore, in order to align with such regulations quantum dot players are getting involved in the development of cadmium-free quantum dots. Previously, cadmium-based quantum dots were prevalent in QD displays; however, due to environmental concerns, the industry is now concentrating on cadmium-free alternatives. As quantum dots are highly adopted in display applications, the manufacturers are actively investing in research and development efforts aimed at creating cadmium-free quantum dots and satisfy the increasing demand for eco-friendly display technologies which thereby might restrain the market growth.

Quantum Dot Market Ecosystem

The prominent players in the quantum dot market are AUO Corporation (Taiwan), BOE Technology Group Co., Ltd. (China), SAMSUNG DISPLAY (South Korea), LG DISPLAY CO., LTD. (South Korea), and TCL China Star Optoelectronics Technology Co., Ltd. (China). These companies perform organic and inorganic growth strategies to expand themselves globally by providing advanced quantum dot devices.

Quantum Dot Market by Ecosystem

Cadmium-free quantum dots is expected to register highest CAGR in the quantum dot market during forecast period  

The cadmium-free quantum dot market is anticipated to project the highest CAGR during the forecast period. Cadmium poses health risks which includes renal failure and skeletal lesions, necessitating careful control of cadmium levels in quantum dots to meet regulatory standards. Historically, cadmium had few substitutes, but recent developments have introduced materials like indium phosphide and indium arsenide as viable alternatives to cadmium. Therefore, cadmium-free quantum dots is expected to have the highest CAGR in the quantum dot market during the forecast period.

Quantum dot displays market is expected to have the largest market size in the quantum dot market during forecast period  

In quantum dot LED (QLED) displays, LEDs serve as the light source, particularly for backlighting in additional display applications. QLED displays offer a narrow light spectrum and high stability which leads to cost savings, making them highly favored by manufacturers. Quantum dots can be integrated into various applications such as flat-panel TVs, digital cameras, gaming monitors, and personal digital assistant (PDA) devices. Therefore, quantum dot displays market is expected to have the largest market size in the quantum dot market during the forecast period

Asia Pacific is expected to have the largest market size in quantum dot market during the forecast period

In recent years, Asia Pacific has witnessed significant industrial and technological advancements. The region benefits from the presence of established display manufacturers and the substantial focus of market players and research institutes on quantum dot technology R&D. This market is predominantly driven by China, Japan, South Korea, India, and the Rest of Asia Pacific, with market players expanding their footprint in emerging economies like India, China, and other Southeast Asian nations. Furthermore, China holds the largest share in the quantum dot market. Therefore, Asia Pacific is expected to hold the largest market size during the forecast period.

Quantum Dot Market by Region

Quantum Dot Market by Region

To know about the assumptions considered for the study, download the pdf brochure

Key Market Players

The major players in the quantum dot companies include AUO Corporation (Taiwan), BOE Technology Group Co., Ltd. (China), SAMSUNG DISPLAY (South Korea), LG DISPLAY CO., LTD. (South Korea), and TCL China Star Optoelectronics Technology Co., Ltd. (China). These companies have used both organic and inorganic growth strategies such as product launches, agreements, collaborations and acquisitions to strengthen their position in the market.

Get online access to the report on the World's First Market Intelligence Cloud

  • Easy to Download Historical Data & Forecast Numbers
  • Company Analysis Dashboard for high growth potential opportunities
  • Research Analyst Access for customization & queries
  • Competitor Analysis with Interactive dashboard
  • Latest News, Updates & Trend analysis
Request Sample

Scope of the Report

Report Metric

Details

Market size available for years

2020–2029

Base year considered

2023

Forecast period

2024–2029

Forecast units

Value (USD Million/Billion), Volume (Million Units)

Segments covered

By Material, Product, Display, Vertical, and Region

Geographies covered

North America, Europe, Asia Pacific, and Rest of the World (RoW)

Companies covered

The major players in the quantum dot market are AUO Corporation (Taiwan), BOE Technology Group Co., Ltd. (China), SAMSUNG DISPLAY (South Korea), LG DISPLAY CO., LTD. (South Korea), TCL China Star Optoelectronics Technology Co., Ltd. (China), SHOEI CHEMICAL, INC. (Japan), American Elements. (US), HANSOLCHEMICAL (South Korea), Nanoco Group plc (UK), Avantama AG (Switzerland), NNCrystal US Corporation (US), Ocean Nanotech (US), Quantum Materials Corp (US), Quantum Solutions. (UK), and Merck KGaA (Germany)

Quantum Dot Market Highlights

The study segments the quantum dot market based on material, display, product, vertical, and region at the regional and global level.

Segment

Subsegment

By Material

  • Cadmium-based Quantum Dots
    • Cadmium Selenide Quantum Dots
    • Cadmium Sulfide Quantum Dots
    • Cadmium Telluride Quantum Dots
    • Cadmium Zinc Selenide Quantum Dots
  • Cadmium-free Quantum Dots
    • Indium Arsenide Quantum Dots
    • Silicon Quantum Dots
    • Graphene Quantum Dots
    • Lead Sulfide Quantum Dots
    • Carbon Quantum Dots
    • Perovskite Quantum Dots
    • Lead Selenide Quantum Dots
    • Others

By Product

  • Displays
  • Lasers
  • Solar Cells/Modules
  • Medical Devices
  • Photodetectors/Sensors
  • LED Products
  • Others

By Display

  • Display Technology
    • QD-LCDs
    • Mini-LEDs
    • QD-OLEDs

By Vertical

  • Consumer
  • Commercial
    • Retail
    • Corporate
    • Hospitality
  • Healthcare
    • Biological Imaging
    • Cellular Labeling
    • DNA Labeling
    • Quantum Dots based Cancer Diagnosis
  • Defense
  • Telecommunications
  • Others
    • Manufacturing
    • Transportation
    • Education
    • Sports & Entertainment
    • Agriculture/Horticulture Lighting

By Region

  • North America
    • US
    • Canada
    • Mexico
  • Europe
    • UK
    • Germany
    • France
    • Italy
    • Spain
    • Rest of Europe
  • Asia Pacific
    • China
    • Japan
    • South Korea
    • India
    • Rest of Asia Pacific
  • Rest of the World (RoW)
    • Middle East & Africa
      • Gulf Cooperation Council (GCC)
      • Rest of Middle East & Africa
    • South America

Recent Developments

  • In April 2024, SAMSUNG DISPLAY launched its new QD-OLED reference monitors in collaboration with renowned broadcast monitor brands SmallHD and Flanders Scientific Inc. (FSI). These monitors are used on film and broadcast productions to check the quality of footage or to calibrate color tones and images to match content concepts. These monitors are essential tools for ensuring the high quality of captured footage, enhanced accuracy in color reproduction, black depth and luminance.
  • In September 2023, SHOEI CHEMICAL, INC. has completed a definitive asset purchase agreement with Nanosys, Inc. to acquire all the assets associated with the Nanosys quantum dot business. Furthermore, Nanosys’ sales and marketing teams, research and development team, and its Silicon Valley, California laboratories are a part of SHOEI.
  • In May 2023, BOE Technology Group Co., Ltd. announced that it has successfully developed a 4.7-inch 650 PPI Active-Matrix Quantum Dot Light-emitting Diode (AMOLED) display prototype based on direct photolithography technology of quantum dots in QLED (DP-QLED)
  • In May 2023, Nanoco Technologies Limited (Nanoco), a wholly owned subsidiary of Nanoco Group plc and Guangdong Poly Optoelectronics Co., Ltd. (POE) formed a licensing and collaboration agreement. Under this agreement, Nanoco and POE partnered on the development of cadmium-free quantum dot products for various applications which includes advanced displays and lighting films. This collaboration provided Nanoco with the opportunity to supply its CFQD quantum dots in the Chinese market.
  • In December 2021, LG DISPLAY CO., LTD. launched its OLED TV technology ‘OLED EX’. This display uses LG Display’s deuterium and personalized algorithm-based ‘EX Technology,’ which helps to boost the overall picture quality by enhancing brightness up to 30 percent as compared to conventional OLED displays.

Frequently Asked Questions (FAQs):

To speak to our analyst for a discussion on the above findings, click Speak to Analyst

TABLE OF CONTENTS
 
1 INTRODUCTION (Page No. - 32)
    1.1 STUDY OBJECTIVES 
    1.2 MARKET DEFINITION 
    1.3 STUDY SCOPE 
           1.3.1 MARKETS COVERED
                    FIGURE 1 QUANTUM DOT: MARKET SEGMENTATION
           1.3.2 GEOGRAPHIC SCOPE
                    FIGURE 2 QUANTUM DOT MARKET: GEOGRAPHIC SCOPE
           1.3.3 INCLUSIONS AND EXCLUSIONS AT COMPANY LEVEL
           1.3.4 INCLUSIONS AND EXCLUSIONS AT MATERIAL LEVEL
           1.3.5 INCLUSIONS AND EXCLUSIONS AT PRODUCT LEVEL
           1.3.6 INCLUSIONS AND EXCLUSIONS AT VERTICAL LEVEL
           1.3.7 INCLUSIONS AND EXCLUSIONS AT REGIONAL LEVEL
           1.3.8 YEARS CONSIDERED
    1.4 CURRENCY CONSIDERED 
    1.5 UNITS CONSIDERED 
    1.6 LIMITATIONS 
    1.7 STAKEHOLDERS 
    1.8 SUMMARY OF CHANGES 
           1.8.1 RECESSION IMPACT
 
2 RESEARCH METHODOLOGY (Page No. - 38)
    2.1 RESEARCH APPROACH 
           FIGURE 3 QUANTUM DOT MARKET: RESEARCH DESIGN
           2.1.1 SECONDARY DATA
                    2.1.1.1 Major secondary sources
                    2.1.1.2 Key data from secondary sources
           2.1.2 PRIMARY DATA
                    2.1.2.1 Primary interviews with experts
                    2.1.2.2 List of key primary interview participants
                    2.1.2.3 Breakdown of primaries
                    2.1.2.4 Key data from primary sources
           2.1.3 SECONDARY AND PRIMARY RESEARCH
                    2.1.3.1 Key industry insights
    2.2 MARKET SIZE ESTIMATION 
           2.2.1 BOTTOM-UP APPROACH
                    2.2.1.1 Approach to obtain market share using bottom-up analysis (demand side)
                               FIGURE 4 BOTTOM-UP APPROACH
           2.2.2 TOP-DOWN APPROACH
                    2.2.2.1 Approach to obtain market share using top-down analysis (supply side)
                               FIGURE 5 TOP-DOWN APPROACH
    2.3 FACTOR ANALYSIS 
           2.3.1 SUPPLY-SIDE ANALYSIS
                    FIGURE 6 MARKET SIZE ESTIMATION METHODOLOGY: SUPPLY-SIDE ANALYSIS (APPROACH 1)
                    FIGURE 7 MARKET SIZE ESTIMATION: SUPPLY-SIDE ANALYSIS (APPROACH 2)
           2.3.2 GROWTH FORECAST ASSUMPTIONS
                    TABLE 1 MARKET GROWTH ASSUMPTIONS
    2.4 RECESSION IMPACT 
    2.5 MARKET BREAKDOWN AND DATA TRIANGULATION 
           FIGURE 8 DATA TRIANGULATION
    2.6 RESEARCH ASSUMPTIONS 
    2.7 RISK ASSESSMENT 
           TABLE 2 RISK ASSESSMENT: QUANTUM DOT MARKET
 
3 EXECUTIVE SUMMARY (Page No. - 51)
    FIGURE 9 QUANTUM DOT MARKET: GLOBAL SNAPSHOT
    FIGURE 10 CADMIUM-FREE QUANTUM DOTS SEGMENT TO DOMINATE MARKET DURING FORECAST PERIOD
    FIGURE 11 QUANTUM DOT DISPLAYS TO BE LARGER SEGMENT DURING FORECAST PERIOD
    FIGURE 12 MINI-LED TO BE LARGEST SEGMENT DURING FORECAST PERIOD
    FIGURE 13 CONSUMER SEGMENT TO ACCOUNT FOR LARGEST MARKET SIZE DURING FORECAST PERIOD
    FIGURE 14 ASIA PACIFIC TO DOMINATE MARKET DURING FORECAST PERIOD
 
4 PREMIUM INSIGHTS (Page No. - 56)
    4.1 ATTRACTIVE GROWTH OPPORTUNITIES FOR PLAYERS IN QUANTUM DOT MARKET 
           FIGURE 15 INCREASE IN DEPLOYMENT OF QUANTUM DOT PHOTODETECTORS/SENSORS TO DRIVE MARKET GROWTH
    4.2 QUANTUM DOT MARKET, BY VERTICAL 
           FIGURE 16 CONSUMER VERTICAL TO ACCOUNT FOR LARGEST SHARE OF QUANTUM DOT MARKET DURING FORECAST PERIOD
    4.3 QUANTUM DOT MARKET, BY PRODUCT 
           FIGURE 17 QUANTUM DOT DISPLAYS TO BE LARGER SEGMENT OF QUANTUM DOT MARKET DURING FORECAST PERIOD
    4.4 QUANTUM DOT MARKET, BY DISPLAY 
           FIGURE 18 MINI-LED SEGMENT TO BE LARGEST MARKET DURING FORECAST PERIOD
    4.5 QUANTUM DOT MARKET, BY MATERIAL 
           FIGURE 19 CADMIUM-FREE QUANTUM DOTS TO DOMINATE QUANTUM DOT MARKET DURING FORECAST PERIOD
    4.6 QUANTUM DOT MARKET IN ASIA PACIFIC, BY VERTICAL AND COUNTRY, 2024 
           FIGURE 20 CONSUMER VERTICAL AND CHINA HELD LARGEST MARKET SHARES IN QUANTUM DOT MARKET IN ASIA PACIFIC IN 2024
 
5 MARKET OVERVIEW (Page No. - 60)
    5.1 INTRODUCTION 
    5.2 MARKET DYNAMICS 
           FIGURE 21 DRIVERS, RESTRAINTS, OPPORTUNITIES, AND CHALLENGES IN QUANTUM DOT MARKET
           5.2.1 DRIVERS
                    5.2.1.1 Growing deployment of quantum dots in display applications
                    5.2.1.2 Rising adoption of quantum dots in LED products
                    5.2.1.3 Increasing integration of quantum dots in solar cells
                               FIGURE 22 IMPACT ANALYSIS OF DRIVERS ON QUANTUM DOT MARKET
           5.2.2 RESTRAINTS
                    5.2.2.1 Limited availability of rare earth materials
                    5.2.2.2 High efficacy of alternative display technologies
                               FIGURE 23 IMPACT ANALYSIS OF RESTRAINTS ON QUANTUM DOT MARKET
           5.2.3 OPPORTUNITIES
                    5.2.3.1 Increasing use of quantum dots for biological and medical imaging
                    5.2.3.2 Emerging implementation of quantum dots in image sensors
                               FIGURE 24 IMPACT ANALYSIS OF OPPORTUNITIES ON QUANTUM DOT MARKET
           5.2.4 CHALLENGES
                    5.2.4.1 Presence of environmental regulations for quantum dots
                               FIGURE 25 IMPACT ANALYSIS OF CHALLENGES ON QUANTUM DOT MARKET
    5.3 SUPPLY CHAIN ANALYSIS 
           FIGURE 26 SUPPLY CHAIN ANALYSIS: QUANTUM DOT MARKET
           TABLE 3 QUANTUM DOT MARKET: SUPPLY CHAIN ANALYSIS
    5.4 ECOSYSTEM/MARKET MAP 
           FIGURE 27 QUANTUM DOT MARKET: ECOSYSTEM
    5.5 INVESTMENT AND FUNDING SCENARIO 
           FIGURE 28 INVESTMENT AND FUNDING SCENARIO, 2019–2024
    5.6 TRENDS/DISRUPTIONS IMPACTING CUSTOMER BUSINESS 
           FIGURE 29 REVENUE SHIFTS FOR QUANTUM DOT MARKET
    5.7 TECHNOLOGY ANALYSIS 
           5.7.1 KEY TECHNOLOGIES
                    5.7.1.1 Self-emitting quantum dot displays
                    5.7.1.2 Quantum dot in image sensors
           5.7.2 COMPLEMENTARY TECHNOLOGIES
                    5.7.2.1 Micro-LED
           5.7.3 ADJACENT TECHNOLOGIES
                    5.7.3.1 QD-LCD
                    5.7.3.2 QD-OLED
    5.8 PRICING ANALYSIS 
           5.8.1 AVERAGE SELLING PRICE OF PRODUCTS OFFERED BY KEY PLAYERS
                    FIGURE 30 AVERAGE SELLING PRICE OF PRODUCTS OFFERED BY KEY PLAYERS
                    TABLE 4 AVERAGE SELLING PRICE OF QUANTUM DOT DISPLAYS OFFERED BY KEY PLAYERS
           5.8.2 AVERAGE SELLING PRICE TREND OF QUANTUM DOTS, BY REGION
                    FIGURE 31 AVERAGE SELLING PRICE TREND FOR MINI-LED DISPLAYS, BY REGION
    5.9 KEY STAKEHOLDERS & BUYING CRITERIA 
           5.9.1 KEY STAKEHOLDERS IN BUYING PROCESS
                    FIGURE 32 INFLUENCE OF STAKEHOLDERS ON BUYING PROCESS OF TOP THREE END-USE VERTICALS
                    TABLE 5 INFLUENCE OF STAKEHOLDERS ON BUYING PROCESS OF TOP THREE END-USE VERTICALS
           5.9.2 BUYING CRITERIA
                    FIGURE 33 KEY BUYING CRITERIA FOR TOP THREE END-USE VERTICALS
                    TABLE 6 KEY BUYING CRITERIA FOR TOP THREE END-USE VERTICALS
    5.10 PORTER’S FIVE FORCES ANALYSIS 
           TABLE 7 QUANTUM DOT MARKET: PORTER’S FIVE FORCES ANALYSIS
           FIGURE 34 QUANTUM DOT MARKET: PORTER’S FIVE FORCES ANALYSIS, 2023
           FIGURE 35 IMPACT OF PORTER’S FIVE FORCES ON QUANTUM DOT MARKET, 2023
           5.10.1 THREAT OF NEW ENTRANTS
           5.10.2 THREAT OF SUBSTITUTES
           5.10.3 BARGAINING POWER OF SUPPLIERS
           5.10.4 BARGAINING POWER OF BUYERS
           5.10.5 INTENSITY OF COMPETITIVE RIVALRY
    5.11 CASE STUDIES 
           5.11.1 USING NANOCO’S QUANTUM DOTS TO MANUFACTURE WAH HONG INDUSTRIAL CORPORATION’S FILMS FOR USAGE IN TV AND MONITOR PRODUCTS
           5.11.2 EXPLORING POTENTIAL OF UBIQD’S QUANTUM DOTS TO MANUFACTURE FIRST SOLAR’S ADVANCED SOLAR MODULES
           5.11.3 INCORPORATING QUANTUM SOLUTIONS’ QUANTUM DOTS TO MANUFACTURE QDOT PEROVSKITE CSPBBR3 SINGLE CRYSTALS FOR X-RAY SENSORS
           5.11.4 ENHANCING PICTURE QUALITY OF LG’S ULTRA HD TV BY INCORPORATING DOW’S QUANTUM DOTS
    5.12 TRADE ANALYSIS 
           TABLE 8 IMPORT DATA FOR HS CODE 8541, BY COUNTRY, 2019–2023 (USD BILLION)
           FIGURE 36 IMPORT DATA FOR HS CODE 8541, 2019–2023
           TABLE 9 EXPORT DATA FOR HS CODE 8541, BY COUNTRY, 2019–2023 (USD BILLION)
           FIGURE 37 EXPORT DATA FOR HS CODE 8541, 2019–2023
    5.13 LIST OF KEY PATENTS AND INNOVATIONS 
           TABLE 10 PATENTS FILED DURING REVIEW PERIOD
           FIGURE 38 NUMBER OF PATENTS GRANTED FOR QUANTUM DOT
           FIGURE 39 TOP 10 COMPANIES WITH HIGHEST NUMBER OF PATENTS GRANTED DURING REVIEW PERIOD
           TABLE 11 TOP 20 PATENT OWNERS, 2013–2023
           TABLE 12 KEY PATENTS RELATED TO QUANTUM DOT
    5.14 REGULATORY LANDSCAPE PERTAINING TO QUANTUM DOT MARKET 
           5.14.1 GLOBAL
           5.14.2 EUROPE
           5.14.3 ASIA-PACIFIC
           5.14.4 NORTH AMERICA
           5.14.5 GOVERNMENT REGULATIONS
                    5.14.5.1 Asia Pacific
                    5.14.5.2 North America
                    5.14.5.3 Europe
    5.15 KEY CONFERENCES & EVENTS, 2024—2025 
           TABLE 13 QUANTUM DOT MARKET: DETAILED LIST OF CONFERENCES & EVENTS
 
6 QUANTUM DOT MARKET, BY DISPLAY (Page No. - 91)
    6.1 INTRODUCTION 
    6.2 DISPLAY TECHNOLOGY 
           TABLE 14 QUANTUM DOT MARKET, BY DISPLAY TYPE, 2020–2023 (USD MILLION)
           FIGURE 40 MINI-LED DISPLAY TO BE LARGEST SEGMENT DURING FORECAST PERIOD
           TABLE 15 QUANTUM DOT MARKET, BY DISPLAY TYPE, 2024–2029 (USD MILLION)
           TABLE 16 QUANTUM DOT MARKET, BY DISPLAY TYPE, 2020–2023 (MILLION UNITS)
           TABLE 17 QUANTUM DOT MARKET, BY DISPLAY TYPE, 2024–2029 (MILLION UNITS)
           6.2.1 QUANTUM DOT LCDS (QD LCDS)
                    6.2.1.1 Growing need for enhanced color accuracy to drive market
           6.2.2 MINI-LEDS
                    6.2.2.1 Rising demand for enhanced color accuracy, brightness, and energy efficiency to drive market
           6.2.3 QUANTUM DOT OLED (QD-OLED)
                    6.2.3.1 Growing preference for QD-OLEDs in high-end displays to drive market
    6.3 DISPLAY PANEL TYPE 
           6.3.1 QUANTUM DOT ENHANCEMENT FILM (QDEF) DISPLAYS
           6.3.2 QUANTUM DOT COLOR FILTER (QD-CF) DISPLAYS
           6.3.3 SELF-EMITTING/TRUE QLED DISPLAYS
 
7 QUANTUM DOT MARKET, BY MATERIAL (Page No. - 96)
    7.1 INTRODUCTION 
           TABLE 18 QUANTUM DOT MARKET, BY MATERIAL, 2020–2023 (USD MILLION)
           FIGURE 41 CADMIUM-FREE QUANTUM DOTS TO BE LARGER SEGMENT DURING FORECAST PERIOD
           TABLE 19 QUANTUM DOT MARKET, BY MATERIAL, 2024–2029 (USD MILLION)
    7.2 CADMIUM-BASED QUANTUM DOTS 
           7.2.1 GROWING INTEGRATION OF CADMIUM-BASED QUANTUM DOTS IN MEDICAL DEVICES AND PHOTODETECTORS/SENSORS
           7.2.2 CADMIUM SELENIDE QUANTUM DOTS
           7.2.3 CADMIUM SULFIDE QUANTUM DOTS
           7.2.4 CADMIUM TELLURIDE QUANTUM DOTS
           7.2.5 CADMIUM ZINC SELENIDE QUANTUM DOTS
    7.3 CADMIUM-FREE QUANTUM DOTS 
           7.3.1 GROWING DEMAND FOR SAFER AND MORE SUSTAINABLE QUANTUM DOTS TO DRIVE MARKET
           7.3.2 INDIUM ARSENIDE QUANTUM DOTS
           7.3.3 SILICON QUANTUM DOTS
           7.3.4 GRAPHENE QUANTUM DOTS
           7.3.5 PEROVSKITE QUANTUM DOTS
           7.3.6 LEAD SULFIDE QUANTUM DOTS
           7.3.7 LEAD SELENIDE QUANTUM DOTS
           7.3.8 OTHER QUANTUM DOTS
 
8 QUANTUM DOT MARKET, BY PRODUCT (Page No. - 102)
    8.1 INTRODUCTION 
           TABLE 20 QUANTUM DOT MARKET, BY PRODUCT TYPE, 2020–2023 (USD MILLION)
           FIGURE 42 QUANTUM DOT DISPLAYS TO ACCOUNT FOR LARGER MARKET SIZE DURING FORECAST PERIOD
           TABLE 21 QUANTUM DOT MARKET, BY PRODUCT TYPE, 2024–2029 (USD MILLION)
           TABLE 22 QUANTUM DOT MARKET, BY PRODUCT, 2020–2023 (USD MILLION)
           TABLE 23 QUANTUM DOT MARKET, BY PRODUCT, 2024–2029 (USD MILLION)
    8.2 QUANTUM DOT DISPLAYS 
           8.2.1 INCREASING DEMAND FOR NARROW SPECTRUM AND HIGH STABILITY TO DRIVE MARKET
                    TABLE 24 QUANTUM DOT DISPLAY MARKET, BY VERTICAL, 2020–2023 (USD MILLION)
                    FIGURE 43 CONSUMER VERTICAL TO ACCOUNT FOR LARGEST MARKET SIZE DURING FORECAST PERIOD
                    TABLE 25 QUANTUM DOT DISPLAY MARKET, BY VERTICAL, 2024–2029 (USD MILLION)
    8.3 QUANTUM DOT LASERS 
           8.3.1 GROWING DEMAND FOR HIGH OUTPUT POWER AND SUPERIOR TEMPERATURE STABILITY TO DRIVE MARKET
                    TABLE 26 QUANTUM DOT LASERS MARKET, BY VERTICAL, 2020–2023 (USD MILLION)
                    TABLE 27 QUANTUM DOT LASERS MARKET, BY VERTICAL, 2024–2029 (USD MILLION)
    8.4 QUANTUM DOT SOLAR CELLS/MODULES 
           8.4.1 RISING NEED TO CAPTURE SOLAR ENERGY MORE COST-EFFECTIVELY TO DRIVE MARKET
                    TABLE 28 QUANTUM DOT SOLAR CELLS/MODULES MARKET, BY VERTICAL, 2024–2029 (USD MILLION)
                    FIGURE 44 CONSUMER VERTICAL TO ACCOUNT FOR LARGEST SHARE IN QUANTUM DOT SOLAR CELLS/MODULES MARKET DURING FORECAST PERIOD
    8.5 QUANTUM DOT MEDICAL DEVICES 
           8.5.1 DIVERSE APPLICATIONS TO DRIVE MARKET
                    TABLE 29 QUANTUM DOT MEDICAL DEVICES MARKET, BY VERTICAL, 2024–2029 (USD MILLION)
    8.6 QUANTUM DOT PHOTODETECTORS/SENSORS 
           8.6.1 GROWING DEMAND FOR PHOTODETECTORS/SENSORS THAT DELIVER LOW COST AND SUPERIOR QUALITY TO DRIVE MARKET
                    TABLE 30 QUANTUM DOT PHOTODETECTORS/SENSORS MARKET, BY VERTICAL, 2024–2029 (USD MILLION)
    8.7 QUANTUM DOT LED PRODUCTS 
           8.7.1 RISING DEMAND FOR LEDS THAT DELIVER HIGHER BRIGHTNESS, EFFICIENCY, AND STABILITY TO DRIVE MARKET
                    TABLE 31 QUANTUM DOT LED PRODUCTS MARKET, BY VERTICAL, 2020–2023 (USD MILLION)
                    TABLE 32 QUANTUM DOT LED PRODUCTS MARKET, BY VERTICAL, 2024–2029 (USD MILLION)
    8.8 OTHER PRODUCTS 
           TABLE 33 QUANTUM DOT OTHER PRODUCTS MARKET, BY VERTICAL, 2024–2029 (USD MILLION)
 
9 QUANTUM DOT MARKET, BY PRODUCTION TECHNIQUE (Page No. - 114)
    9.1 INTRODUCTION 
    9.2 COLLOIDAL SYNTHESIS 
    9.3 PLASMA SYNTHESIS 
    9.4 FABRICATION 
           9.4.1 LITHOGRAPHY
                    9.4.1.1 Electron-beam lithography
                    9.4.1.2 Soft lithography
                    9.4.1.3 Stencil lithography
                    9.4.1.4 Nanolithography
                    9.4.1.5 Photopatternable array
    9.5 BIO-MOLECULAR SELF-ASSEMBLY 
    9.6 VIRAL ASSEMBLY 
    9.7 ELECTROCHEMICAL ASSEMBLY 
    9.8 BULK MANUFACTURING 
 
10 QUANTUM DOT MARKET, BY VERTICAL (Page No. - 118)
     10.1 INTRODUCTION 
             TABLE 34 QUANTUM DOT MARKET, BY VERTICAL, 2020–2023 (USD MILLION)
             FIGURE 45 CONSUMER VERTICAL TO DOMINATE QUANTUM DOT MARKET DURING FORECAST PERIOD
             TABLE 35 QUANTUM DOT MARKET, BY VERTICAL, 2024–2029 (USD MILLION)
     10.2 CONSUMER 
             10.2.1 GROWING DEMAND FOR HIGH-QUALITY DISPLAYS TO DRIVE MARKET
                        TABLE 36 CONSUMER VERTICAL: QUANTUM DOT MARKET, BY PRODUCT, 2020–2023 (USD MILLION)
                        TABLE 37 CONSUMER VERTICAL: QUANTUM DOT MARKET, BY PRODUCT, 2024–2029 (USD MILLION)
                        TABLE 38 CONSUMER VERTICAL: QUANTUM DOT MARKET, BY REGION, 2020–2023 (USD MILLION)
                        FIGURE 46 ASIA PACIFIC TO ACCOUNT FOR LARGEST MARKET SIZE FOR CONSUMER VERTICAL DURING FORECAST PERIOD
                        TABLE 39 CONSUMER VERTICAL: QUANTUM DOT MARKET, BY REGION, 2024–2029 (USD MILLION)
                        TABLE 40 NORTH AMERICA: QUANTUM DOT MARKET FOR CONSUMER VERTICAL, BY COUNTRY, 2020–2023 (USD MILLION)
                        TABLE 41 NORTH AMERICA: QUANTUM DOT MARKET FOR CONSUMER VERTICAL, BY COUNTRY, 2024–2029 (USD MILLION)
                        TABLE 42 EUROPE: QUANTUM DOT MARKET FOR CONSUMER VERTICAL, BY COUNTRY, 2020–2023 (USD MILLION)
                        TABLE 43 EUROPE: QUANTUM DOT MARKET FOR CONSUMER VERTICAL, BY COUNTRY, 2024–2029 (USD MILLION)
                        TABLE 44 ASIA PACIFIC: QUANTUM DOT MARKET FOR CONSUMER VERTICAL, BY COUNTRY, 2020–2023 (USD MILLION)
                        TABLE 45 ASIA PACIFIC: QUANTUM DOT MARKET FOR CONSUMER VERTICAL, BY COUNTRY, 2024–2029 (USD MILLION)
                        TABLE 46 ROW: QUANTUM DOT MARKET FOR CONSUMER VERTICAL, BY REGION, 2020–2023 (USD MILLION)
                        TABLE 47 ROW: QUANTUM DOT MARKET FOR CONSUMER VERTICAL, BY REGION, 2024–2029 (USD MILLION)
     10.3 COMMERCIAL 
             10.3.1 GROWING DEMAND FOR QUANTUM DOT-BASED KIOSKS AND INTERACTIVE SCREENS TO DRIVE MARKET
                        TABLE 48 COMMERCIAL VERTICAL: QUANTUM DOT MARKET, BY PRODUCT, 2020–2023 (USD MILLION)
                        TABLE 49 COMMERCIAL VERTICAL: QUANTUM DOT MARKET, BY PRODUCT, 2024–2029 (USD MILLION)
                        TABLE 50 COMMERCIAL VERTICAL: QUANTUM DOT MARKET, BY REGION, 2020–2023 (USD MILLION)
                        TABLE 51 COMMERCIAL VERTICAL: QUANTUM DOT MARKET, BY REGION, 2024–2029 (USD MILLION)
                        TABLE 52 NORTH AMERICA: QUANTUM DOT MARKET FOR COMMERCIAL VERTICAL, BY COUNTRY, 2020–2023 (USD MILLION)
                        TABLE 53 NORTH AMERICA: QUANTUM DOT MARKET FOR COMMERCIAL VERTICAL, BY COUNTRY, 2024–2029 (USD MILLION)
                        TABLE 54 EUROPE: QUANTUM DOT MARKET FOR COMMERCIAL VERTICAL, BY COUNTRY, 2020–2023 (USD MILLION)
                        TABLE 55 EUROPE: QUANTUM DOT MARKET FOR COMMERCIAL VERTICAL, BY COUNTRY, 2024–2029 (USD MILLION)
                        TABLE 56 ASIA PACIFIC: QUANTUM DOT MARKET FOR COMMERCIAL VERTICAL, BY COUNTRY, 2020–2023 (USD MILLION)
                        TABLE 57 ASIA PACIFIC: QUANTUM DOT MARKET FOR COMMERCIAL VERTICAL, BY COUNTRY, 2024–2029 (USD MILLION)
                        TABLE 58 ROW: QUANTUM DOT MARKET FOR COMMERCIAL VERTICAL, BY REGION, 2020–2023 (USD MILLION)
                        TABLE 59 ROW: QUANTUM DOT MARKET FOR COMMERCIAL VERTICAL, BY REGION, 2024–2029 (USD MILLION)
             10.3.2 RETAIL
             10.3.3 CORPORATE
             10.3.4 HOSPITALITY
     10.4 HEALTHCARE 
             10.4.1 INCREASING DEMAND FOR ENHANCED EFFICIENCY AND BRIGHTNESS TO DRIVE MARKET
                        TABLE 60 HEALTHCARE VERTICAL: QUANTUM DOT MARKET, BY PRODUCT, 2020–2023 (USD MILLION)
                        FIGURE 47 QD DISPLAYS TO ACCOUNT FOR LARGEST MARKET SIZE FOR HEALTHCARE VERTICAL DURING FORECAST PERIOD
                        TABLE 61 HEALTHCARE VERTICAL: QUANTUM DOT MARKET, BY PRODUCT, 2024–2029 (USD MILLION)
                        TABLE 62 HEALTHCARE VERTICAL: QUANTUM DOT MARKET, BY REGION, 2020–2023 (USD MILLION)
                        TABLE 63 HEALTHCARE VERTICAL: QUANTUM DOT MARKET, BY REGION, 2024–2029 (USD MILLION)
                        TABLE 64 NORTH AMERICA: QUANTUM DOT MARKET FOR HEALTHCARE VERTICAL, BY COUNTRY, 2020–2023 (USD MILLION)
                        TABLE 65 NORTH AMERICA: QUANTUM DOT MARKET FOR HEALTHCARE VERTICAL, BY COUNTRY, 2024–2029 (USD MILLION)
                        TABLE 66 EUROPE: QUANTUM DOT MARKET FOR HEALTHCARE VERTICAL, BY COUNTRY, 2020–2023 (USD MILLION)
                        TABLE 67 EUROPE: QUANTUM DOT MARKET FOR HEALTHCARE VERTICAL, BY COUNTRY, 2024–2029 (USD MILLION)
                        TABLE 68 ASIA PACIFIC: QUANTUM DOT MARKET FOR HEALTHCARE VERTICAL, BY COUNTRY, 2020–2023 (USD MILLION)
                        TABLE 69 ASIA PACIFIC: QUANTUM DOT MARKET FOR HEALTHCARE VERTICAL, BY COUNTRY, 2024–2029 (USD MILLION)
                        TABLE 70 ROW: QUANTUM DOT MARKET FOR HEALTHCARE VERTICAL, BY REGION, 2020–2023 (USD MILLION)
                        TABLE 71 ROW: QUANTUM DOT MARKET FOR HEALTHCARE VERTICAL, BY REGION, 2024–2029 (USD MILLION)
             10.4.2 BIOLOGICAL IMAGING
             10.4.3 CELLULAR LABELING
             10.4.4 DNA LABELING
             10.4.5 CANCER DIAGNOSIS
     10.5 DEFENSE 
             10.5.1 INCREASING DEMAND FOR HIGH PHOTOSTABILITY AND BRIGHTNESS TO DRIVE MARKET
                        TABLE 72 DEFENSE VERTICAL: QUANTUM DOT MARKET, BY PRODUCT, 2020–2023 (USD MILLION)
                        TABLE 73 DEFENSE VERTICAL: QUANTUM DOT MARKET, BY PRODUCT, 2024–2029 (USD MILLION)
                        TABLE 74 DEFENSE VERTICAL: QUANTUM DOT MARKET, BY REGION, 2020–2023 (USD MILLION)
                        TABLE 75 DEFENSE VERTICAL: QUANTUM DOT MARKET, BY REGION, 2024–2029 (USD MILLION)
                        TABLE 76 NORTH AMERICA: QUANTUM DOT MARKET FOR DEFENSE VERTICAL, BY COUNTRY, 2020–2023 (USD MILLION)
                        TABLE 77 NORTH AMERICA: QUANTUM DOT MARKET FOR DEFENSE VERTICAL, BY COUNTRY, 2024–2029 (USD MILLION)
                        TABLE 78 EUROPE: QUANTUM DOT MARKET FOR DEFENSE VERTICAL, BY COUNTRY, 2020–2023 (USD MILLION)
                        TABLE 79 EUROPE: QUANTUM DOT MARKET FOR DEFENSE VERTICAL, BY COUNTRY, 2024–2029 (USD MILLION)
                        TABLE 80 ASIA PACIFIC: QUANTUM DOT MARKET FOR DEFENSE VERTICAL, BY COUNTRY, 2020–2023 (USD MILLION)
                        TABLE 81 ASIA PACIFIC: QUANTUM DOT MARKET FOR DEFENSE VERTICAL, BY COUNTRY, 2024–2029 (USD MILLION)
                        TABLE 82 ROW: QUANTUM DOT MARKET FOR DEFENSE VERTICAL, BY REGION, 2020–2023 (USD MILLION)
                        TABLE 83 ROW: QUANTUM DOT MARKET FOR DEFENSE VERTICAL, BY REGION, 2024–2029 (USD MILLION)
     10.6 TELECOMMUNICATIONS 
             10.6.1 ONGOING RESEARCH TOWARD INTEGRATION OF QUANTUM DOTS IN TELECOMMUNICATIONS TO DRIVE MARKET
                        TABLE 84 TELECOMMUNICATIONS VERTICAL: QUANTUM DOT MARKET, BY PRODUCT, 2020–2023 (USD MILLION)
                        TABLE 85 TELECOMMUNICATIONS VERTICAL: QUANTUM DOT MARKET, BY PRODUCT, 2024–2029 (USD MILLION)
                        TABLE 86 TELECOMMUNICATIONS VERTICAL: QUANTUM DOT MARKET, BY REGION, 2020–2023 (USD MILLION)
                        TABLE 87 TELECOMMUNICATIONS VERTICAL: QUANTUM DOT MARKET, BY REGION, 2024–2029 (USD MILLION)
                        TABLE 88 NORTH AMERICA: QUANTUM DOT MARKET FOR TELECOMMUNICATIONS VERTICAL, BY COUNTRY, 2020–2023 (USD MILLION)
                        TABLE 89 NORTH AMERICA: QUANTUM DOT MARKET FOR TELECOMMUNICATIONS VERTICAL, BY COUNTRY, 2024–2029 (USD MILLION)
                        TABLE 90 EUROPE: QUANTUM DOT MARKET FOR TELECOMMUNICATIONS VERTICAL, BY COUNTRY, 2020–2023 (USD MILLION)
                        TABLE 91 EUROPE: QUANTUM DOT MARKET FOR TELECOMMUNICATIONS VERTICAL, BY COUNTRY, 2024–2029 (USD MILLION)
                        TABLE 92 ASIA PACIFIC: QUANTUM DOT MARKET FOR TELECOMMUNICATIONS VERTICAL, BY COUNTRY, 2020–2023 (USD MILLION)
                        TABLE 93 ASIA PACIFIC: QUANTUM DOT MARKET FOR TELECOMMUNICATIONS VERTICAL, BY COUNTRY, 2024–2029 (USD MILLION)
                        TABLE 94 ROW: QUANTUM DOT MARKET FOR TELECOMMUNICATIONS VERTICAL, BY REGION, 2020–2023 (USD MILLION)
                        TABLE 95 ROW: QUANTUM DOT MARKET FOR TELECOMMUNICATIONS VERTICAL, BY REGION, 2024–2029 (USD MILLION)
     10.7 OTHER VERTICALS 
             10.7.1 GROWING INTEGRATION OF QUANTUM DOT DISPLAYS AND LED PRODUCTS TO DRIVE MARKET
                        TABLE 96 OTHER VERTICALS: QUANTUM DOT MARKET, BY PRODUCT, 2020–2023 (USD MILLION)
                        TABLE 97 OTHER VERTICALS: QUANTUM DOT MARKET, BY PRODUCT, 2024–2029 (USD MILLION)
                        TABLE 98 OTHER VERTICALS: QUANTUM DOT MARKET, BY REGION, 2020–2023 (USD MILLION)
                        TABLE 99 OTHER VERTICALS: QUANTUM DOT MARKET, BY REGION, 2024–2029 (USD MILLION)
                        TABLE 100 NORTH AMERICA: QUANTUM DOT MARKET FOR OTHER VERTICALS, BY COUNTRY, 2020–2023 (USD MILLION)
                        TABLE 101 NORTH AMERICA: QUANTUM DOT MARKET FOR OTHER VERTICALS, BY COUNTRY, 2024–2029 (USD MILLION)
                        TABLE 102 EUROPE: QUANTUM DOT MARKET FOR OTHER VERTICALS, BY COUNTRY, 2020–2023 (USD MILLION)
                        TABLE 103 EUROPE: QUANTUM DOT MARKET FOR OTHER VERTICALS, BY COUNTRY, 2024–2029 (USD MILLION)
                        TABLE 104 ASIA PACIFIC: QUANTUM DOT MARKET FOR OTHER VERTICALS, BY COUNTRY, 2020–2023 (USD MILLION)
                        TABLE 105 ASIA PACIFIC: QUANTUM DOT MARKET FOR OTHER VERTICALS, BY COUNTRY, 2024–2029 (USD MILLION)
                        TABLE 106 ROW: QUANTUM DOT MARKET FOR OTHER VERTICALS, BY REGION, 2020–2023 (USD MILLION)
                        TABLE 107 ROW: QUANTUM DOT MARKET FOR OTHER VERTICALS, BY REGION, 2024–2029 (USD MILLION)
             10.7.2 MANUFACTURING
             10.7.3 TRANSPORTATION
             10.7.4 EDUCATION
             10.7.5 SPORTS & ENTERTAINMENT
             10.7.6 AGRICULTURE/HORTICULTURE LIGHTING
 
11 QUANTUM DOT MARKET, BY REGION (Page No. - 151)
     11.1 INTRODUCTION 
             FIGURE 48 CANADIAN QUANTUM DOT MARKET TO GROW AT HIGHEST CAGR DURING FORECAST PERIOD
             TABLE 108 QUANTUM DOT MARKET, BY REGION, 2020–2023 (USD MILLION)
             TABLE 109 QUANTUM DOT MARKET, BY REGION, 2024–2029 (USD MILLION)
     11.2 NORTH AMERICA 
             FIGURE 49 NORTH AMERICA: QUANTUM DOT MARKET SNAPSHOT
             TABLE 110 NORTH AMERICA: QUANTUM DOT MARKET, BY COUNTRY, 2020–2023 (USD MILLION)
             TABLE 111 NORTH AMERICA: QUANTUM DOT MARKET, BY COUNTRY, 2024–2029 (USD MILLION)
             TABLE 112 NORTH AMERICA: QUANTUM DOT MARKET, BY VERTICAL, 2020–2023 (USD MILLION)
             TABLE 113 NORTH AMERICA: QUANTUM DOT MARKET, BY VERTICAL, 2024–2029 (USD MILLION)
             11.2.1 RECESSION IMPACT
             11.2.2 US
                        11.2.2.1 Increasing awareness and integration of quantum dot technology to drive market
             11.2.3 CANADA
                        11.2.3.1 Presence of developers and manufacturers to drive market
             11.2.4 MEXICO
                        11.2.4.1 Growing demand for quantum dots to drive growth
     11.3 EUROPE 
             FIGURE 50 EUROPE: QUANTUM DOT MARKET SNAPSHOT
             TABLE 114 EUROPE: QUANTUM DOT MARKET, BY COUNTRY, 2020–2023 (USD MILLION)
             TABLE 115 EUROPE: QUANTUM DOT MARKET, BY COUNTRY, 2024–2029 (USD MILLION)
             TABLE 116 EUROPE: QUANTUM DOT MARKET, BY VERTICAL, 2020–2023 (USD MILLION)
             TABLE 117 EUROPE: QUANTUM DOT MARKET, BY VERTICAL, 2024–2029 (USD MILLION)
             11.3.1 RECESSION IMPACT
             11.3.2 UK
                        11.3.2.1 Presence of major companies to drive market
             11.3.3 GERMANY
                        11.3.3.1 Increasing development of public infrastructure and healthcare industry to drive growth
             11.3.4 FRANCE
                        11.3.4.1 Growing integration of display and digital signage products to drive market
             11.3.5 ITALY
                        11.3.5.1 Rising demand for quantum dot displays to drive market
             11.3.6 SPAIN
                        11.3.6.1 Growing demand for signage products to drive market
             11.3.7 REST OF EUROPE
     11.4 ASIA PACIFIC 
             FIGURE 51 ASIA PACIFIC: QUANTUM DOT MARKET SNAPSHOT
             TABLE 118 ASIA PACIFIC: QUANTUM DOT MARKET, BY COUNTRY, 2020–2023 (USD MILLION)
             TABLE 119 ASIA PACIFIC: QUANTUM DOT MARKET, BY COUNTRY, 2024–2029 (USD MILLION)
             TABLE 120 ASIA PACIFIC: QUANTUM DOT MARKET, BY VERTICAL, 2020–2023 (USD MILLION)
             TABLE 121 ASIA PACIFIC: QUANTUM DOT MARKET, BY VERTICAL, 2024–2029 (USD MILLION)
             11.4.1 RECESSION IMPACT
             11.4.2 CHINA
                        11.4.2.1 Advancements in display market to drive growth
             11.4.3 JAPAN
                        11.4.3.1 Increasing deployment of displays and quantum dot lasers for telecommunication to drive market
             11.4.4 SOUTH KOREA
                        11.4.4.1 Presence of several established display manufacturers to drive market
             11.4.5 INDIA
                        11.4.5.1 Rising demand for displays to drive growth
             11.4.6 REST OF ASIA PACIFIC
     11.5 REST OF THE WORLD (ROW) 
             TABLE 122 ROW: QUANTUM DOT MARKET, BY REGION, 2020–2023 (USD MILLION)
             TABLE 123 ROW: QUANTUM DOT MARKET, BY REGION, 2024–2029 (USD MILLION)
             TABLE 124 ROW: QUANTUM DOT MARKET, BY VERTICAL, 2020–2023 (USD MILLION)
             TABLE 125 ROW: QUANTUM DOT MARKET, BY VERTICAL, 2024–2029 (USD MILLION)
             11.5.1 RECESSION IMPACT
             11.5.2 MIDDLE EAST & AFRICA
                        11.5.2.1 Growing developments to expand in region to drive market
                                     11.5.2.1.1 GCC Countries
                                                    11.5.2.1.1.1 Increasing market expansions by quantum dot display manufacturers to drive market
                                     11.5.2.1.2 Rest of Middle East & Africa
                                                    11.5.2.1.2.1 Expanding retail, corporate, transportation, and commercial sectors to drive market
                                                                     TABLE 126 MIDDLE EAST & AFRICA: QUANTUM DOT MARKET, BY REGION, 2020–2023 (USD MILLION)
                                                                     TABLE 127 MIDDLE EAST & AFRICA: QUANTUM DOT MARKET, BY REGION, 2024–2029 (USD MILLION)
             11.5.3 SOUTH AMERICA
                        11.5.3.1 Increasing demand for sensors, transistors, and lasers to drive market
 
12 COMPETITIVE LANDSCAPE (Page No. - 172)
     12.1 INTRODUCTION 
     12.2 MARKET EVALUATION FRAMEWORK 
             TABLE 128 OVERVIEW OF STRATEGIES DEPLOYED BY KEY QUANTUM DOT PLAYERS
             FIGURE 52 COMPANIES ADOPTED COLLABORATIONS, AGREEMENTS, PRODUCT LAUNCHES, AND ACQUISITIONS AS KEY GROWTH STRATEGIES, 2020–2024
             12.2.1 ORGANIC/INORGANIC GROWTH STRATEGIES
             12.2.2 PRODUCT PORTFOLIO
             12.2.3 GEOGRAPHIC PRESENCE
             12.2.4 MANUFACTURING FOOTPRINT
     12.3 MARKET SHARE ANALYSIS, 2023 
             TABLE 129 MARKET SHARE ANALYSIS OF KEY COMPANIES IN QUANTUM DOT MARKET, 2023
     12.4 COMPANY VALUATION AND FINANCIAL METRICS 
             FIGURE 53 COMPANY VALUATION, 2024 (USD BILLION)
             FIGURE 54 FINANCIAL METRICS (EV/EBITDA), 2024
     12.5 BRAND/PRODUCT COMPARISON 
             FIGURE 55 BRAND/PRODUCT COMPARISON
     12.6 HISTORICAL REVENUE ANALYSIS OF MAJOR MARKET PLAYERS 
     12.7 HISTORICAL REVENUE ANALYSIS, 2019–2023 
             FIGURE 56 HISTORICAL REVENUE ANALYSIS OF MAJOR COMPANIES IN QUANTUM DOT MARKET, 2019–2023 (USD BILLION)
     12.8 COMPANY EVALUATION MATRIX 
             12.8.1 STARS
             12.8.2 EMERGING LEADERS
             12.8.3 PERVASIVE PLAYERS
             12.8.4 PARTICIPANTS
                        FIGURE 57 QUANTUM DOT MARKET (GLOBAL): COMPANY EVALUATION MATRIX, 2023
     12.9 STARTUP/SME EVALUATION MATRIX 
             12.9.1 PROGRESSIVE COMPANIES
             12.9.2 RESPONSIVE COMPANIES
             12.9.3 DYNAMIC COMPANIES
             12.9.4 STARTING BLOCKS
                        FIGURE 58 QUANTUM DOT MARKET (GLOBAL): STARTUP/SME EVALUATION MATRIX, 2023
             12.9.5 COMPETITIVE BENCHMARKING
                        TABLE 130 QUANTUM DOT MARKET: DETAILED LIST OF KEY STARTUPS/SMES
                        TABLE 131 COMPETITIVE BENCHMARKING FOR STARTUPS/SMES: MATERIAL
                        TABLE 132 COMPETITIVE BENCHMARKING FOR STARTUPS/SMES: PRODUCT
                        TABLE 133 COMPETITIVE BENCHMARKING FOR STARTUPS/SMES: VERTICAL
                        TABLE 134 COMPETITIVE BENCHMARKING OF STARTUP/SMES: REGION
             12.9.6 COMPANY FOOTPRINT
                        12.9.6.1 Company product footprint
                                     TABLE 135 COMPANY MATERIAL TYPE FOOTPRINT
                                     TABLE 136 COMPANY PRODUCT FOOTPRINT
                                     TABLE 137 COMPANY VERTICAL FOOTPRINT
                                     TABLE 138 COMPANY REGION FOOTPRINT
     12.1 COMPETITIVE SITUATIONS AND TRENDS 
             12.10.1 PRODUCT LAUNCHES
                        TABLE 139 QUANTUM DOT MARKET: PRODUCT LAUNCHES, NOVEMBER 2020–APRIL 2024
             12.10.2 DEALS
                        TABLE 140 QUANTUM DOT MARKET: DEALS, AUGUST 2020–JANUARY 2024
 
13 COMPANY PROFILES (Page No. - 195)
     13.1 INTRODUCTION 
(Business Overview, Products/Services/Solutions Offered, MnM View, Key Strengths and Right to Win, Strategic Choices Made, Weaknesses and Competitive Threats, Recent Developments)*  
     13.2 KEY PLAYERS 
             13.2.1 SAMSUNG DISPLAY
                        TABLE 141 SAMSUNG DISPLAY: COMPANY OVERVIEW
                        FIGURE 59 SAMSUNG ELECTRONICS: COMPANY SNAPSHOT
                        TABLE 142 SAMSUNG DISPLAY: PRODUCTS OFFERED
                        TABLE 143 SAMSUNG DISPLAY: PRODUCT LAUNCHES
             13.2.2 LG DISPLAY CO., LTD.
                        TABLE 144 LG DISPLAY CO., LTD.: COMPANY OVERVIEW
                        FIGURE 60 LG DISPLAY: COMPANY SNAPSHOT
                        TABLE 145 LG DISPLAY CO., LTD.: PRODUCTS OFFERED
                        TABLE 146 LG DISPLAY CO., LTD.: PRODUCT LAUNCHES
             13.2.3 BOE TECHNOLOGY GROUP CO., LTD.
                        TABLE 147 BOE TECHNOLOGY GROUP CO., LTD.: COMPANY OVERVIEW
                        FIGURE 61 BOE TECHNOLOGY GROUP CO., LTD.: COMPANY SNAPSHOT
                        TABLE 148 BOE TECHNOLOGY GROUP CO., LTD.: PRODUCTS OFFERED
                        TABLE 149 BOE TECHNOLOGY GROUP CO., LTD.: PRODUCT LAUNCHES
             13.2.4 AUO CORPORATION
                        TABLE 150 AUO CORPORATION: COMPANY OVERVIEW
                        FIGURE 62 AUO CORPORATION: COMPANY SNAPSHOT
                        TABLE 151 AUO CORPORATION: PRODUCTS OFFERED
             13.2.5 TCL CHINA STAR OPTOELECTRONICS TECHNOLOGY CO., LTD.
                        TABLE 152 TCL CHINA STAR OPTOELECTRONICS TECHNOLOGY CO., LTD.: COMPANY OVERVIEW
                        TABLE 153 TCL CHINA STAR OPTOELECTRONICS TECHNOLOGY CO., LTD.: PRODUCTS OFFERED
             13.2.6 SHOEI CHEMICAL, INC. (NANOSYS, INC.)
                        TABLE 154 SHOEI CHEMICAL, INC.: COMPANY OVERVIEW
                        TABLE 155 SHOEI CHEMICAL, INC.: PRODUCTS OFFERED
                        TABLE 156 SHOEI CHEMICAL, INC.: DEALS
             13.2.7 AMERICAN ELEMENTS
                        TABLE 157 AMERICAN ELEMENTS: COMPANY OVERVIEW
                        TABLE 158 AMERICAN ELEMENTS: PRODUCTS OFFERED
                        TABLE 159 AMERICAN ELEMENTS: PRODUCT LAUNCHES
             13.2.8 HANSOLCHEMICAL
                        TABLE 160 HANSOLCHEMICAL: COMPANY OVERVIEW
                        FIGURE 63 HANSOLCHEMICAL: COMPANY SNAPSHOT
                        TABLE 161 HANSOLCHEMICAL: PRODUCTS OFFERED
             13.2.9 NANOCO GROUP PLC
                        TABLE 162 NANOCO GROUP PLC: COMPANY OVERVIEW
                        FIGURE 64 NANOCO GROUP PLC: COMPANY SNAPSHOT
                        TABLE 163 NANOCO GROUP PLC: PRODUCTS OFFERED
                        TABLE 164 NANOCO GROUP PLC: DEALS
             13.2.10 AVANTAMA AG
                        TABLE 165 AVANTAMA AG: COMPANY OVERVIEW
                        TABLE 166 AVANTAMA AG: PRODUCTS OFFERED
             13.2.11 NNCRYSTAL US CORPORATION
                        TABLE 167 NNCRYSTAL US CORPORATION: COMPANY OVERVIEW
                        TABLE 168 NNCRYSTAL US CORPORATION: PRODUCTS OFFERED
             13.2.12 OCEAN NANOTECH
                        TABLE 169 OCEAN NANOTECH.: COMPANY OVERVIEW
                        TABLE 170 OCEAN NANOTECH: PRODUCTS OFFERED
             13.2.13 QUANTUM MATERIALS CORP
                        TABLE 171 QUANTUM MATERIALS CORP: COMPANY OVERVIEW
                        TABLE 172 QUANTUM MATERIALS CORP: PRODUCTS OFFERED
             13.2.14 QUANTUM SOLUTIONS
                        TABLE 173 QUANTUM SOLUTIONS: COMPANY OVERVIEW
                        TABLE 174 QUANTUM SOLUTIONS: PRODUCTS OFFERED
                        TABLE 175 QUANTUM SOLUTIONS: PRODUCT LAUNCHES
                        TABLE 176 QUANTUM SOLUTIONS: DEALS
             13.2.15 MERCK KGAA
                        TABLE 177 MERCK KGAA: COMPANY OVERVIEW
                        FIGURE 65 MERCK KGAA: COMPANY SNAPSHOT
                        TABLE 178 MERCK KGAA: PRODUCTS OFFERED
*Business Overview, Products/Services/Solutions Offered, MnM View, Key Strengths and Right to Win, Strategic Choices Made, Weaknesses and Competitive Threats, Recent Developments might not be captured in case of unlisted companies.  
     13.3 OTHER PLAYERS 
             13.3.1 STREM
             13.3.2 SUZHOU XINGSHUO NANOTECH CO. LTD.
             13.3.3 UBIQD, INC.
             13.3.4 NANOSHEL LLC
             13.3.5 NANORH
             13.3.6 ACS MATERIAL
             13.3.7 NANOOPTICAL MATERIALS INC
             13.3.8 NANOCHEMAZONE
             13.3.9 THE DOW CHEMICAL COMPANY
             13.3.10 QUSTOMDOT BV
             13.3.11 DUXERIALS EUROPE B.V.
             13.3.12 NANOLUMI PTE. LTD.
             13.3.13 RINA TECHNOLOGY CO., LTD.
             13.3.14 WAH HONG INDUSTRIAL CORP.
             13.3.15 EFUN TECHNOLOGY
 
14 APPENDIX (Page No. - 242)
     14.1 INSIGHTS OF INDUSTRY EXPERTS 
     14.2 DISCUSSION GUIDE 
     14.3 KNOWLEDGESTORE: MARKETSANDMARKETS’ SUBSCRIPTION PORTAL 
     14.4 CUSTOMIZATION OPTIONS 
     14.5 RELATED REPORTS 
     14.6 AUTHOR DETAILS 


The research study involved 4 major activities in estimating the size of the quantum dot market. Exhaustive secondary research has been done to collect important information about the market and peer markets. The validation of these findings, assumptions, and sizing with the help of primary research with industry experts across the supply chain has been the next step. Both top-down and bottom-up approaches have been used to estimate the market size. Post which the market breakdown and data triangulation have been adopted to estimate the market sizes of segments and sub-segments.

Secondary Research

In the secondary research process, sources such as annual reports, press releases, and investor presentations of companies, white papers, and articles by recognized authors were referred to. Secondary research was mainly done to obtain key information about the industry’s supply chain, the value chain of the market, the pool of key market players, market segmentation according to industry trends, region, and developments from both, market and technology perspectives.

Primary Research

In primary research, various primary sources from the supply and demand sides were interviewed to obtain qualitative and quantitative insights required for this report. Primary sources from the supply side included experts such as CEOs, vice presidents, marketing directors, application developers, technology & innovation directors, application users, and related executives from multiple key companies and organizations operating in the quantum dot market ecosystem.

Quantum Dot Market
 Size, and Share

To know about the assumptions considered for the study, download the pdf brochure

Market Size Estimation

In the market engineering process, the top-down and bottom-up approaches were used along with multiple data triangulation methods to estimate and validate the size of the quantum dot market and other dependent submarkets. Key market players were identified through secondary research, and their market share in the targeted regions was determined with the help of primary and secondary research. This entire research methodology included the study of annual and financial presentations of the top market players, as well as interviews with experts for key insights (quantitative and qualitative). The percentage share, splits, and breakdowns were determined using secondary sources and verified through primary research. All the possible parameters that affect the quantum dot market were verified in detail with the help of primary sources and analyzed to obtain quantitative and qualitative data. This data was supplemented with detailed inputs and analysis from MarketsandMarkets and presented in the report.

In the market engineering process, both top-down and bottom-up approaches have been used along with data triangulation methods to estimate and validate the size of the quantum dot market and other dependent submarkets. The research methodology used to estimate the market sizes includes the following:

  • Analyzing the size of the global quantum dot market by identifying segment and subsegment revenue related to the market
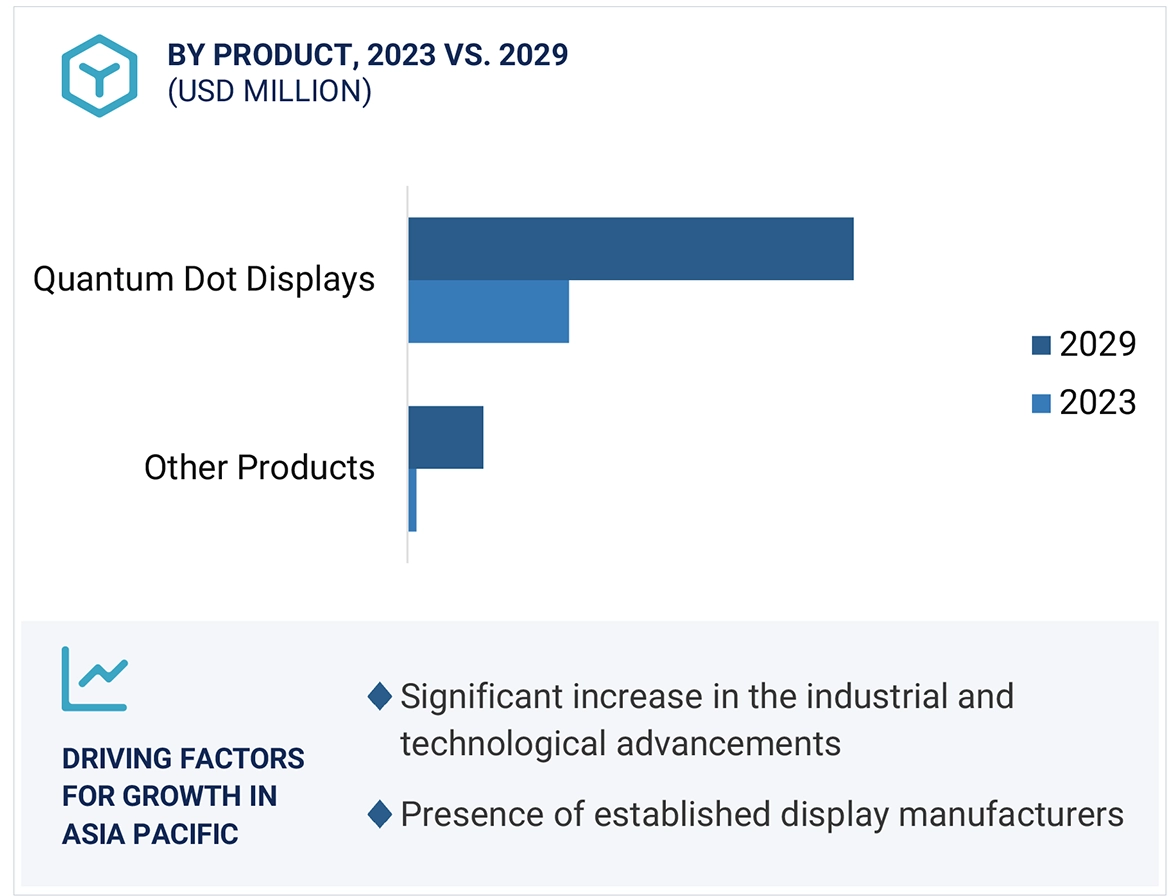
  • Identifying the total number of quantum dot displays shipped globally, which includes various types of displays
  • Estimating the ASP of quantum dot displays
  • Estimating the size of the quantum dot display market (quantum dot display shipment * ASP of quantum dot displays)
  • Estimating the market size of other quantum dot products
  • Estimating the quantum dot market size (summation of quantum dot display market and market of other quantum dot products)
  • Identifying the upcoming projects related to quantum dots by various companies in different regions and forecasting the market size based on these developments and other important parameters.

Market Size Estimation Methodology-Bottom-up Approach

Quantum Dot Market
 Size, and Bottom-up Approach

Market Size Estimation Methodology-Top-Down Approach

Quantum Dot Market
 Size, and Top-Down Approach

Data Triangulation

After arriving at the overall market size, the overall quantum dot market was divided into several segments and subsegments. To complete the overall market engineering process and arrive at the exact statistics for all segments and subsegments, the data triangulation and market breakdown procedures were used, wherever applicable. The data was triangulated by studying various factors and trends from the demand and supply sides. Along with data triangulation and market breakdown, the market size was validated by the top-down and bottom-up approaches.

Market Definition

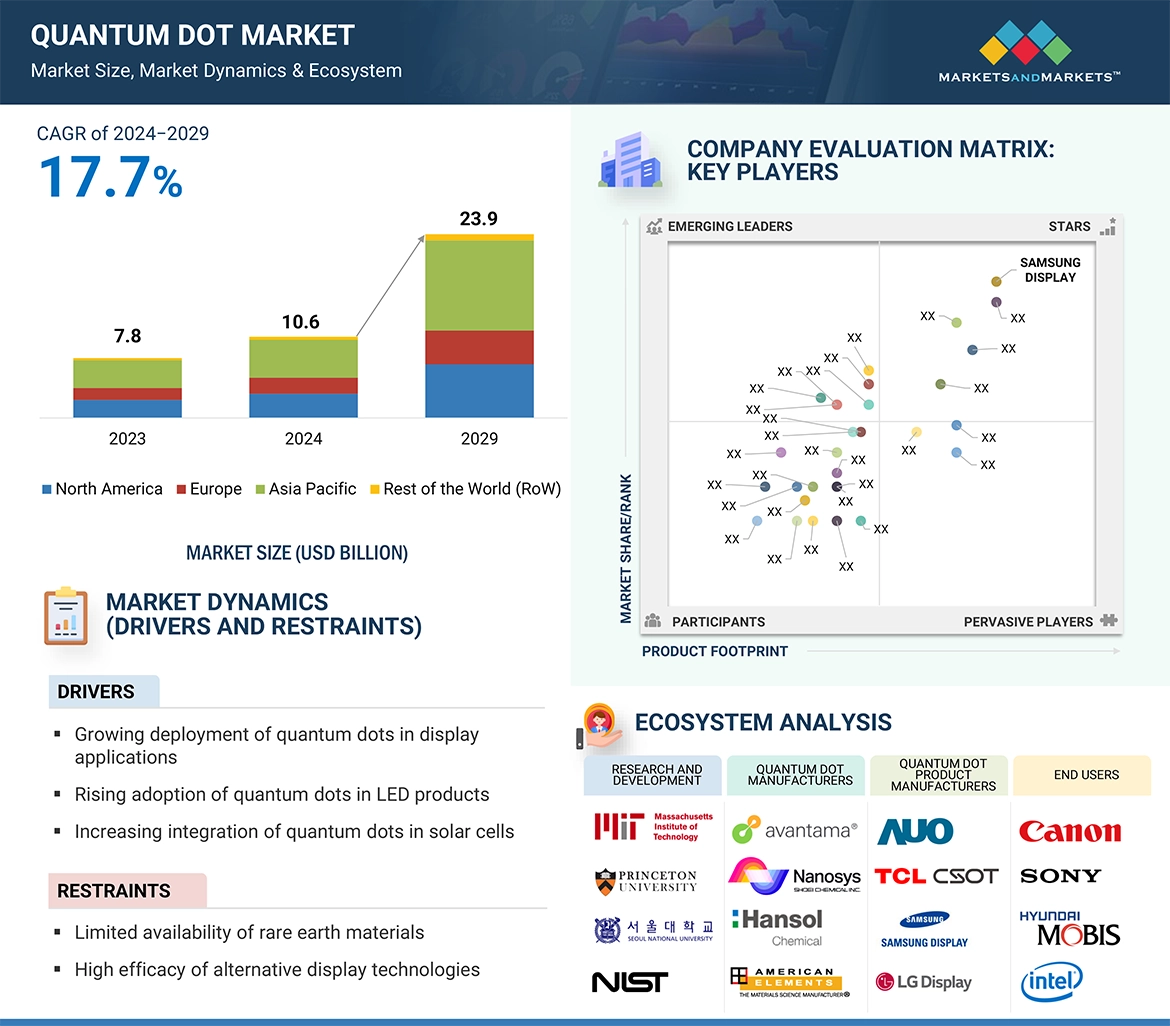
Quantum dots (QDs) are semiconductor nanocrystals ranging in diameter from 2 to 10 nanometers (nm). When exposed to UV light, they emit specific colors determined by their nanoparticle size. Quantum dots are poised to transform display technologies by offering advantages such as high brightness, reliability, cost-effectiveness, and low power consumption. The market for quantum dots is expanding due to rising demand in display devices, their superiority over conventional displays, and their versatile applications across various industries. Manufacturers of quantum dot and related products are presented with numerous growth opportunities, driven by increased adoption in LEDs, escalating demand for large and high-resolution displays, and the expanding utilization of quantum dots in sectors like defense, aerospace, and agriculture.
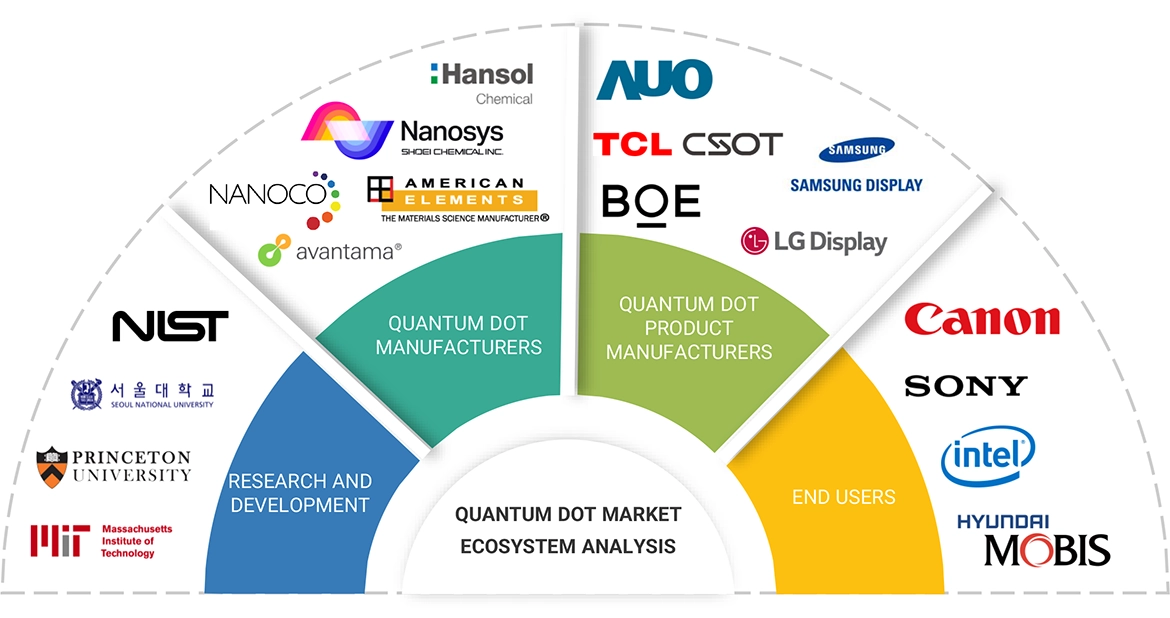
Stakeholders

  • Raw material and manufacturing equipment suppliers
  • Integrated device manufacturers (IDMs)
  • Component manufacturers
  • Original device manufacturers (ODMs)
  • Original equipment manufacturers  (OEMs)
  • ODM and OEM technology solution providers
  • Assembly, testing, and packaging vendors
  • Distributors and traders
  • Research organizations
  • Organizations, forums, alliances, and associations
  • Governments, Financial Institutions, and Regulatory Bodies

The main objectives of this study are as follows:

  • To define, analyze and forecast the quantum dot market size, by material, product, display, and vertical in terms of value
  • To define, analyze and forecast the quantum dot market size, in terms of volume.
  • To forecast the market size for various segments with respect to four main regions, namely, North America, Europe, Asia Pacific and Rest of the World (RoW)
  • To provide detailed information regarding the major drivers, restraints, opportunities, and challenges influencing the growth of the quantum dot market
  • To study the complete supply chain and related industry segments for the quantum dot market
  • To strategically analyze the micromarkets1 with respect to individual growth trends, prospects, and contributions to the total market
  • To analyze the value chain, market ecosystem; trends/disruptions impacting customer’s business; technology analysis; pricing analysis; Porter’s five forces model; key stakeholders & buying criteria; case study analysis; trade analysis; patent analysis; key conferences & events, 2024–2025; regulations related to the quantum dot market; and investment and funding scenario.
  • To analyze opportunities in the market for various stakeholders by identifying the high-growth segments of the market.
  • To strategically profile the key players and comprehensively analyze their market position in terms of ranking, core competencies2, company valuation and financial metrics and product/brand comparison; along with detailing the competitive landscape for the market leaders.
  • To analyze competitive developments such as product launches, agreements, collaborations and acquisitions and research and development (R&D) activities carried out by players in the quantum dot market.

Customizations Options:

With the given market data, MarketsandMarkets offers customizations according to the company’s specific needs. The following customization options are available for the report:

Product Analysis

  • Detailed analysis of quantum dot products for consumer, commercial, healthcare, defense, telecommunications and other verticals

Company Information

  • Detailed analysis and profiling of additional market players (up to 5)

Geographic Information

  • Detailed analysis of additional countries (up to 5)
Custom Market Research Services

We will customize the research for you, in case the report listed above does not meet with your exact requirements. Our custom research will comprehensively cover the business information you require to help you arrive at strategic and profitable business decisions.

Request Customization

Instant Answers with GPT - Ask Now!

Ask real questions. Get complete answers !
Report Code
SE 3146
Published ON
May, 2024
Choose License Type
BUY NOW
  • SHARE
X
Request Customization
Speak to Analyst
Speak to Analyst
OR FACE-TO-FACE MEETING
PERSONALIZE THIS RESEARCH
  • Triangulate with your Own Data
  • Get Data as per your Format and Definition
  • Gain a Deeper Dive on a Specific Application, Geography, Customer or Competitor
  • Any level of Personalization
REQUEST A FREE CUSTOMIZATION
LET US HELP YOU!
  • What are the Known and Unknown Adjacencies Impacting the Quantum Dot Market
  • What will your New Revenue Sources be?
  • Who will be your Top Customer; what will make them switch?
  • Defend your Market Share or Win Competitors
  • Get a Scorecard for Target Partners
CUSTOMIZED WORKSHOP REQUEST
+1-888-600-6441
  • Call Us
  • +1-888-600-6441 (Corporate office hours)
  • +1-888-600-6441 (US/Can toll free)
  • +44-800-368-9399 (UK office hours)
CONNECT WITH US
ABOUT TRUST ONLINE
©2024 MarketsandMarkets Research Private Ltd. All rights reserved
DMCA.com Protection Status Website Feedback