
Real-time Location Systems (RTLS) Market Size, Share & Trends

Real-time Location Systems (RTLS) Market by Offering (RTLS Tags/Badges, Readers/Trackers/Access Points), Technology (RFID, Wi-Fi, UWB, BLE, Infrared, Ultrasound, GPS, Zigbee), Application (Inventory Tracking, Personnel Tracking) - Global Forecast to 2030


REAL-TIME LOCATION SYSTEMS (RTLS) MARKET OVERVIEW
Source: Secondary Research, Interviews with Experts, MarketsandMarkets Analysis
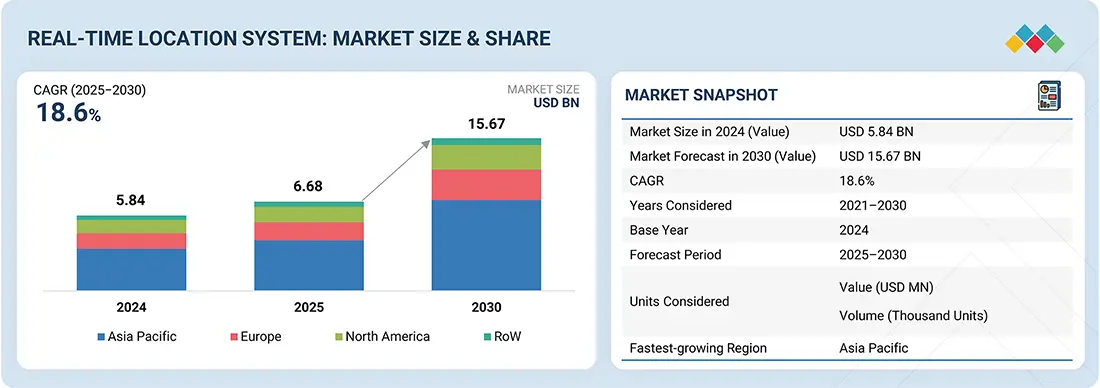
The global real-time location system market is expected to rise from USD 6.68 billion in 2025 to USD 15.67 billion by 2030, at a CAGR of 18.6%. Market growth is expected to be driven by developing cost-effective, application-specific RTLS solutions, particularly from agile startups, and the increasing use of RTLS tags for asset tracking to maximize return on investment. However, the industry faces notable challenges, including escalating concerns around data security and privacy and the significant capital and maintenance costs associated with deployment. These factors may pose barriers to adoption despite the substantial operational benefits offered by RTLS technology.
Real-time Location Systems (RTLS) Market Size & Forecast
The increasing digitalization of industries and the expansion of smart manufacturing and IoT ecosystems are shaping key Real-Time Location System Market trends. Organizations are increasingly leveraging RTLS solutions for asset tracking, workforce management, and supply chain optimization, which is contributing to the growing Real-Time Location System Market share across multiple industry verticals. Additionally, healthcare facilities are widely adopting RTLS technologies to monitor medical equipment and ensure patient safety, further accelerating Real-Time Location System Market growth. Continuous innovation from technology providers and the emergence of cost-effective RTLS solutions are strengthening the RTLS Industry, while increasing demand for automation and operational efficiency continues to drive the RTLS Market worldwide.
KEY TAKEAWAYS
-
BY OFFERINGThe hardware segment dominates the overall market, driven by the adoption of tags, sensors, and readers forming the backbone of RTLS deployments.
-
BY TECHNOLOGYThe BLE segment is expected to witness significant growth, driven by its low power consumption, cost efficiency, and widespread compatibility with mobile devices.
-
BY APPLICATIONPersonnel locating and monitoring are critical applications in healthcare, manufacturing, and hazardous environments.
-
BY VERTICALThe healthcare segment dominates the market with strong adoption for asset tracking, patient safety, and workflow optimization.
-
BY REGIONAsia Pacific is projected to record the highest CAGR of 23.4% in the real-time location system market. This rapid expansion is driven by the increasing adoption of RTLS across manufacturing, logistics, and healthcare sectors, along with rising demand for automation, asset tracking, and workflow optimization. Government initiatives further support growth by promoting Industry 4.0, smart factories, and digital infrastructure development in key markets such as China, Japan, South Korea, and India.
-
COMPETITIVE LANDSCAPELeading players such as Securitas AB (Sweden), Zebra Technologies Corp. (US), Impinj, Inc. (US), Siemens (Germany), and CenTrak, Inc. (US) are adopting both organic and inorganic growth strategies, including product innovation, strategic partnerships, and capacity expansion, to strengthen their market presence.
The real-time location system (RTLS) industry is projected to grow steadily over the next decade, driven by rising demand for automation, asset visibility, and operational efficiency across industries. Adoption in manufacturing, logistics, healthcare, and large facilities is accelerating, positioning RTLS as a cornerstone technology for enabling smart operations, enhancing workflow optimization, and supporting digital transformation goals across sectors.
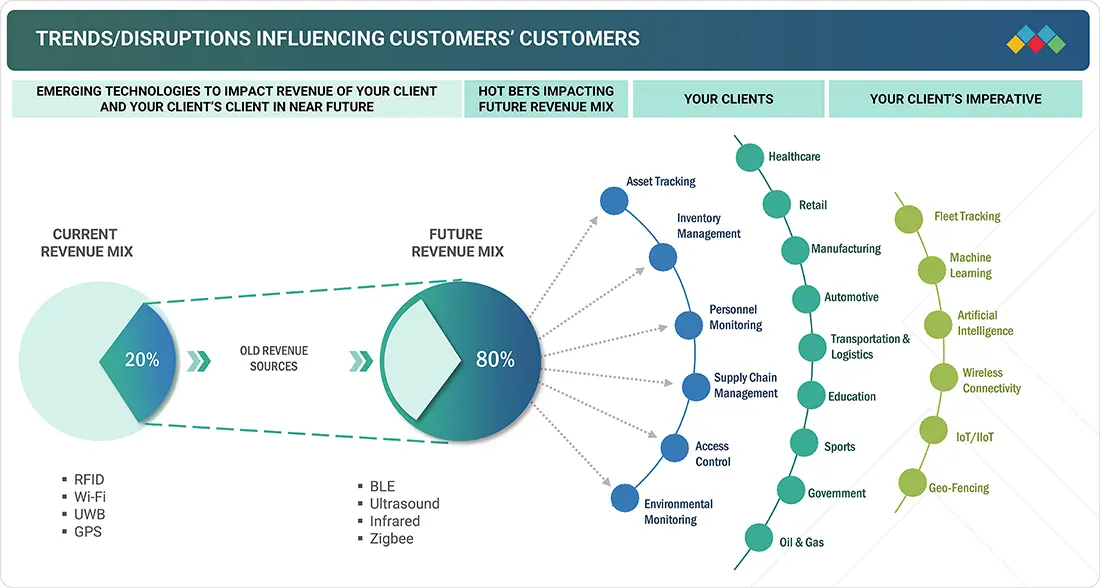
TRENDS & DISRUPTIONS IMPACTING CUSTOMERS' CUSTOMERS
Emerging technologies are set to disrupt traditional revenue streams by shifting the future revenue mix toward innovation-driven solutions. Key growth areas, such as asset tracking, inventory management, supply chain optimization, and environmental monitoring, fuel the demand across industries, including healthcare, retail, manufacturing, and logistics. Disruptive enablers, including IoT/IIoT, AI, machine learning, and wireless connectivity, accelerate this shift, creating opportunities in fleet tracking, geo-fencing, and smart monitoring. This transition underscores businesses' need to adopt new technologies to stay competitive and capture high-growth revenue streams.
Source: Secondary Research, Interviews with Experts, MarketsandMarkets Analysis
Real-time Location Systems (RTLS) MARKET DYNAMICS
Level
-
High emphasis on safety, compliance, and operational efficiency across enterprises

-
Growing safety and security concerns in healthcare sector

Level
-
Data security and privacy issues

-
High installation and maintenance costs

Level
-
Mounting demand for hybrid RTLS solutions

-
Emerging applications of RTLS technology

Level
-
Persistent trade-offs in RTLS design

-
Interoperability issues due to a lack of standardized protocols

Source: Secondary Research, Interviews with Experts, MarketsandMarkets Analysis
Driver: High emphasis on safety, compliance, and operational efficiency across enterprises
The RTLS market is witnessing accelerated growth as enterprises across healthcare, education, oil & gas, and manufacturing increasingly demand real-time visibility of assets and personnel. Heightened emphasis on safety, compliance, and operational efficiency has amplified adoption. While RTLS solutions remain costlier than legacy tracking systems, the influx of agile startups and niche-focused vendors has intensified competition, pushing providers to deliver more affordable, application-specific offerings.
Restraint: High installation and maintenance costs
Deploying a real-time location system (RTLS) involves significant capital investment, often costing millions, depending on the healthcare facility's scale and chosen technology. Wi-Fi-based RTLS solutions typically have lower upfront costs than ultra-wideband (UWB) systems, while RFID and Bluetooth Low Energy (BLE) vary in price. Ongoing maintenance also adds to total ownership costs. Implementation isn't plug-and-play; many providers face deployment challenges, and projects may fail due to the need for extensive engineering customization and on-site support.
Opportunity: Mounting demand for hybrid RTLS solutions
The demand for hybrid RTLS solutions is rising as they address the limitations of single-technology systems. Localized RTLS aids in GPS-challenged areas without the full infrastructure costs, providing a reliable and easy-to-install option. Hybrid solutions combine technologies for cost-efficiency and accuracy. For instance, Wi-Fi and ZigBee can penetrate walls, while infrared (IR) passes through glass. Although IR has a limited range, ultrasound covers larger areas effectively. Ultrasound supports quick communication between tags and locators, allowing multiple tags in a room.
Challenge: Persistent trade-offs in RTLS design
Different RTLS solution providers offer various technologies tailored to specific applications, but achieving a single solution with a high range, accuracy, and low power consumption remains a challenge. RTLS integrates hardware and software to provide real-time location information for assets, people, or resources using tags, readers, and sensors. However, RTLS tags grapple with accuracy, power consumption, and range trade-offs. Narrowband tags often lack the needed accuracy, while wideband tags offer better precision but consume more power. Vendors must work to balance these factors, especially considering the number of tags required for diverse applications like hospital personnel tracking or warehouse asset tracking.
Real-time Location Systems (RTLS) Market: COMMERCIAL USE CASES ACROSS INDUSTRIES
| COMPANY | USE CASE DESCRIPTION | BENEFITS |
|---|---|---|
|
|
RTLS solutions for healthcare asset tracking, staff workflow optimization, and patient safety | Improved operational efficiency, reduced equipment loss, enhanced patient care |
|
|
RTLS systems for hospitals to track medical devices, monitor patients, and ensure staff safety | Increased patient safety, optimized asset utilization, compliance with healthcare standards |
|
|
RTLS for smart manufacturing and logistics to enable automated workflows and supply chain visibility | Higher productivity, real-time insights, minimized downtime |
 |
RTLS platforms for automotive and aerospace assembly lines | Precision tracking, reduced production errors, improved process efficiency |
 |
RTLS for oil & gas, mining, and port operations | Enhanced worker safety, improved asset visibility, operational reliability in harsh environments |
Logos and trademarks shown above are the property of their respective owners. Their use here is for informational and illustrative purposes only.
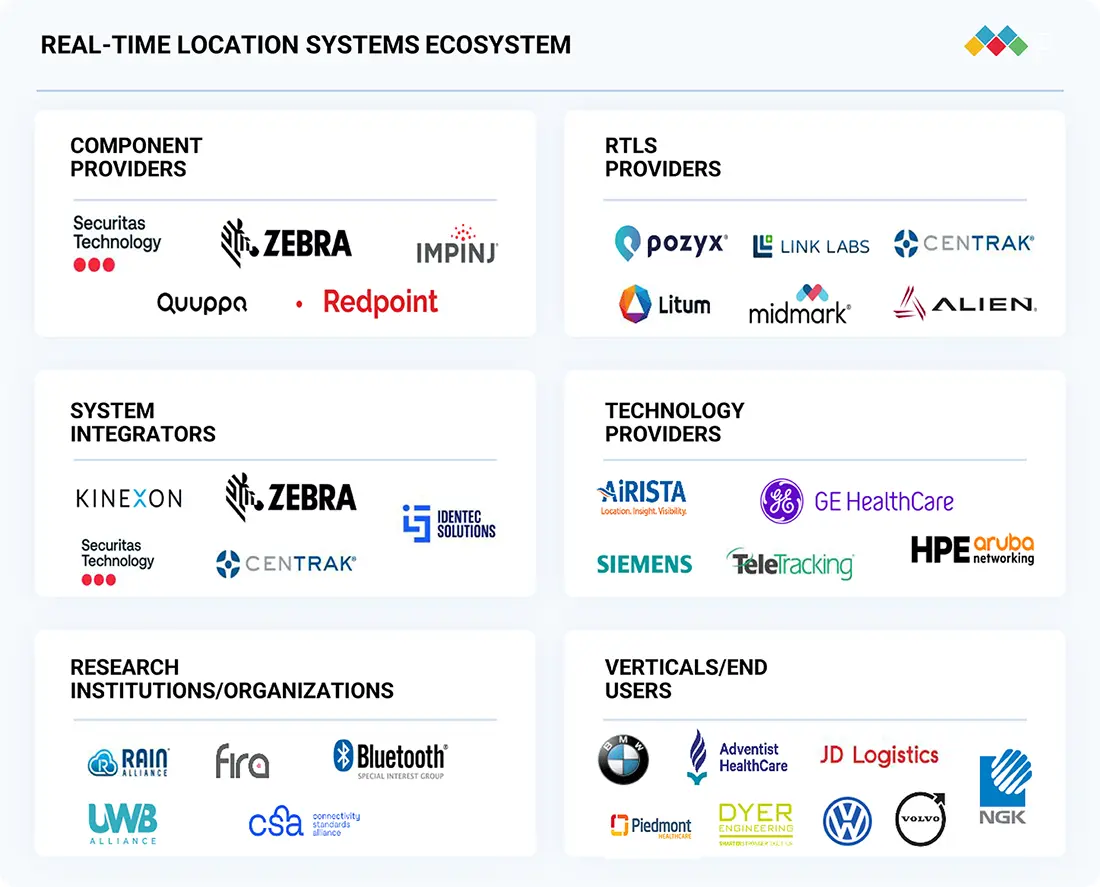
Real-time Location Systems (RTLS) MARKET ECOSYSTEM
The RTLS ecosystem comprises key components, such as hardware and software, which include tags, readers, antennas, and positioning software, utilizing RFID, UWB, BLE, Wi-Fi, and GPS technologies. These systems are applied in asset and personnel tracking, workflow optimization, and inventory management across healthcare, manufacturing, logistics, and retail industries. It involves various services, including installation, integration, maintenance, and data analytics. The hardware types include tags, sensors, gateways, and handheld readers, all working to deliver real-time location data, enhancing visibility and operational efficiency.
Logos and trademarks shown above are the property of their respective owners. Their use here is for informational and illustrative purposes only.
Real-time Location Systems (RTLS) MARKET SEGMENTS
Source: Secondary Research, Interviews with Experts, MarketsandMarkets Analysis
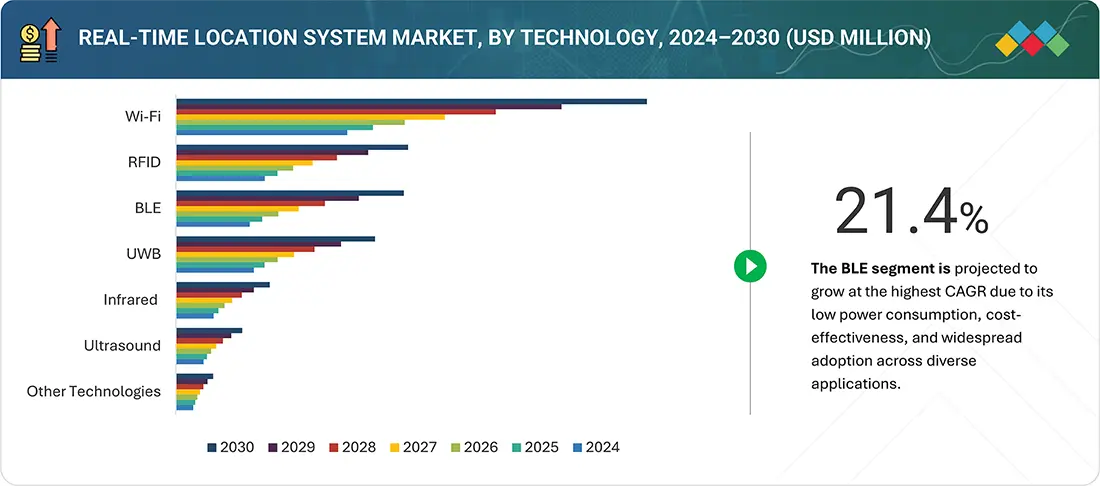
Real-time Location System Market, By Technology
The Bluetooth Low Energy (BLE) segment is set to grow significantly in the RTLS market due to its efficiency and cost-effectiveness. BLE, an improved version of traditional Bluetooth, transmits data regularly while using much less power, resulting in extended battery life and easy deployment. Additionally, BLE signals penetrate walls and obstacles effectively, making them ideal for complex indoor environments. These features establish BLE as a preferred technology for scalable and energy-efficient location tracking across various industries.
Real-time Location System Market, By Offering
RTLS solutions utilize a network of hardware to track the location of objects and people indoors, mainly of readers, tags (trackers), and sometimes access points. Readers are stationary devices that detect signals from tags, allowing them to calculate positions and send data to RTLS software. Tags are small, battery-powered devices attached to assets or people that provide identification and sensor data. Access points, when included relay data from readers to central software, enhances efficiency and network management. These components enable real-time tracking, optimize workflows, and improve safety by monitoring personnel and securing valuable equipment.
Real-time Location System Market, By Application
RTLS platforms are increasingly used across industries to monitor the workflow on the operational floor. Many organizations' primary concern is keeping track of people/staff inside a predetermined area. In manufacturing, healthcare, and many other industries, keeping track of personnel can provide valuable information to the organization. This helps organizations make split-second decisions, protect staff, and avoid disasters. For this purpose, gadgets such as tags/badges and gateways are used.
Real-time Location System Market, By Vertical
The manufacturing vertical includes automotive, aerospace, heavy equipment, tire, glass, and other sectors. This vertical has a vast market potential for RTLS solutions, mainly because of the increasing awareness about asset/staff safety and rapid industrialization, especially in developing regions such as Asia Pacific and RoW. RTLS solution helps improve safety in manufacturing plants by tracking every movement of assets, staff, and vehicles. RTLS can also monitor the proximity between workers and forklifts, ensuring the safety of assets and the workforce by preventing accidents, collisions, and controlling overspeed.
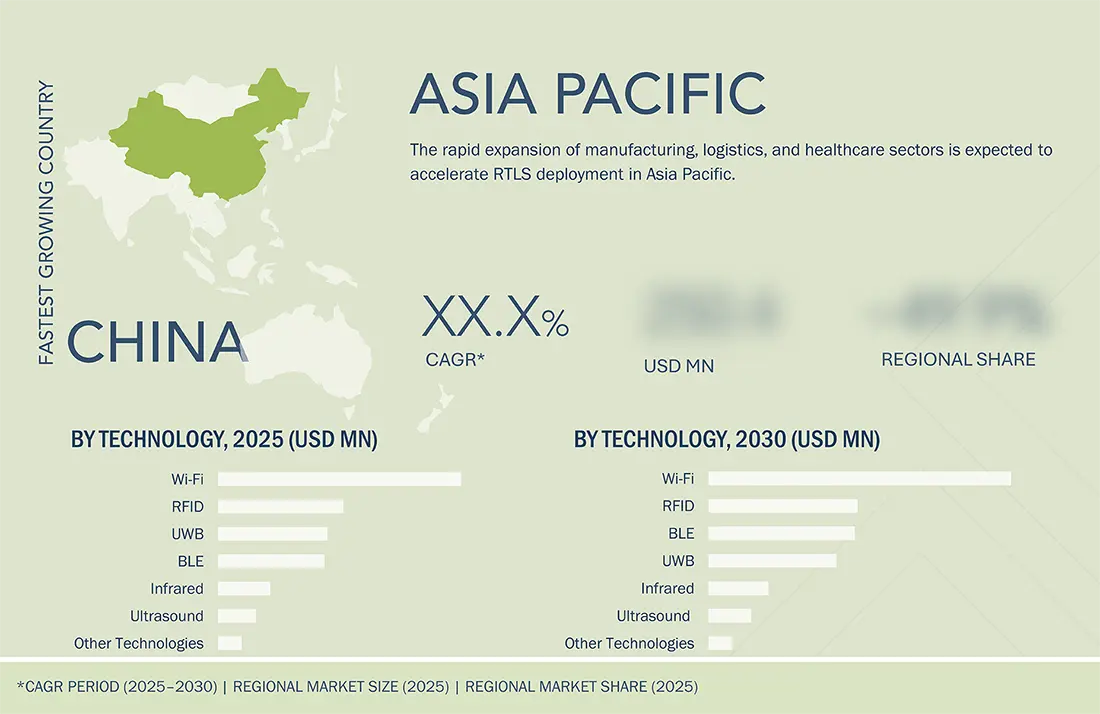
REAL-TIME LOCATION SYSTEMS (RTLS) MARKET REGION
Asia Pacific is expected to be the fastest-growing region in the global real-time location system market during the forecast period.
Asia Pacific is one of the major markets for RTLS. The market in this region is expected to exhibit the highest CAGR during the forecast period. The Asia Pacific region is experiencing advancements in healthcare as facilities increasingly adopt technology to enhance performance and automate processes. Japan is leading the way in RTLS adoption, while South Korea, China, and Australia are also expected to see significant market expansion. China's growing healthcare sector is a key driver for RTLS development, especially in asset, patient, hand hygiene, and environmental monitoring applications. China's robust manufacturing sector also creates high demand for RTLS solutions to improve operational efficiency and reduce costs by tracking equipment and materials.
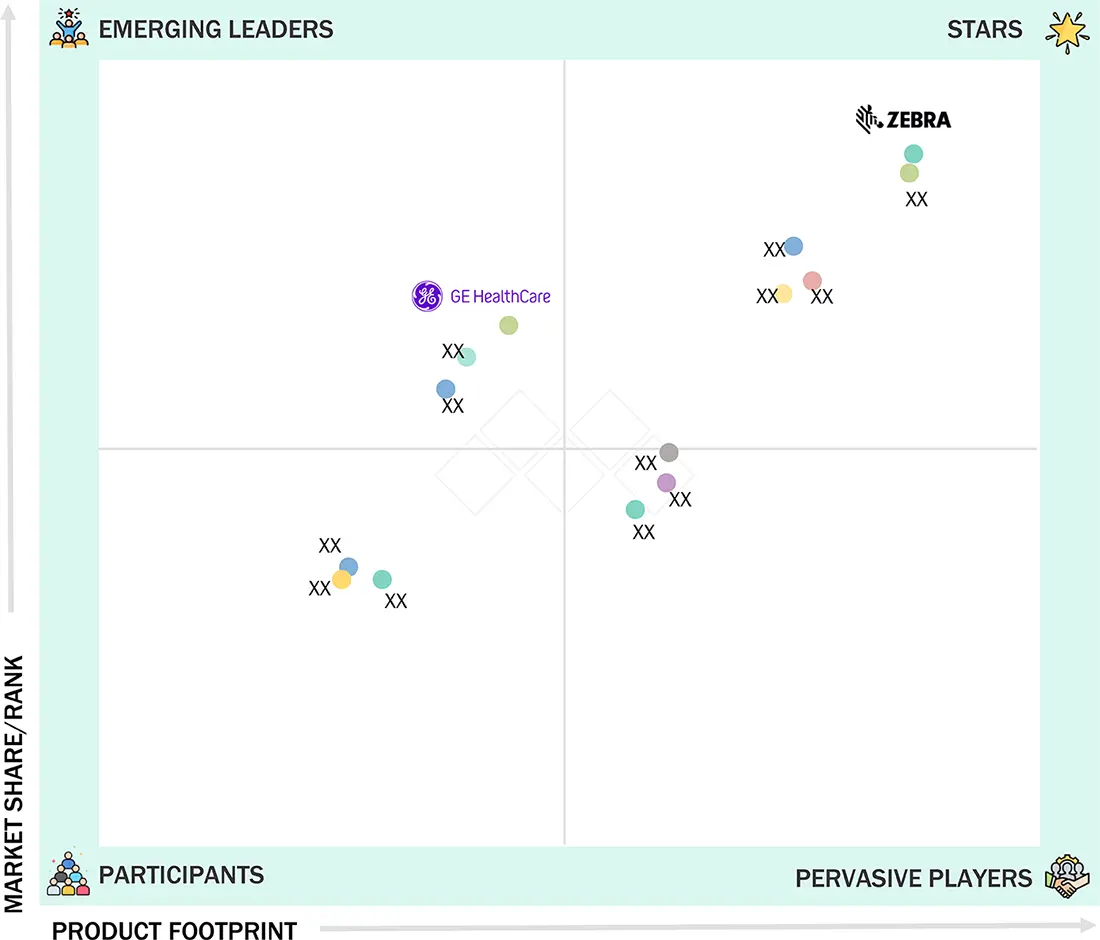
Real-time Location Systems (RTLS) Market: COMPANY EVALUATION MATRIX
In the real-time location system market matrix, Zebra Technologies Corp. (Star) leads with a strong global presence and a comprehensive portfolio spanning various technologies of RTLS offerings. It also caters to a number of verticals, such as healthcare, manufacturing, and automotive. GE Healthcare (Emerging Leader) is gaining momentum with innovative RTLS solutions in the healthcare vertical.
Source: Secondary Research, Interviews with Experts, MarketsandMarkets Analysis
Real-time Location Systems (RTLS) MARKET KEY PLAYERS - Top Real-time Location System (RTLS) Companies
Real-time Location Systems (RTLS) MARKET SCOPE
| REPORT METRIC | DETAILS |
|---|---|
| Market Size in 2024 (Value) | USD 5.84 Billion |
| Market Forecast in 2030 (Value) | USD 15.67 Billion |
| Growth Rate | CAGR of 18.6% from 2025 to 2030 |
| Years Considered | 2021-2030 |
| Base Year | 2024 |
| Forecast Period | 2025-2030 |
| Units Considered | Value (USD Million/Billion), Volume (Thousand units) |
| Report Coverage | Revenue forecast, company ranking, competitive landscape, growth factors, and trends |
| Segments Covered |
|
| Regions Covered | North America, Europe, Asia Pacific, Middle East, South America, and Africa |
WHAT IS IN IT FOR YOU: Real-time Location Systems (RTLS) Market REPORT CONTENT GUIDE
DELIVERED CUSTOMIZATIONS
We have successfully delivered the following deep-dive customizations:
| CLIENT REQUEST | CUSTOMIZATION DELIVERED | VALUE ADDS |
|---|---|---|
| Healthcare Provider | RTLS adoption roadmap for patient, staff, and asset tracking Comparative vendor benchmarking | Optimize patient flow and reduce wait times Identify cost-efficient and high-performing RTLS vendors Enhance operational efficiency and patient satisfaction |
| Industrial Manufacturer | Asset tracking implementation strategy Integration assessment with ERP/MES ROI analysis | Reduce labor and search costs Improve inventory accuracy and production efficiency Prioritize high-impact use cases for RTLS deployment |
| Logistics and Warehousing Company | Patent landscape and R&D Fleet and asset tracking mapping Technology comparison (BLE, RFID, UWB) Real-time monitoring of KPIs | Improve warehouse throughput Reduce lost/damaged assets Enable predictive maintenance and operational optimization |
RECENT DEVELOPMENTS
- July 2025 : Sonitor and Spectralink announced a strategic partnership integrating Sonitor MDures with Spectralink Versity 95 and 97 smartphones. The partnership delivers real-time RTLS-based duress alerts to enhance hospital staff safety through rapid emergency location tracking.
- March 2025 : CenTrak expanded its RTLS portfolio by launching a fully integrated, plug-and-play Bluetooth Low Energy (BLE) platform, featuring new BLE tags, badges, and network devices. This platform delivers unprecedented flexibility and scalability for real-time tracking, staff duress systems, and asset management in healthcare environments.
- September 2024 : Quuppa and ZulaFly formed a strategic partnership to integrate Quuppa’s high-precision RTLS technology with ZulaFly’s advanced healthcare asset and staff safety platform, aiming to revolutionize real-time location services in healthcare settings.
- June 2024 : Twinzo, a provider of no-code live digital twin technology, partnered with Quuppa to revolutionize the location-based services market with innovative technologies that enhance efficiency and innovation across various industries, such as manufacturing, logistics, and healthcare.
Table of Contents
 Exclusive indicates content/data unique to MarketsandMarkets and not available with any competitors.
Methodology
The study involved four major activities in estimating the current size of the real-time location systems (RTLS) market. Exhaustive secondary research has been conducted to gather information on the market, adjacent markets, and the overall RTLS landscape. These findings, along with assumptions and projections, were validated through primary research involving interviews with industry experts and key stakeholders across the value chain. Both top-down and bottom-up approaches were utilized to estimate the overall market size. Subsequently, market breakdown and data triangulation techniques were applied to determine the sizes of various segments and subsegments. Two key sources, secondary and primary, were leveraged to conduct a comprehensive technical and commercial assessment of the RTLS market.
Secondary Research
Various secondary sources have been referred to in the secondary research process to identify and collect important information for this study. The secondary sources include annual reports, press releases, and investor presentations of companies; white papers; journals and certified publications; and articles from recognized authors, websites, directories, and databases. Secondary research has been conducted to obtain key information about the industry’s supply chain, the market’s value chain, the total pool of key players, market segmentation according to the industry trends (to the bottom-most level), regional markets, and key developments from market- and technology-oriented perspectives. The secondary data has been collected and analyzed to determine the overall market size, further validated by primary research.
Primary Research
Extensive primary research was conducted after gaining knowledge about the current scenario of the RTLS market through secondary research. Several primary interviews were conducted with experts from the demand and supply sides across four major regions: North America, Europe, Asia Pacific, and RoW. This primary data was collected through questionnaires, emails, and telephone interviews.
 Market Size, and Share")
Three tiers of companies are defined based on their total revenue as of 2024: tier 3 = revenue less than USD 500 million; tier 2 = revenue between USD 500 million and USD 3 billion; and tier 1 = revenue more than USD 3 billion.
Other designations include sales managers, marketing managers, and product managers.
To know about the assumptions considered for the study, download the pdf brochure
Market Size Estimation
Both top-down and bottom-up approaches have been used to estimate and validate the total size of the RTLS market. These methods have also been used extensively to estimate the size of various subsegments in the market. The following research methodology has been used to estimate the market size:
- Major players in the industry and markets have been identified through extensive secondary research.
- The industry’s value chain and market size (in terms of value) have been determined through primary and secondary research processes.
- All percentage shares, splits, and breakdowns have been determined using secondary sources and verified through primary sources.
Real-time Location Systems (RTLS) Market : Top-Down and Bottom-Up Approach
 Market Top Down and Bottom Up Approach")
Data Triangulation
After arriving at the overall size of the RTLS market from the market size estimation process explained above, the total market has been split into several segments and subsegments. Data triangulation and market breakdown procedures have been employed, wherever applicable, to complete the overall market engineering process and arrive at the exact statistics for all segments and subsegments of the market. The data has been triangulated by studying various factors and trends from both the demand and supply sides. Along with this, the market size has been validated using both top-down and bottom-up approaches.
Market Definition
A real-time location system (RTLS) is designed to automatically detect, identify, and track the position of objects, individuals, or targets within a defined area with high precision. These systems typically comprise location tags or badges affixed to assets or worn by personnel, a network of readers, sensors, or access points strategically deployed across the facility, and a centralized software platform that processes and visualizes location data in real time. RTLS components communicate wirelessly, leveraging a range of enabling technologies such as radio-frequency identification (RFID), Wi-Fi, ultrasound, infrared (IR), Bluetooth Low Energy (BLE), or global positioning systems (GPS) to accurately determine movement and positioning. The core objective of RTLS is to deliver continuous visibility and situational awareness across sectors, including healthcare, manufacturing, logistics, warehousing, and transportation. By providing real-time tracking of high-value assets and personnel, RTLS helps organizations improve operational efficiency, ensure safety compliance, prevent loss or theft, streamline workflow, and optimize resource utilization, making it a critical tool for data-driven decision-making in dynamic operational environments.
Key Stakeholders
- RTLS Hardware Providers
- RTLS Software Providers
- RTLS-related Service Providers
- Government Bodies and Policymakers
- Industry-standard Organizations, Forums, Alliances, and Associations
- Market Research and Consulting Firms
- Raw Material Suppliers and Distributors
- Research Institutes and Organizations
- Testing, Inspection, and Certification Providers
- Distributors and Resellers
- End Users
Report Objectives
- To define, describe, and forecast the RTLS market in terms of offering, technology, application, and vertical
- To describe and forecast the market, in terms of value, with regard to four main regions: North America, Europe, Asia Pacific, and Rest of the World (RoW), along with their respective countries
- To provide detailed information regarding major factors influencing the market growth (drivers, restraints, opportunities, and challenges)
- To provide a detailed overview of the value chain of the RTLS market
- To strategically analyze micromarkets with respect to individual growth trends, prospects, and contributions to the RTLS market
- To analyze opportunities for stakeholders by identifying high-growth segments of the RTLS market
- To strategically profile key players and comprehensively analyze their market position in terms of ranking and core competencies, along with detailing the competitive landscape for market leaders
- To analyze competitive strategies, such as product launches, expansions, mergers, and acquisitions, adopted by key market players in the RTLS market
Customization Options
With the given market data, MarketsandMarkets offers customizations according to the company’s specific needs. The following customization options are available for the report:
Company Information
- Detailed analysis and profiling of additional market players (up to 5)
Key Questions Addressed by the Report
What is the total CAGR expected to be recorded for the RTLS market during 2025-2030?
The global RTLS market is expected to record a CAGR of 18.6% from 2025 to 2030.
What are the driving factors for the RTLS market?
The rising need for efficient resource utilization and workflow optimization, and the escalating adoption of healthcare IoT solutions are some of the major drivers and opportunities for the real-time location system market.
What is the impact of AI on the RTLS market?
AI is transforming the RTLS landscape by enabling higher accuracy, predictive location analytics, and intelligent event triggering for mission-critical applications. It enhances system adaptability, supports complex environment tracking, and streamlines data collection for machine learning models. These capabilities drive greater operational efficiency, safety compliance, and ROI across sectors such as healthcare, manufacturing, and logistics.
Which are the significant players operating in the RTLS Market?
Major players in the real-time location system market include Securitas AB (Sweden), Zebra Technologies Corp. (US), Impinj, Inc. (US), Siemens (Germany), and CenTrak, Inc. (US). These companies adopted strategies such as acquisitions, product launches, collaborations, agreements, and contracts to withstand the competitive landscape of this market.
Which region will offer lucrative growth for the RTLS market by 2030?
During the forecast period, Asia Pacific is expected to offer lucrative opportunities in the RTLS market.
Need a Tailored Report?
Customize this report to your needs
Get 10% FREE Customization
Customize This ReportPersonalize This Research
- Triangulate with your Own Data
- Get Data as per your Format and Definition
- Gain a Deeper Dive on a Specific Application, Geography, Customer or Competitor
- Any level of Personalization
Let Us Help You
- What are the Known and Unknown Adjacencies Impacting the Real-time Location Systems (RTLS) Market
- What will your New Revenue Sources be?
- Who will be your Top Customer; what will make them switch?
- Defend your Market Share or Win Competitors
- Get a Scorecard for Target Partners

Custom Market Research Services
We Will Customise The Research For You, In Case The Report Listed Above Does Not Meet With Your Requirements
Get 10% Free CustomisationTESTIMONIALS

Tetsuya Ohhira
Business Development Manager-Technology Business
Nikon Corporation,
Leading Japanese MNC specializing in optics and imaging productswww.nikon.com
MarketsandMarkets™ response
is quick. Their attitude is flexible and positive. Analyst Insights are globally considered and
significant. Client Services quickly respond to our inquiry and demand. Their wide range of global
surveys help us make our strategic plan.
We hope Knowledge Store will be easier to search
for a report.
VP - Marketing & Business Development
Leading Provider of Process Control Solutions
We engaged with MarketsandMarkets on a study to perform an analysis and recommend a Go-To-Market strategy for metrology and process control in the semiconductor market. The study was tailored to our targets and needs with well-defined milestones. Our overall experience with the MarketsandMarkets team was very good throughout the project in all aspects including the analysis methodologies used, the quality and depth of primary and secondary data sets, the professionalism and flexibility of the team and the ability to meet the target schedule and milestones. We want to thank MarketsandMarkets team for a job well done.
- US Real-time Location Systems (RTLS) Market
- Canada Real-time Location Systems (RTLS) Market
- Mexico Real-time Location Systems (RTLS) Market
- Germany Real-time Location Systems (RTLS) Market
- UK Real-time Location Systems (RTLS) Market
- France Real-time Location Systems (RTLS) Market
- Spain Real-time Location Systems (RTLS) Market
- Italy Real-time Location Systems (RTLS) Market
- Rest Of Europe Real-time Location Systems (RTLS) Market
- China Real-time Location Systems (RTLS) Market
- Japan Real-time Location Systems (RTLS) Market
- India Real-time Location Systems (RTLS) Market
- South Korea Real-time Location Systems (RTLS) Market
- Australia Real-time Location Systems (RTLS) Market
- Singapore Real-time Location Systems (RTLS) Market
- Malaysia Real-time Location Systems (RTLS) Market
- Philippines Real-time Location Systems (RTLS) Market
- Rest Of Asia Pacific Real-time Location Systems (RTLS) Market
- GCC Countries Real-time Location Systems (RTLS) Market
- Rest Of Middle East Real-time Location Systems (RTLS) Market
Growth opportunities and latent adjacency in Real-time Location Systems (RTLS) Market


Clarence
Apr, 2026
What are the most critical use cases for personnel tracking, and how do they differ across industries like healthcare and manufacturing?.
Eric
Apr, 2026
How is the RTLS market expected to evolve over the next 5 years in terms of technology convergence, accuracy improvements, and new use cases?.
Dylan
Apr, 2026
With Asia Pacific projected to grow at over 23 CAGR, what go-to-market strategies should companies adopt to capture high-growth regional revenues?.
Sagar
Apr, 2022
I want to put value proposition for RTLS integration companies.
SYED
Apr, 2022
We would like to go through the Real-time Location Systems Market (RTLS) in greater details specifically for our region Saudi Arabian Market..
Marcus
Apr, 2022
Want to get to know more about this RTLS market .
Aaron
Apr, 2022
Good afternoon We are interested in this report on RTLS, as well as the one on Hospital Capacity Management Solutions but was curious how they are delivered and how single/corporate users are handled. Are these PDF documents or online only? Thank you, Aaron Huet.
User
Sep, 2019
Using geomagnetic technology based RTLS systems usually eliminates the need for additional hardware, still the penetration of this technology is very less in this market. I wanted to get in-depth information about this technology with respect to real time tracking. Have you considered geomagnetic technologies in the study?.
User
Sep, 2019
RFID is one of the oldest and most used technology in the RTLS market. We are currently in the business of providing passive RFID technology based products and are planning to includes active RFID products in our offerings. For this purpose I'm interested in knowing volume data of active RFID tags, is it covered in the study?.
User
Sep, 2019
We are planning to expand our offerings in Asian market, so would like to get insights on UWB and BLE technologies for Asian region..
User
Nov, 2019
I can see that the RTLS market is witnessing significant growth in the APAC region. We are planning to expand our presence in this region, so would like to know if insights on drivers and restraints specific to market in APAC available in the report?.
Abdessamad
Sep, 2022
Hello I need an RTLS solution to control the monitoring of our fleet of biomedical equipment. Cordially .
User
Mar, 2019
Healthcare is one of the key application area of RTLS. We want to expand our offerings to cater to clients from healthcare industry. Is the information on this industry available in the report?.