Refrigeration Monitoring Market by Offering (Hardware, Software, and Service), Sensor (temperature, defrost, touch, liquid level, gas detector, contact, motion detector, pressure), Application, Industry, and Region - Global Forecast to 2035


Refrigeration Monitoring Market Summary
The global Refrigeration Monitoring Market is witnessing strong growth, driven by increasing demand for cold chain optimization, food safety compliance, and real-time asset monitoring across industries. The market was valued at approximately USD 7.2 - 7.4 billion in 2024 and is projected to reach USD 18.5 - 20.2 billion by 2035, growing at a CAGR of 8.9 - 9.3% during the forecast period (2025–2035). Rapid advancements in IoT-enabled sensors, AI-based predictive analytics, and cloud-based monitoring platforms are transforming traditional refrigeration systems into intelligent, connected ecosystems. Additionally, the rising need for temperature-sensitive logistics in pharmaceuticals, food & beverage, and chemicals is accelerating adoption. Automation and digital transformation across supply chains are further enhancing the role of refrigeration monitoring solutions in minimizing product loss, ensuring compliance, and improving operational efficiency.
Key factors fueling the growth of this market include changing food consumption patterns, shifting consumer preferences for organic food products, increasing demand for high-quality packed food products, growing demand for temperature-sensitive drugs, high disposable income, and the need to reduce food wastage.
Key Market Trends & Insights
The Refrigeration Monitoring Market is evolving rapidly, shaped by technological innovation and regulatory pressures. North America currently leads the market due to strong adoption of advanced monitoring systems and stringent food safety regulations. Asia Pacific is emerging as the fastest-growing region, driven by expanding cold storage infrastructure and increasing demand for processed food and vaccines. The hardware segment, particularly sensors and data loggers, continues to dominate due to their critical role in temperature tracking. However, software platforms integrated with AI and cloud analytics are gaining momentum. One of the most significant trends is the integration of AI for predictive maintenance, enabling businesses to prevent equipment failures and reduce downtime. Automation, remote monitoring, and real-time alerts are also becoming standard features across modern refrigeration systems.
Market Size & Forecast
- Base year market size (2024): USD 7.2 - 7.4 billion
- Forecast value by 2035: USD 18.5 - 20.2 billion
- CAGR (2024–2035): 8.9 - 9.3%
- Growth is driven by rising demand for cold chain logistics, increasing adoption of IoT-enabled monitoring solutions, and growing regulatory compliance requirements across industries such as food safety and pharmaceuticals.
Refrigeration Monitoring Market Top 10 key takeaway
- The market is projected to grow at a steady CAGR of 8.9% through 2035.
- IoT-based refrigeration monitoring systems are becoming industry standard.
- North America remains the largest regional market.
- Asia Pacific is the fastest-growing region due to infrastructure expansion.
- AI-driven predictive maintenance is a key innovation trend.
- Cloud-based monitoring platforms are gaining widespread adoption.
- Food & beverage sector dominates application demand.
- Regulatory compliance is a major driver for adoption.
- Integration with automation systems enhances operational efficiency.
- Pharmaceutical cold chain monitoring is a high-growth opportunity.
Product Insights
The hardware segment, including temperature sensors, humidity sensors, and data loggers, dominates the Refrigeration Monitoring Market due to its foundational role in capturing real-time environmental data. These devices are critical for maintaining temperature-sensitive environments, particularly in food storage and pharmaceutical logistics. Their reliability, accuracy, and declining costs have driven widespread adoption across industries.
However, software platforms are rapidly gaining traction as organizations shift toward integrated monitoring ecosystems. Cloud-based dashboards, mobile applications, and analytics tools are enabling real-time visibility, automated alerts, and historical data analysis. Emerging product categories such as wireless sensor networks and AI-powered monitoring systems are further enhancing efficiency. These advanced systems not only monitor conditions but also predict equipment failures and optimize energy consumption, making them essential for modern smart refrigeration infrastructure.
Technology / Component Insights
The Refrigeration Monitoring Market is being reshaped by a convergence of advanced technologies. IoT plays a central role by enabling interconnected devices that continuously transmit temperature and performance data. Cloud computing allows centralized data storage and remote access, enabling stakeholders to monitor refrigeration systems from anywhere.
Artificial intelligence is becoming a game-changer by enabling predictive analytics and anomaly detection. AI algorithms analyze historical and real-time data to identify patterns, forecast potential failures, and recommend corrective actions. Automation technologies are also streamlining operations by triggering alerts and automated responses when temperature thresholds are breached.
Looking ahead, edge computing is expected to gain prominence, allowing faster data processing directly at the device level. Blockchain integration is also being explored for secure and transparent tracking of cold chain data, particularly in pharmaceuticals.
Application Insights
The food & beverage industry remains the leading application segment in the Refrigeration Monitoring Market, driven by stringent regulations around food safety and quality. Monitoring systems are essential for preventing spoilage, maintaining freshness, and ensuring compliance with global standards.
The pharmaceutical sector is another rapidly growing application area, particularly with the rise in demand for vaccines and biologics that require strict temperature control. Healthcare facilities, supermarkets, logistics providers, and chemical storage units are also increasingly adopting refrigeration monitoring systems.
Future opportunities lie in expanding cold chain infrastructure in emerging markets, along with increasing adoption in e-commerce grocery delivery and last-mile cold storage solutions.
Regional Insights
North America leads the Refrigeration Monitoring Market due to strong technological adoption, well-established cold chain infrastructure, and strict regulatory frameworks governing food and pharmaceutical storage. Europe follows closely, with increasing focus on sustainability and energy-efficient refrigeration systems.
Asia Pacific is the fastest-growing region, fueled by rapid urbanization, expansion of organized retail, and increasing demand for processed and frozen food products. Countries in this region are investing heavily in cold storage infrastructure and digital monitoring solutions.
Latin America and the Middle East & Africa are also witnessing steady growth, supported by improving logistics networks and rising awareness of food safety standards.
- North America dominates due to advanced infrastructure and regulations
- Europe focuses on sustainability and energy efficiency
- Asia Pacific is the fastest-growing region
- Emerging markets are investing in cold chain infrastructure
- Increasing digitalization is boosting adoption globally
Country-Specific Market Trends
In Asia Pacific, China is leading with a CAGR of around 10.5%, driven by massive investments in cold storage and logistics infrastructure. Japan follows with steady growth due to technological advancements and automation in refrigeration systems.
In North America, the United States remains the largest market, with strong adoption of AI-driven monitoring solutions, while Canada and Mexico are experiencing moderate growth supported by expanding food processing industries.
In Europe, Germany leads the market with a focus on industrial automation and energy efficiency, while France is witnessing growth due to increased adoption in retail and healthcare sectors.
- China leads APAC with highest growth rate
- Japan focuses on automation and smart monitoring
- United States dominates North America market
- Canada and Mexico show steady adoption growth
- Germany and France lead European advancements
Key Refrigeration Monitoring Market Company Insights
The Refrigeration Monitoring Market is highly competitive, with key players focusing on innovation, AI integration, and strategic partnerships. Companies are investing heavily in developing smart monitoring solutions that offer real-time insights and predictive capabilities.
Major players include Emerson Electric Co., Honeywell International Inc., Danfoss A/S, Johnson Controls, Siemens AG, Sensitech Inc., Carrier Global Corporation, and Digi International. These companies are leveraging IoT platforms, cloud-based analytics, and AI-driven solutions to enhance their product offerings.
Their strategies revolve around expanding product portfolios, improving system interoperability, and targeting high-growth sectors such as pharmaceuticals and food logistics.
- Companies focus on AI-enabled monitoring solutions
- Strong investment in IoT and cloud integration
- Strategic partnerships drive market expansion
- Product innovation remains a key competitive factor
- Focus on high-growth applications like pharma cold chain
Recent Developments
Recent developments in the Refrigeration Monitoring Market highlight the growing emphasis on digital transformation. Several companies have launched AI-powered monitoring platforms capable of predictive maintenance and automated alerts.
There has also been an increase in partnerships between technology providers and logistics companies to enhance cold chain visibility. Additionally, new wireless sensor technologies are being introduced to improve scalability and reduce installation costs.
Market Segmentation
The Refrigeration Monitoring Market is segmented based on product, technology/component, application, and region. By product, the market includes hardware devices such as sensors and data loggers, along with software platforms for monitoring and analytics. By technology, it encompasses IoT-based systems, cloud platforms, AI-driven analytics, and automation solutions. Applications span across food & beverage, pharmaceuticals, healthcare, logistics, and chemicals. Regionally, the market is divided into North America, Europe, Asia Pacific, Latin America, and the Middle East & Africa.
- Hardware and software form key product segments
- IoT and AI dominate technology adoption
- Food & beverage leads application segment
- Pharmaceuticals show high growth potential
- Asia Pacific emerges as key regional market
Conclusion
The Refrigeration Monitoring Market is poised for significant growth through 2035, driven by increasing demand for efficient cold chain management and advancements in AI, IoT, and automation technologies. As industries continue to prioritize quality control, regulatory compliance, and operational efficiency, refrigeration monitoring solutions will become indispensable. The integration of predictive analytics, real-time monitoring, and cloud-based platforms will further enhance market potential. Businesses investing in smart refrigeration technologies will gain a competitive edge, making this market strategically critical for the future of global supply chains.
FAQs
-
What is the current size of the Refrigeration Monitoring Market?
The market was valued at approximately USD 7.2 billion in 2024. -
What is the expected growth rate of the market?
It is projected to grow at a CAGR of 8.9% from 2025 to 2035. -
What are the key drivers of the market?
Key drivers include IoT adoption, AI-based analytics, regulatory compliance, and cold chain expansion. -
Which region leads the market?
North America is currently the leading region. -
Who are the key players in the market?
Major companies include Emerson Electric, Honeywell, Danfoss, Johnson Controls, Siemens, and Carrier Global.
To speak to our analyst for a discussion on the above findings, click Speak to Analyst
 Exclusive indicates content/data unique to MarketsandMarkets and not available with any competitors.
Table of Contents
1 Introduction (Page No. - 18)
1.1 Study Objectives
1.2 Definition
1.2.1 Inclusions and Exclusions
1.3 Scope
1.3.1 Markets Covered
1.3.2 Years Considered
1.4 Currency
1.5 Limitations
1.6 Market Stakeholders
2 Research Methodology (Page No. - 22)
2.1 Research Data
2.1.1 Secondary Data
2.1.1.1 Secondary Sources
2.1.2 Primary Data
2.1.2.1 Breakdown of Primary Interviews
2.1.2.2 Key Data From Primary Sources
2.1.2.3 Key Industry Insights
2.2 Market Size Estimation
2.2.1 Bottom-Up Approach
2.2.1.1 Approach to Capture Market Size By Bottom-Up Analysis(Demand Side)
2.2.2 Top-Down Approach
2.2.2.1 Approach to Capture Market Share By Top-Down Analysis (Supply Side)
2.3 Market Breakdown and Data Triangulation
2.4 Research Assumptions
3 Executive Summary (Page No. - 33)
4 Premium Insights (Page No. - 37)
4.1 Attractive Growth Opportunities in Refrigeration Monitoring Market
4.2 Market, By Offering
4.3 Market, By Country
4.4 Market, By Industry and APAC Country
5 Market Overview (Page No. - 40)
5.1 Introduction
5.2 Market Dynamics
5.2.1 Drivers
5.2.1.1 Growth in Food Retail Sector
5.2.1.2 Stringent Regulatory Reforms Across North America and Europe
5.2.1.3 Increasing Requirement of Temperature-Sensitive Drugs
5.2.1.4 Increasing Focus on Food Wastage Reduction
5.2.2 Restraints
5.2.2.1 High Installation Cost
5.2.3 Opportunities
5.2.3.1 Growing Trend of Online Grocery Shopping
5.2.3.2 Phasing Out of Fluorinated Refrigerants, Which Boosts Retrofit Market
5.2.4 Challenges
5.2.4.1 Complexities Involved in Installation of Refrigeration Monitoring Solutions in Cold Chains
5.3 Value Chain Analysis
5.4 Key Industry Trends
6 Refrigeration Monitoring Market, By Offering (Page No. - 52)
6.1 Introduction
6.2 Hardware
6.2.1 Sensors and Networking Devices to Hold the Largest Share of the Market
6.3 Software
6.3.1 Software Market to Grow at the Highest Rate Due to the Increasing Applications of Analytical and Predictive Tools
6.4 Service
6.4.1 Service Market is Expected to Grow Due to the Need for Regular Maintenance of Refrigeration Units
7 Refrigeration Monitoring Market, By Sensor (Page No. - 60)
7.1 Introduction
7.2 Temperature Sensors
7.2.1 Temperature Sensors are Most Widely Used in Food & Beverages and Pharmaceuticals
7.3 Defrost Sensors
7.3.1 Defrost Sensors Help Save Energy Costs Due to Overheating, Thus Driving the Market
7.4 Touch Sensors
7.4.1 Touch Sensors Market to Grow Rapidly in Cold Storage and Residential Sector
7.5 Liquid Level Sensors
7.5.1 Liquid Level Sensors are Widely Used to Monitor the Level of Refrigerant in Refrigeration Systems
7.6 Gas Detectors
7.6.1 Gas Detectors Find Application in Food & Beverages and Pharmaceuticals to Detect Leakage of Methane, Ammonia, Or Hydrogen
7.7 Contact Sensors
7.7.1 Contact Sensors are Used in Almost All Cold Refrigeration Units to Monitor the Door
7.8 Motion Detectors
7.8.1 Motion Detectors are Widely Used in the Retail Industry
7.9 Pressure Sensors
7.9.1 Pressure Sensors are Used to Detect Refrigerant Leakage and Prevent Overheating of the Compressor
7.1 AC Current Sensors
7.10.1 AC Current Sensors Help Measure Current Fluctuations
7.11 Water Detection Sensors
7.11.1 Water Detection Sensors Such as Water Detection Ropes are Widely Used in Cold Storage Units
8 Refrigeration Monitoring Market, By Application (Page No. - 69)
8.1 Introduction
8.2 Storage
8.2.1 Growth in Cold Storage Capacity in APAC Expected to Drive the Market During the Forecast Period
8.3 Transportation
8.3.1 Refrigeration Monitoring is Important to Minimize Losses Due to Temperature Variations in Transit
9 Refrigeration Monitoring Market, By Industry (Page No. - 76)
9.1 Introduction
9.2 Food & Beverages
9.2.1 Retail
9.2.1.1 Open-Shelf Refrigerators, Closed Cabinets, Display Cabinets, and Walk-In Refrigerators are the Key Units Contributing to the Market
9.2.2 Transportation
9.2.2.1 Deployment of Monitoring Solutions in Reefers and Refrigerated Containers Drives the Growth of the Market
9.2.3 Warehouses
9.2.3.1 Increasing Capacity of Cold Storage Warehouses Boosts the Market
9.3 Pharmaceuticals
9.3.1 Retail
9.3.1.1 Adoption of Inventory Management Solutions to Monitor Inventory of Temperature-Sensitive Drugs and Vaccines Contributes to Market
9.3.2 Transportation
9.3.2.1 Compliance Regulations to Transfer Temperature-Sensitive Drugs Through Refrigerated Vehicles Fuels Growth of Market
9.3.3 Warehouse
9.3.3.1 Temperature-Controlled Warehouses Play A Key Role in the Storage of Temperature-Sensitive Products
9.4 Chemicals
9.4.1 Refrigeration Monitoring is Essential in Chemicals Industry to Prevent Contamination of Volatile Chemicals
9.5 Hospitals
9.5.1 Refrigeration Monitoring is Essential in Hospitals to Store Specimens Such as Blood Samples, Vaccines, and Specialty Drugs
9.6 Residential
9.6.1 Increase in Spending Power Boosts the Sale of Smart Refrigerators, Contributing to Growth of Market
9.7 Others
9.7.1 Leisure and Hospitality are Key Contributors to the Growth of the Market
10 Refrigeration Monitoring Market, By Region (Page No. - 105)
10.1 Introduction
10.2 North America
10.2.1 US
10.2.1.1 US Expected to Lead Market in North America
10.2.2 Canada
10.2.2.1 Emphasis on Health and Sustainability is Expected to Drive the Market in Canada
10.2.3 Mexico
10.2.3.1 Government Regulations to Increase Demand for Refrigeration Monitoring in Mexico
10.3 Europe
10.3.1 Germany
10.3.1.1 Growing Pharmaceutical Industry and Innovation in the Transportation Sector Boost Demand for Refrigeration Monitoring in Germany
10.3.2 UK
10.3.2.1 Increasing Investment in R&D By Government Drives the Market in the UK
10.3.3 France
10.3.3.1 Strong Export Base of Agro-Food Sector Drives Market Growth in France
10.3.4 Rest of Europe
10.3.4.1 Growth in the Logistics Sector Spain, Russia, and the Netherlands to Drive the Market
10.4 APAC
10.4.1 China
10.4.1.1 Developing Consumer Class With High Purchasing Power Drives Market
10.4.2 Japan
10.4.2.1 Shift Toward Dual-Income Household Increases the Demand for Readymade and Packed Food Products in Japan
10.4.3 India
10.4.3.1 Market to Grow at the Highest Rate in India
10.4.4 Rest of APAC
10.4.4.1 South Korea, Malaysia, and Australia are Key Countries That Boost the Market
10.5 Rest of the World (RoW)
10.5.1 Middle East
10.5.1.1 Demand for International Cuisine and Organic Food Products From the Tourism Sector Boosts the Market in the UAE
10.5.2 Africa
10.5.2.1 Need for the Preservation of Specialty Drugs to Drive Market in Africa
10.5.3 South America
10.5.3.1 Export of Health and Wellness Foods Drives the Market in South America
11 Competitive Landscape (Page No. - 125)
11.1 Overview
11.2 Key Players in Refrigeration Monitoring Market
11.3 Competitive Leadership Mapping
11.3.1 Visionary Leaders
11.3.2 Dynamic Differentiators
11.3.3 Innovators
11.3.4 Emerging Companies
11.4 Competitive Benchmarking
11.4.1 Strength of Product Portfolio (25 Companies)
11.4.2 Business Strategy Excellence (25 Companies)
11.5 Competitive Scenario
11.5.1 Product Launches & Developments
11.5.2 Partnerships, Collaborations, and Agreements
11.5.3 Mergers & Acquisitions and Expansions
12 Company Profiles (Page No. - 135)
(Business Overview, Products & Solutions Offered, Recent Developments, SWOT Analysis, and MnM View)*
12.1 Introduction
12.2 Key Players
12.2.1 Emerson
12.2.2 Danfoss
12.2.3 TE Connectivity
12.2.4 Texas Instruments
12.2.5 Monnit
12.2.6 Zebra
12.2.7 Orbcomm
12.2.8 ContRoLAnt
12.2.9 Samsara
12.2.10 Smartsense (Digi International)
12.3 Other Companies
12.3.1 Berlinger
12.3.2 Tempmate (Imec Messtechnik GmbH)
12.3.3 TEK Troniks
12.3.4 Sensaphone
12.3.5 Swift Sensors
12.3.6 Proges-Plus
12.3.7 Episensor
12.3.8 Cargo Data Corporation
12.3.9 Vaisala
12.3.10 Oceasoft
*Details on Business Overview, Products & Solutions Offered, Recent Developments, SWOT Analysis, and MnM View Might Not Be Captured in Case of Unlisted Companies.
13 Appendix (Page No. - 167)
13.1 Insights of Industry Experts
13.2 Questionnaire for Market
13.3 Knowledge Store: Marketsandmarkets’ Subscription Portal
13.4 Available Customizations
13.5 Related Report
13.6 Author Details
List of Tables (107 Tables)
Table 1 Refrigeration Monitoring Market, By Offering, 2018–2025 (USD Million)
Table 2 Refrigeration Monitoring Hardware Market, By Type, 2018–2025 (USD Million)
Table 3 Refrigeration Monitoring Hardware Market, By Application, 2018–2025 (USD Billion)
Table 4 Refrigeration Monitoring Hardware Market, By Industry, 2018–2025 (USD Million)
Table 5 Refrigeration Monitoring Hardware Market, By Region, 2018–2025 (USD Million)
Table 6 Refrigeration Monitoring Software Market, By Application, 2018–2025 (USD Million)
Table 7 Refrigeration Monitoring Software Market, By Industry, 2018–2025 (USD Million)
Table 8 Refrigeration Monitoring Software Market, By Region, 2018–2025 (USD Million)
Table 9 Refrigeration Monitoring Services Market, By Application, 2018–2025 (USD Million)
Table 10 Refrigeration Monitoring Services Market, By Industry, 2018–2025 (USD Million)
Table 11 Refrigeration Monitoring Services Market, By Region, 2018–2025 (USD Million)
Table 12 Market, By Sensor, 2018–2025 (USD Million)
Table 13 Market for Temperature Sensors, By Industry, 2018–2025 (USD Million)
Table 14 Market for Defrost Sensors, By Industry, 2018–2025 (USD Million)
Table 15 Market for Touch Sensors, By Industry, 2018–2025 (USD Million)
Table 16 Refrigeration Monitoring Market for Liquid Level Sensors, By Industry, 2018–2025 (USD Million)
Table 17 Market for Gas Detectors, By Industry, 2018–2025 (USD Million)
Table 18 Market for Contact Sensors, By Industry, 2018–2025 (USD Million)
Table 19 Market for Motion Detectors, By Industry, 2018–2025 (USD Million)
Table 20 Market for Pressure Sensors, By Industry, 2018–2025 (USD Million)
Table 21 Market for AC Current Sensors, By Industry, 2018–2025 (USD Million)
Table 22 Market for Water Detection Sensors, By Industry, 2018–2025 (USD Million)
Table 23 Approximate Number of Refrigeration Units and Cold Storage Capacity in 2018
Table 24 Market, By Application, 2018–2025 (USD Billion)
Table 25 Market for Storage, By Offering, 2018–2025 (USD Million)
Table 26 Market for Storage, By Industry, 2018–2025 (USD Million)
Table 27 Market for Storage, By Sensor, 2018–2025 (USD Million)
Table 28 Market for Storage, By Region, 2018–2025 (USD Million)
Table 29 Market for Transportation, By Offering, 2018–2025 (USD Million)
Table 30 Market for Transportation, By Industry, 2018–2025 (USD Million)
Table 31 Market for Transportation, By Sensor, 2018–2025 (USD Million)
Table 32 Market for Transportation, By Region, 2018–2025 (USD Million)
Table 33 Refrigeration Monitoring Market, By Industry, 2018–2025 (USD Million)
Table 34 Market for Food & Beverages, By Offering, 2018–2025 (USD Million)
Table 35 Market in Storage for Food & Beverages, By Offering, 2018–2025 (USD Million)
Table 36 Market in Transportation for Food & Beverages, By Offering, 2018–2025 (USD Million)
Table 37 Market for Food & Beverages, By Sensor, 2018–2025 (USD Million)
Table 38 Market in Storage for Food & Beverages, By Sensor, 2018–2025 (USD Million)
Table 39 Market in Transportation for Food & Beverages, By Sensor, 2018–2025 (USD Million)
Table 40 Market for Food & Beverages, By Application, 2018–2025 (USD Million)
Table 41 Market for Food & Beverages, By Region, 2018–2025 (USD Million)
Table 42 Market for Food & Beverages, By Subapplication, 2018–2025 (USD Million)
Table 43 Market for Pharmaceuticals, By Offering, 2018–2025 (USD Million)
Table 44 Market in Storage for Pharmaceuticals, By Offering, 2018–2025 (USD Million)
Table 45 Market in Transportation for Pharmaceuticals, By Offering, 2018–2025 (USD Million)
Table 46 Market for Pharmaceuticals, By Sensor, 2018–2025 (USD Million)
Table 47 Market in Storage for Pharmaceuticals, By Sensor, 2018–2025 (USD Million)
Table 48 Market in Transportation for Pharmaceuticals, By Sensor, 2018–2025 (USD Million)
Table 49 Market for Pharmaceuticals, By Application, 2018–2025 (USD Million)
Table 50 Market for Pharmaceuticals, By Region, 2018–2025 (USD Million)
Table 51 Market for Pharmaceuticals, By Subapplication, 2018–2025 (USD Million)
Table 52 Market for Chemicals, By Offering, 2018–2025 (USD Million)
Table 53 Market in Storage for Chemicals, By Offering, 2018–2025 (USD Million)
Table 54 Market in Transportation for Chemicals, By Offering, 2018–2025 (USD Million)
Table 55 Market for Chemicals, By Sensor, 2018–2025 (USD Million)
Table 56 Market in Storage for Chemicals, By Sensor, 2018–2025 (USD Million)
Table 57 Market in Transportation for Chemicals, By Sensor, 2018–2025 (USD Million)
Table 58 Market for Chemicals, By Application, 2018–2025 (USD Million)
Table 59 Market for Chemicals, By Region, 2018–2025 (USD Million)
Table 60 Market for Hospitals, By Offering, 2018–2025 (USD Million)
Table 61 Refrigeration Monitoring Market in Storage for Hospitals, By Offering, 2018–2025 (USD Million)
Table 62 Market in Transportation for Hospitals, By Offering, 2018–2025 (USD Million)
Table 63 Market for Hospitals, By Sensor, 2018–2025 (USD Million)
Table 64 Market in Storage for Hospitals, By Sensor, 2018–2025 (USD Million)
Table 65 Market in Transportation for Hospitals, By Sensor, 2018–2025 (USD Million)
Table 66 Market for Hospitals, By Application, 2018–2025 (USD Million)
Table 67 Market for Hospitals, By Region, 2018–2025 (USD Million)
Table 68 Market for Residential, By Offering, 2018–2025 (USD Million)
Table 69 Market in Storage for Residential, By Offering, 2018–2025 (USD Million)
Table 70 Market in Transportation for Residential, By Offering, 2018–2025 (USD Million)
Table 71 Market for Residential, By Sensor, 2018–2025 (USD Million)
Table 72 Market in Storage for Residential, By Sensor, 2018–2025 (USD Million)
Table 73 Market in Transportation for Residential, By Sensor, 2018–2025 (USD Million)
Table 74 Market for Residential, By Location, 2018–2025 (USD Million)
Table 75 Market for Residential, By Region, 2018–2025 (USD Million)
Table 76 Market for Other Industries, By Offering, 2018–2025 (USD Million)
Table 77 Market in Storage for Other Industries, By Offering, 2018–2025 (USD Million)
Table 78 Market in Transportation for Other Industries, By Offering, 2018–2025 (USD Million)
Table 79 Market for Other Industries, By Sensor, 2018–2025 (USD Million)
Table 80 Market in Storage for Other Industries, By Sensor, 2018–2025 (USD Million)
Table 81 Refrigeration Monitoring Market in Transportation for Other Industries, By Sensor, 2018–2025 (USD Billion)
Table 82 Market for Other Industries, By Location, 2018–2025 (USD Million)
Table 83 Market for Other Industries, By Region, 2018–2025 (USD Million)
Table 84 Market, By Region, 2018–2025 (USD Million)
Table 85 Market in North America, By Offering, 2018–2025 (USD Million)
Table 86 Refrigeration Monitoring Hardware Market in North America, By Type, 2018–2025 (USD Million)
Table 87 Market in North America, By Application, 2018–2025 (USD Million)
Table 88 Market in North America, By Industry, 2018–2025 (USD Million)
Table 89 Market in North America, By Country, 2018–2025 (USD Million)
Table 90 Market in Europe, By Offering, 2018–2025 (USD Million)
Table 91 Refrigeration Monitoring Hardware Market in Europe, By Type, 2018–2025 (USD Million)
Table 92 Refrigeration Monitoring Market in Europe, By Application, 2018–2025 (USD Million)
Table 93 Market in Europe, By Industry, 2018–2025 (USD Million)
Table 94 Market in Europe, By Country, 2018–2025 (USD Million)
Table 95 Market in APAC, By Offering, 2018–2025 (USD Million)
Table 96 Refrigeration Monitoring Hardware Market in APAC, By Type, 2018–2025 (USD Million)
Table 97 Market in APAC, By Application, 2018–2025 (USD Million)
Table 98 Market in APAC, By Industry, 2018–2025 (USD Million)
Table 99 Market in APAC, By Country, 2018–2025 (USD Million)
Table 100 Market in RoW, By Offering, 2018–2025 (USD Million)
Table 101 Refrigeration Monitoring Hardware Market in RoW, By Type, 2018–2025 (USD Million)
Table 102 Market in RoW, By Application, 2018–2025 (USD Million)
Table 103 Market in RoW, By Industry, 2018–2025 (USD Million)
Table 104 Market in RoW, By Country, 2018–2025 (USD Million)
Table 105 Top 10 Product Launches & Developments, January 2016–December 2019
Table 106 Top 10 Partnerships, Collaborations, and Agreements, January 2016– December 2019
Table 107 Mergers & Acquisitions and Expansions, January 2016– December 2019
List of Figures (49 Figures)
Figure 1 Refrigeration Monitoring Market: Research Design
Figure 2 Market Size Estimation Methodology: Approach 1 (Supply Side): Revenue of Products of the Refrigeration Monitoring Component Market Size
Figure 3 Market Size Estimation Methodology: Approach 2 Bottom-Up (Supply Side): Illustration of Company Refrigeration Monitoring Component Revenue Estimation
Figure 4 Market Size Estimation Methodology: Approach 4 – Bottom-Up Market Estimation for Refrigeration Monitoring, By Sensor
Figure 5 Market Size Estimation Methodology: Bottom-Up Approach
Figure 6 Market Size Estimation Methodology: Top-Down Approach
Figure 7 Data Triangulation
Figure 8 Software Segment Expected to Grow at Highest CAGR During Forecast Period
Figure 9 Temperature Sensors to Grow at Highest Rate in Market During Forecast Period
Figure 10 Transportation Segment to Dominate the Market During the Forecast Period
Figure 11 Food & Beverages Expected to Witness Highest Growth Between 2020 and 2025
Figure 12 APAC to Hold Largest Market Share in 2019
Figure 13 Increasing Demand for High-Quality Packed Food Products to Spur Market Growth During Forecast Period
Figure 14 Hardware to Account for Largest Share of Market Till 2025
Figure 15 India to Record Highest CAGR in Overall Market During Forecast Period
Figure 16 Food & Beverages and China Likely to Be Largest Shareholders in Overall APAC Market in 2025
Figure 17 Refrigeration Monitoring Market Dynamics
Figure 18 Growth in Number of Convenience Stores in the US, 2010–2018
Figure 19 Market Drivers and Their Impact
Figure 20 Market Restraints and Their Impact
Figure 21 US: Online Share of Total Grocery Spending
Figure 22 Phase-Down of F-Gas Containing Substances From 2015 to 2030
Figure 23 Market Opportunities and Their Impact
Figure 24 Market Challenges and Their Impact
Figure 25 Value Chain Analysis of Market
Figure 26 Digital Transformation in Refrigeration Monitoring is the Key Trend for Market Growth
Figure 27 Market for Software to Grow at Highest CAGR During Forecast Period
Figure 28 Market for Temperature Sensors to Grow at Highest CAGR During Forecast Period
Figure 29 Storage to Account for Largest Share of Market
Figure 30 Food & Beverages to Account for Largest Share of Market Among All Industries (2020-2025)
Figure 31 Storage to Account for Largest Share of Market in Food & Beverages
Figure 32 Storage to Dominate the Market for Pharmaceuticals (2020-2025)
Figure 33 Storage to Account for Largest Share of Market in Chemicals (2020-2025)
Figure 34 Storage to Lead the Market in Hospitals (2020-2025)
Figure 35 Storage to Account for Largest Share of Market in Residential (2020-2025)
Figure 36 Storage to Hold the Largest Share of Market in Other Industries (2020-2025)
Figure 37 Market in APAC to Grow at Highest CAGR During Forecast Period
Figure 38 North America: Market Snapshot
Figure 39 Europe: Market Snapshot
Figure 40 APAC: Market Snapshot
Figure 41 Companies Adopted Product Launches & Developments as Key Growth Strategy From January 2016 to December 2019
Figure 42 Refrigeration Monitoring Market: Company Ranking Analysis (2019)
Figure 43 Market Competitive Leadership Mapping, 2019
Figure 44 Emerson: Company Snapshot
Figure 45 Danfoss: Company Snapshot
Figure 46 TE Connectivity: Company Snapshot
Figure 47 Texas Instruments: Company Snapshot
Figure 48 Zebra: Company Snapshot
Figure 49 Orbcomm: Company Snapshot
This study involved 4 major activities to estimate the size of the refrigeration monitoring market. Exhaustive secondary research was carried out to collect information relevant to the market, the peer market, and the parent market. Primary research was undertaken to validate these findings, assumptions, and sizing with industry experts across the value chain of the refrigeration monitoring. Both, the top-down and bottom-up approaches were employed to estimate the complete market size. After that, the market breakdown and data triangulation methods were used to estimate the size of different segments and subsegments of the market.
Secondary Research
The research methodology used to estimate and forecast the size of the refrigeration monitoring market began with capturing data related to the revenue of key vendors in the market through secondary research. This study involved the extensive use of secondary sources, directories, and databases (such as Hoovers, Bloomberg Businessweek, Factiva, and OneSource) to identify and collect information for a technical, market-oriented, and commercial study of the refrigeration monitoring market. Vendor offerings were taken into consideration to determine the market segmentation. The entire research methodology included the study of annual reports, press releases, and investor presentations of companies; white papers; and certified publications and articles by recognized authors, directories, and databases.
Primary Research
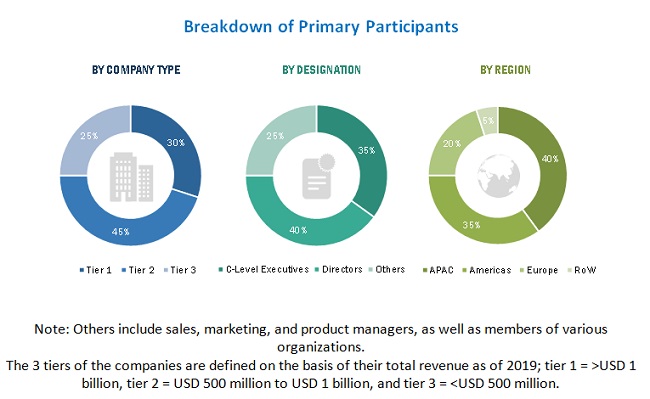
The refrigeration monitoring market comprises several stakeholders, such as suppliers of standard components, equipment manufacturers, and original equipment manufacturers (OEMs). The demand side of this market includes sensor, refrigerator, software, and service companies. The supply side is characterized by advancements carried out in refrigeration systems and cold chain using different techniques and their diverse applications. Various primary sources from both, the supply and demand sides of the market were interviewed to obtain qualitative and quantitative information. Following is the breakdown of primary respondents.
To know about the assumptions considered for the study, download the pdf brochure
Market Size Estimation
Both top-down and bottom-up approaches were used to estimate and validate the size of the refrigeration monitoring market and its segments. The research methodology used to estimate the market size included the following:
- Key players in the market were identified through extensive secondary research.
- The supply chain of the manufacturing industry and the size of the refrigeration monitoring market, in terms of value, were determined through primary and secondary research processes.
- All percentage shares, splits, and breakdowns were determined using secondary sources and verified through primary sources.
Data Triangulation
After arriving at the overall market size—using the estimation process explained above—the market has been split into several segments and subsegments. Data triangulation and market breakdown procedures have been employed, wherever applicable, to complete the overall market engineering process and arrive at the exact statistics of each market segment and subsegment. The data was triangulated by studying various factors and trends from both, the demand and supply sides of the refrigeration monitoring market.
Research Objectives
- To describe, segment, and forecast the overall size of the refrigeration monitoring market, by offering, sensor, application , industry, and region
- To describe and forecast the market size for various segments with regard to 4 main regions—Asia Pacific (APAC), North America, and Europe, and Rest of the World (RoW)
- To provide detailed information regarding major factors such as drivers, restraints, opportunities, and challenges influencing the growth of the market
- To describe the refrigeration monitoring value chain in brief
- To analyze competitive developments such as product launches and developments, agreements, partnerships, acquisitions, expansions, and research & development (R&D) activities in the market
Available Customizations
Along with the market data, MarketsandMarkets offers customizations according to the specific requirements of companies. The following customization options are available for the report:
Company Information
- Detailed analysis and profiling of additional market players (up to 5)
- Market size by different subsegments of the market
Critical Questions
- What are new application areas being explored by the providers of the refrigeration monitoring solution?
- Who are the key players in the refrigeration monitoring market, and how intense is the competition in this market?


Growth opportunities and latent adjacency in Refrigeration Monitoring Market