
Pressure Sensor Market Size, Share & Trends

Pressure Sensor Market by Sensing Method (Piezoresistive, Capacitive, Resonant Solid-State, Electromagnetic, Optical, MEMS, Acoustic), Type (Absolute, Gauge, Differential, Sealed, Vacuum), Range PSI (Up to 100, 101-1,000, <1,000) - Global Forecast to 2030


OVERVIEW
Source: Secondary Research, Interviews with Experts, MarketsandMarkets Analysis
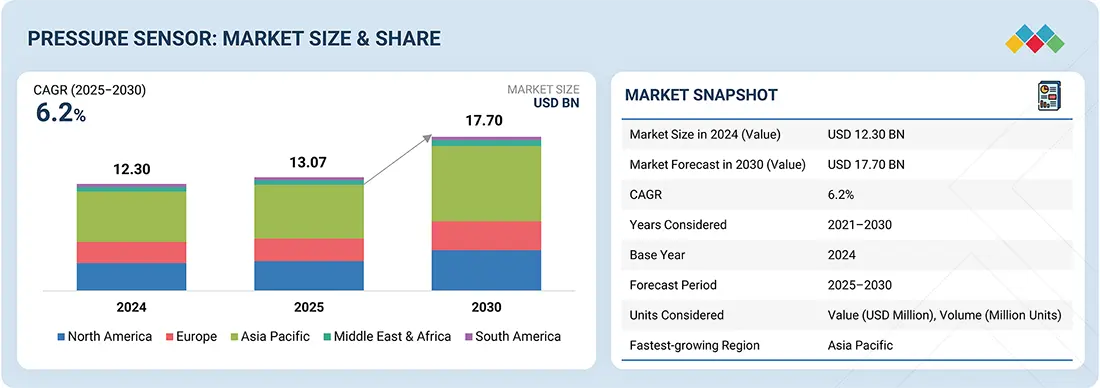
The pressure sensor market is projected to grow from USD 13.07 billion in 2025 to USD 17.70 billion by 2030, at a CAGR of 6.2% from 2025 to 2030. The market is witnessing strong growth due to rising demand across the automotive, industrial, medical, and consumer electronics sectors. In the automotive industry, the increasing integration of sensors for tire pressure monitoring systems (TPMS), engine control, and transmission systems is a key driver, especially with the global shift toward electric and hybrid vehicles.
Market Size & Forecast
KEY TAKEAWAYS
-
BY CONNECTIVITYThe pressure sensor market comprises wired and wireless connectivity, with wired forms used widely in industrial, automotive, and medical applications for superior signal reliability and immunity to interference. In contrast, wireless connectivity is critical in IoT-enabled systems, remote monitoring, and consumer electronics.
-
BY SENSING METHODSensing methods encompass piezoresistive, capacitive, resonant solid-state, electromagnetic, optical, and others, with piezoresistive holding the largest share for its high sensitivity, stability, and cost-effectiveness in automotive and medical uses.
-
BY SENSOR TYPESensor types include absolute and gauge for standard atmospheric and vacuum-relative measurements, differential for flow detection, sealed for moisture-resistant environments, and vacuum sensors for low-pressure systems in aerospace and industrial processes.
-
BY PRESSURE RANGEPressure ranges cover up to 100 psi for low-pressure applications like HVAC and medical devices, 101-1000 psi for medium industrial and automotive systems, and above 1000 psi for high-pressure sectors such as oil & gas and heavy machinery.
-
BY END USEEnd uses span automotive for TPMS and engine management, medical for blood pressure and respiratory monitoring, manufacturing and utilities for process control, aviation and oil & gas for harsh-condition sensing, marine for navigation, and consumer electronics for wearables and smart devices.
-
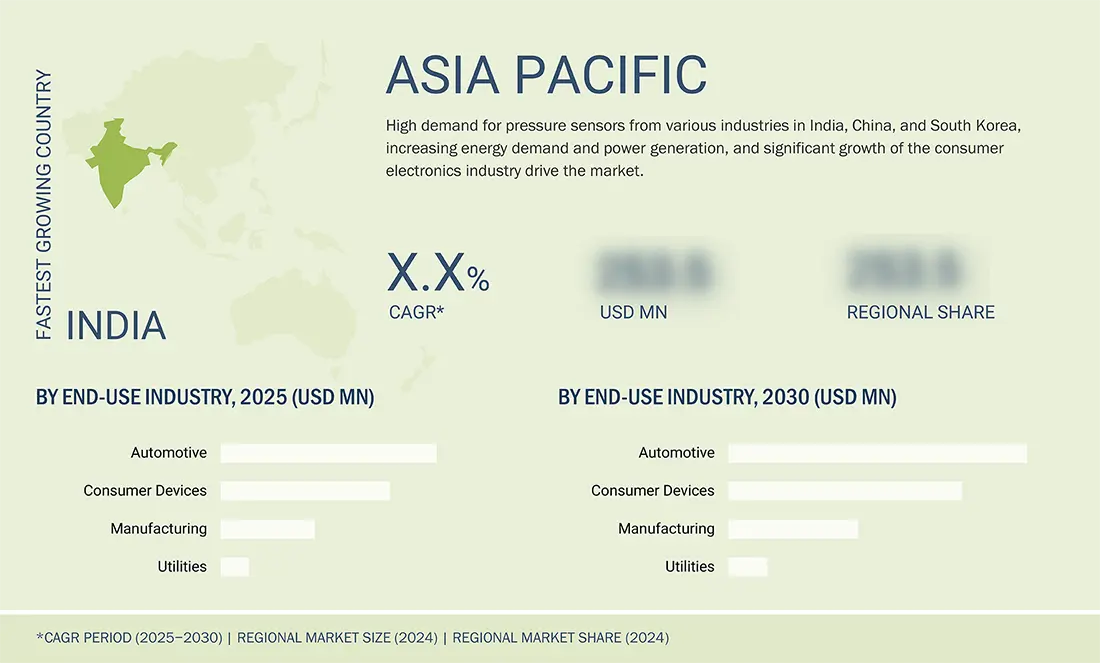
BY REGIONAsia Pacific is expected to register the highest CAGR of 7.0%, fueled by rapid industrialization, expanding automotive production, and strong consumer electronics demand in countries like China, Japan, and India.
-
COMPETITIVE LANDSCAPEThe major market players have adopted organic and inorganic strategies, including partnerships and investments. For instance, ABB and TE Connectivity have entered into several agreements and partnerships to cater to the growing demand for pressure sensors across innovative applications.
The pressure sensor market is projected to grow rapidly over the next decade, supported by advancements in IoT integration, automation, and smart technologies, alongside the shift towards efficient, data-driven industrial and consumer applications. Industries are increasingly turning to pressure sensors for their superior properties, precision, reliability, and versatility in wired or wireless connectivity, utilizing methods like piezoresistive and capacitive for absolute, gauge, or differential measurements across ranges up to 100 psi and beyond, making them essential in automotive, medical, manufacturing, aviation, oil & gas, and consumer devices.
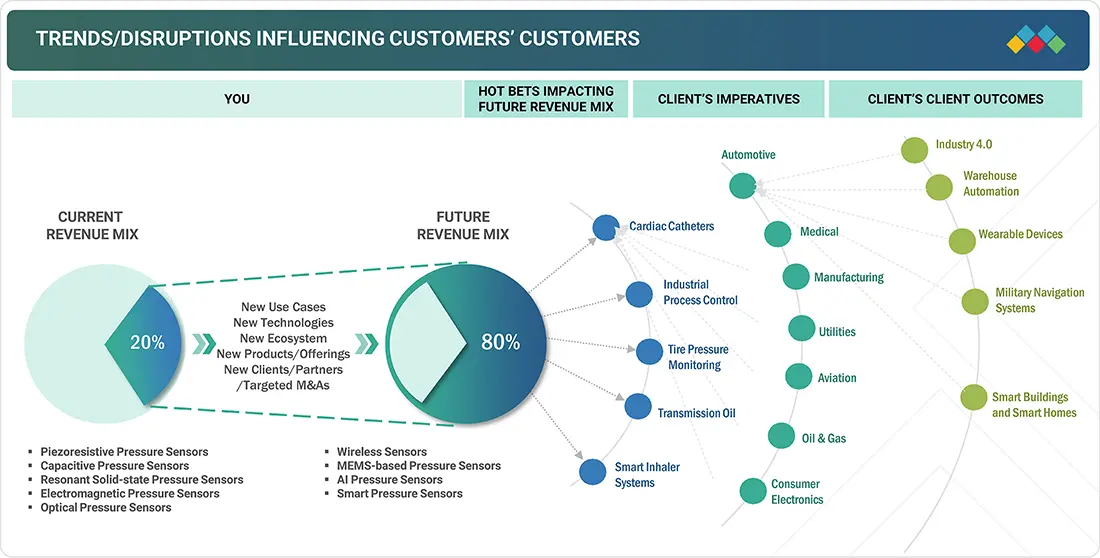
TRENDS & DISRUPTIONS IMPACTING CUSTOMERS' CUSTOMERS
The disruptions and emerging trends impacting customers’ businesses in the pressure sensor market include increasing demand for MEMS technology-based sensors and piezoresistive and capacitive sensing methods across various industries and sectors.
Source: Secondary Research, Interviews with Experts, MarketsandMarkets Analysis
MARKET DYNAMICS
Level
-
Rising adoption of microelectromechanical systems and miniaturization trends

-
Mounting demand for telemedicine, home healthcare, and wearable medical devices

Level
-
Need to adhere to stringent standards, regulations, and certifications

-
Integration complexities when incorporating sensors into legacy systems across industries

Level
-
Strong focus on enhancing functionality and user experience of consumer electronics

-
Rising implementation of IoT-enabled predictive maintenance programs

Level
-
Shrinking profit margins with declining prices and increasing competition

-
Managing supply chain disruptions that affect raw material availability and production timelines

Source: Secondary Research, Interviews with Experts, MarketsandMarkets Analysis
Driver: Rising adoption of microelectromechanical systems and miniaturization trends
The rising adoption of microelectromechanical systems (MEMS) and ongoing miniaturization trends are fuelling demand for pressure sensors across diverse applications. Compact, energy-efficient sensors are increasingly integrated into automotive, healthcare, and consumer electronics devices, enabling real-time monitoring, enhanced safety, and innovative features, thus driving significant market expansion across industrial and consumer sectors.
Restraint: Need to adhere to stringent standards, regulations, and certifications
The pressure sensor market faces restraints due to stringent standards, regulations, and certifications. Compliance requirements increase development timelines and costs, posing challenges for manufacturers to meet global safety and performance criteria.
Opportunity: Strong focus on enhancing functionality and user experience of consumer electronics
Strong emphasis on enhancing functionality and improving user experience in consumer electronics is creating lucrative opportunities. Pressure sensors are vital for smartphones, wearables, and IoT devices, supporting advanced features like altitude tracking, health monitoring, and environmental sensing. This growing integration into daily-use electronics continues to strengthen market demand and profitability.
Challenge: Shrinking profit margins with declining prices and increasing competition
Shrinking profit margins from declining product prices and rising competition present significant challenges. Companies must invest in innovation, cost optimization, and differentiation strategies to sustain growth and remain competitive.
Pressure Sensor Market: COMMERCIAL USE CASES ACROSS INDUSTRIES
| COMPANY | USE CASE DESCRIPTION | BENEFITS |
|---|---|---|
 |
Pressure sensors integrated in automotive engine management and safety systems | Optimized fuel efficiency, reduced emissions, enhanced vehicle safety |
 |
Industrial pressure sensors for oil & gas and process control applications | Real-time monitoring, improved operational safety, minimized downtime |
 |
MEMS-based miniature pressure sensors for medical devices such as ventilators and wearables | Accurate patient monitoring, compact design, reliable long-term performance |
 |
Automotive pressure sensors for braking, engine, and tire pressure monitoring systems | Improved vehicle safety, compliance with emission standards, enhanced fuel efficiency, extended tire life |
 |
Industrial pressure sensors for oil & gas, chemical, and power generation sectors | Increased process reliability, real-time monitoring, reduced downtime, improved safety in hazardous environments |
Logos and trademarks shown above are the property of their respective owners. Their use here is for informational and illustrative purposes only.
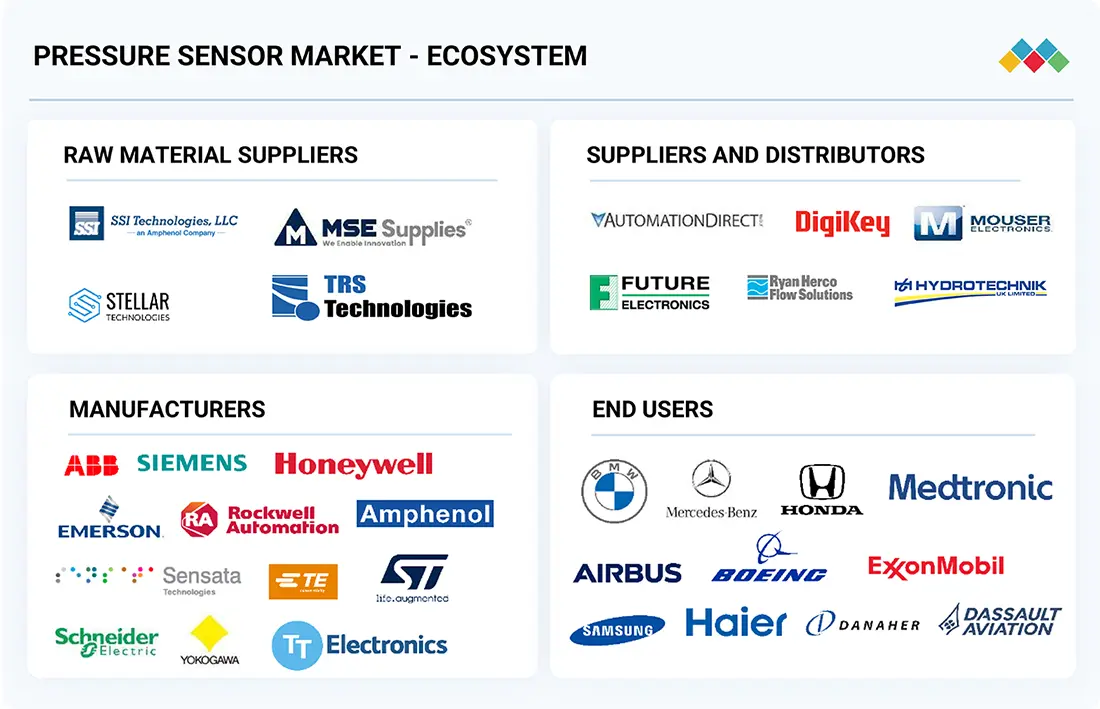
MARKET ECOSYSTEM
The pressure sensor ecosystem involves identifying and analysing interconnected relationships among stakeholders, including raw material suppliers, manufacturers, distributors, and end users. Raw material suppliers serve as manufacturers' source of silicon wafers and semiconductor materials. The distributors and suppliers act as those who establish direct contact between the manufacturing companies and end users to concentrate the supply chain, increasing operational efficiency and profitability.
Logos and trademarks shown above are the property of their respective owners. Their use here is for informational and illustrative purposes only.
MARKET SEGMENTS
Source: Secondary Research, Interviews with Experts, MarketsandMarkets Analysis
Pressure Sensor Market, by Connectivity
The wireless sensors segment is projected to witness the highest CAGR in the pressure sensor market during the forecast period, driven by rising demand for flexible, real-time monitoring and the expansion of Industrial IoT (IIoT). Wireless pressure sensors lower installation and maintenance costs by removing the need for complex wiring, making them highly suitable for retrofit applications and remote and hazardous environments.
Pressure Sensor Market, by Sensing method
The piezoresistive sensing method segment is projected to hold the largest share of the pressure sensor market by 2025, which is attributed to its superior sensitivity, stability, and seamless integration with MEMS technology. Capable of functioning in extreme conditions such as high temperatures, pressures, and corrosive environments, these sensors are well-suited for automotive, aerospace, medical, and industrial applications. Due to their precise measurement performance, they are extensively applied in engine control, tire pressure monitoring (TPMS), and transmission systems in the automotive sector.
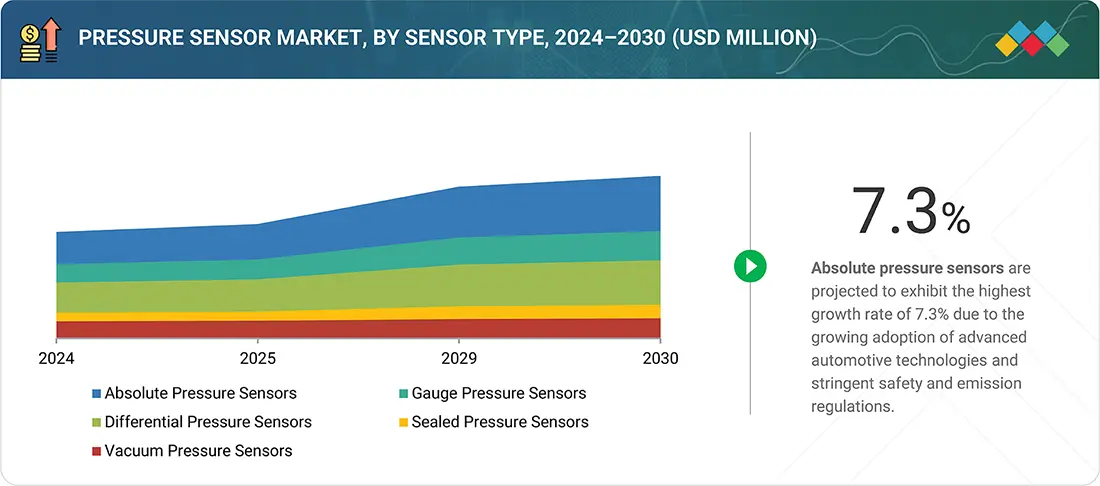
Pressure Sensor Market, by Sensor Type
In 2024, the absolute pressure sensor segment accounted for the largest share of the pressure sensor market, owing to its critical role in applications requiring accurate and stable measurements irrespective of environmental conditions. These sensors are indispensable in meteorology, industrial vacuum systems, and automotive engine control by measuring pressure relative to a perfect vacuum.
Pressure Sensor Market, by Pressure Range
The up to 100 psi segment captured the highest share in the pressure sensor market during the forecast period, driven by its widespread use in consumer electronics, medical devices, and low-pressure industrial applications. These sensors are essential for wearables, smartphones, ventilators, and HVAC systems, where compact size, accuracy, and cost efficiency are critical.
Pressure Sensor Market, by End Use
Between 2025 and 2030, the medical segment is expected to register the highest CAGR in the pressure sensor market. This growth is fuelled by rising demand for compact, highly accurate sensors in critical medical equipment. With greater global focus on patient monitoring and personalized healthcare, pressure sensors are vital in ventilators, blood pressure monitors, infusion pumps, and minimally invasive diagnostic devices.
REGION
Asia Pacific to be the fastest-growing region in the global pressure sensor market during the forecast period
The Asia Pacific region is projected to grow at the highest CAGR in the pressure sensor market during the forecast period, fuelled by rapid industrialization, expanding automotive production, and strong consumer electronics demand. Countries like China, Japan, South Korea, and India are driving adoption, supported by Industry 4.0 initiatives and healthcare advancements.
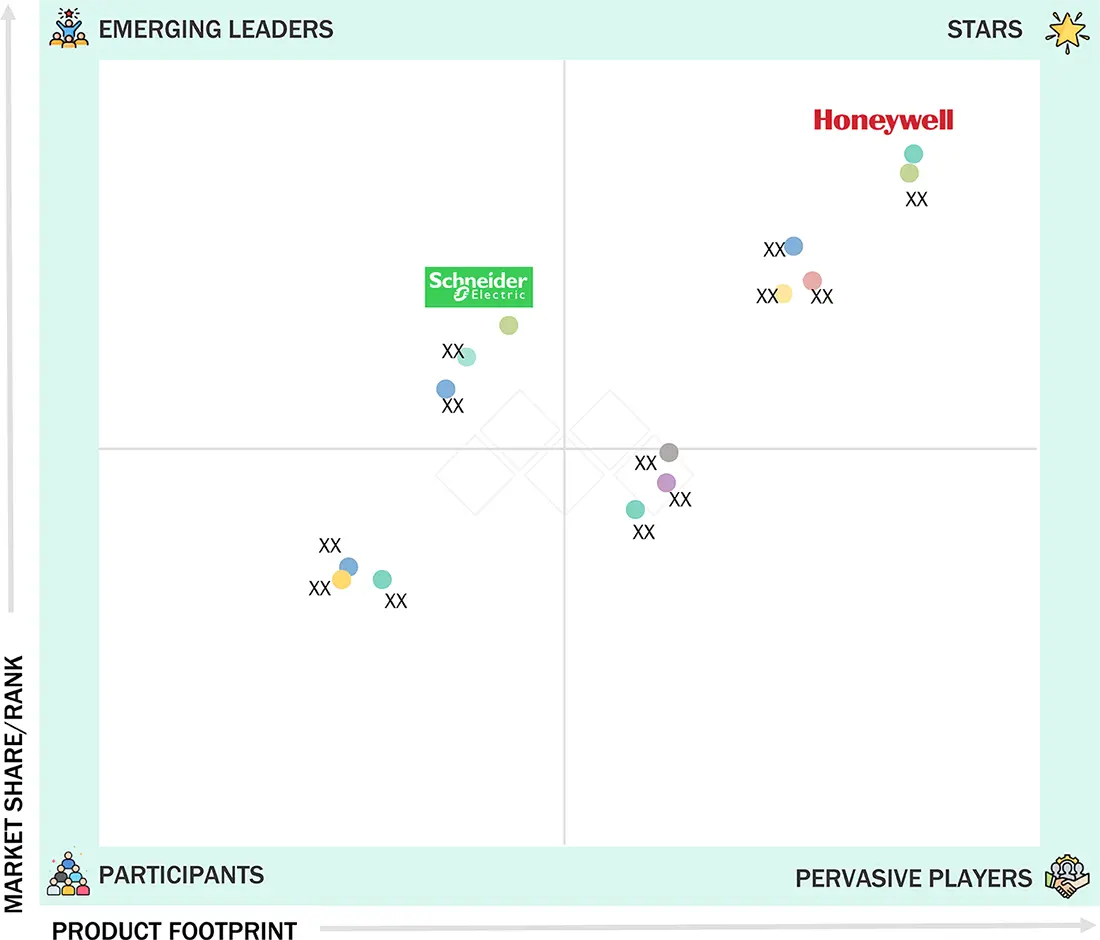
Pressure Sensor Market: COMPANY EVALUATION MATRIX
In the pressure sensor market matrix, Honeywell International (Star) leads with a strong market presence and an extensive product portfolio, enabling widespread adoption across automotive, industrial, and medical sectors. Schneider Electric (Emerging Leader) is steadily gaining traction with innovative sensor solutions focused on energy efficiency and smart applications. While Honeywell dominates through scale and established customer base, Schneider Electric demonstrates solid growth potential to advance toward the leaders’ quadrant.
Source: Secondary Research, Interviews with Experts, MarketsandMarkets Analysis
KEY MARKET PLAYERS
- Honeywell International Inc. (US)
- TE Connectivity (Switzerland)
- Sensata Technologies, Inc. (US)
- Emerson Electric Co. (US)
- Amphenol Corporation (US)
- ABB (Switzerland)
- TT Electronics (UK)
- Rockwell Automation (US)
- Schneider Electric (France)
- Siemens (Germany)
- STMicroelectronics (Switzerland)
- Infineon Technologies AG (Germany)
- NXP Semiconductors (Netherlands)
- Yokogawa Electric Corporation (Japan)
- Endress+Hauser Group Services AG (Switzerland)
MARKET SCOPE
| REPORT METRIC | DETAILS |
|---|---|
| Market Size in 2024 (Value) | USD 12.30 Billion |
| Market Forecast in 2030 (Value) | USD 17.70 Billion |
| Growth Rate | CAGR of 6.2% from 2025-2030 |
| Years Considered | 2021-2024 |
| Base Year | 2024 |
| Forecast Period | 2025-2030 |
| Units Considered | Value (USD Billion) and Volume (USD Million) |
| Report Coverage | Revenue forecast, company ranking, competitive landscape, growth factors, and trends |
| Segments Covered |
|
| Regions Covered | North America, Europe, Asia Pacific, and RoW |
WHAT IS IN IT FOR YOU: Pressure Sensor Market REPORT CONTENT GUIDE
DELIVERED CUSTOMIZATIONS
We have successfully delivered the following deep-dive customizations:
| CLIENT REQUEST | CUSTOMIZATION DELIVERED | VALUE ADDS |
|---|---|---|
| US-based Automotive OEM |
|
|
| European Medical Device Manufacturer |
|
|
| Asian Consumer Electronics Player |
|
|
| US-based Pressure Sensor Raw Material Supplier |
|
|
| Automotive Pressure Sensor Customer |
|
|
RECENT DEVELOPMENTS
- February 2025 : Honeywell International Inc. (US) announced a strategic collaboration with ForwardEdge ASIC (US), a Lockheed Martin subsidiary, to develop radiation-hardened microelectronics for space applications. Leveraging Honeywell’s proven foundry capabilities and ForwardEdge’s design expertise, the partnership aims to deliver high-reliability ASICs and memory solutions for satellites and defense systems.
- November 2024 : ABB (Switzerland) unveiled its new P-Series pressure transmitter portfolio at CIIE, featuring the P-100, P-300, and high-precision P-500 series. The transmitters, designed to enhance process control and energy efficiency, integrate digital technologies like Bluetooth, RFID, and advanced HMI, supporting industrial digital transformation across various sectors.
- April 2024 : TE Connectivity (Switzerland) expanded its wireless IoT pressure sensor lineup with the 65xxN (BLE-based) for short-range and 69xxN (LoRaWAN-based) for long-range coverage. These ultra-compact, low-power sensors enable efficient, real-time condition monitoring in industrial environments, supporting predictive maintenance and aligning with Industry 4.0 and smart factory trends.
- March 2024 : Amphenol Corporation (US) unveiled the AABP Series, a leadless miniature package pressure sensor, catering to diverse design needs with a focus on product support and supply chain stability. This new sensor line serves as a drop-in replacement for existing designs or transitions from competitors, ensuring compatibility and exceptional performance. The AABP Series emphasizes quality and reliability for various pressure sensing applications.
- January 2024 : Sensata Technologies, Inc. (US) unveiled the 129CP Series Digital Water Pressure Sensor, catering to water utilities for intelligent pressure monitoring and water conservation. This sensor integrates into water meter PCBs, offering reliable pressure monitoring from 0-232 psi in high-moisture environments. With digital I2C output and low power consumption, utilities can detect leaks swiftly and optimize water distribution efficiency.
Table of Contents
 Exclusive indicates content/data unique to MarketsandMarkets and not available with any competitors.
Methodology
The research process for this study included systematic gathering, recording, and analysis of data about customers and companies operating in the pressure sensor market. This process involved the extensive use of secondary sources, directories, and databases (Factiva and Oanda) to identify and collect valuable information for the comprehensive, technical, market-oriented, and commercial study of the Pressure sensor market.
In-depth interviews were conducted with primary respondents, including experts from core and related industries and preferred manufacturers, to obtain and verify critical qualitative and quantitative information and assess growth prospects. Key players in the pressure sensor market were identified through secondary research, and their market rankings were determined through primary and secondary research. This research included studying annual reports of top players and interviewing key industry experts, such as CEOs, directors, and marketing executives.
Secondary Research
Various sources were used in the secondary research process to identify and collect information crucial for this study. These include company annual reports, press releases, investor presentations, white papers, technology journals, certified publications, articles by recognized authors, directories, and databases. Secondary research was mainly used to obtain key information about the industry’s value chain, the total pool of market players, the market classification according to industry trends to the bottom-most level, regional markets, and key developments from market and technology-oriented perspectives.
Primary Research
Primary research was also conducted to identify the segmentation types, key players, competitive landscape, and key market dynamics, such as drivers, restraints, opportunities, challenges, and industry trends, along with key strategies adopted by players operating in the pressure sensor market. Extensive qualitative and quantitative analyses were performed on the complete market engineering process to list key information and insights throughout the report.
Extensive primary research has been conducted after acquiring knowledge about the pressure sensor market scenarios through secondary research. Several primary interviews have been conducted with experts from the demand (application and region) and supply side (solution type) across four major geographic regions: North America, Europe, Asia Pacific, and RoW. Approximately 60% and 40% of the primary interviews were conducted from the supply and demand sides. These primary data have been collected through questionnaires, emails, and telephonic interviews.

Note: The three tiers of the companies have been defined based on their total/segmental revenue as of 2024: Tier 1 = >USD 1 billion, Tier 2 = USD 1 billion–USD 500 million, and Tier 3 = USD 500 million. ‘Others’ include sales, marketing, and product managers.
To know about the assumptions considered for the study, download the pdf brochure
Market Size Estimation
In the complete market engineering process, the top-down and bottom-up approaches and several data triangulation methods were implemented to estimate and validate the size of the pressure sensor market and various other dependent submarkets. Key players in the market were identified through secondary research, and their market share in the respective regions was determined through primary and secondary research. This entire research methodology included the study of annual and financial reports of the top players and interviews with experts (CEOs, VPs, directors, and marketing executives) for key insights (quantitative and qualitative).
All percentage shares, splits, and breakdowns were determined using secondary sources and verified through primary sources. All the possible parameters that affect the markets covered in this research study were accounted for, viewed in detail, verified through primary research, and analyzed to obtain the final quantitative and qualitative data. This data was consolidated and supplemented with detailed inputs and analysis from MarketsandMarkets and presented in this report.
Pressure Sensor Market : Top-Down and Bottom-Up Approach

Data Triangulation
After arriving at the overall market size from the market size estimation process, as explained above, the total market has been split into several segments and subsegments. To complete the overall market engineering process and arrive at the exact statistics for all segments and subsegments, market breakdown and data triangulation procedures have been employed, wherever applicable. The data have been triangulated by studying various factors and trends from the demand and supply sides. Along with this, the market has been validated using top-down and bottom-up approaches.
Market Definition
A sensor is a device that measures the changes in physical quantities or environmental characteristics of any material and converts them into signals, which, in turn, serve as inputs for controlling different kinds of systems. A pressure sensor is a transducer or instrument that converts an input mechanical pressure in gases or liquids into an electrical output signal. It consists of a pressure-sensitive element that can measure, detect, or monitor the pressure applied to electronic components and convert the information into electrical output signals. The pressure sensor measures the pressure of various gases and liquids.
Key Stakeholders
- Raw material suppliers
- Technology investors
- Pressure sensor designers, manufacturers, and suppliers
- Pressure sensor integrators, suppliers, and service providers
- Government laboratories
- In-house testing laboratories
- System integrators
- Distributors, resellers, and traders
- Research institutions and organizations
- Providers of application software
- Pressure sensor forums, alliances, consortiums, and associations
- Market research and consulting firms
- End use
Report Objectives
- To describe and forecast the pressure sensor market, by connectivity, sensing method, sensor type, pressure range, and end use, in terms of value
- To describe and forecast the pressure sensor market, by end use, in terms of volume
- To forecast the market for various segments with regard to four main regions: North America, Europe, Asia Pacific, and the Rest of the World (RoW), in terms of value
- To provide a detailed overview of the smart textiles supply chain, ecosystem analysis, Porter’s five forces analysis, case studies, tariff analysis, regulations, pricing analysis, patent analysis, AI impact, and the 2025 US tariff impact
- To provide qualitative information regarding pressure sensors for different media types and technologies related to pressure sensors
- To analyze the micromarkets1 with respect to individual growth trends, prospects, and contributions to the total market
- To study the complete supply chain and allied industry segments, and perform a supply chain analysis of the pressure sensor landscape
- To strategically analyze the regulatory landscape, tariffs, standards, patents, Porter’s Five Forces, import and export scenarios, trade values, and case studies pertaining to the market under study
- To analyze the opportunities in the market for various stakeholders by identifying the high-growth segments of the pressure sensor market
- To profile the key players and comprehensively analyze their market position in terms of ranking and core competencies2, along with detailing the competitive landscape for market leaders
- To analyze competitive developments, such as product launches, acquisitions, partnerships, expansions, and macroeconomic outlook, in the pressure sensor market
Customization Options
With the given market data, MarketsandMarkets offers customizations according to the company’s specific needs. The following customization options are available for the report:
Key Questions Addressed by the Report
What strategies have been adopted by key companies in the pressure sensor market?
Product launches, partnerships, and contracts are some major strategies key players adopt to grow in the pressure sensor market.
Which region will dominate the pressure sensor market in the near future?
North America and Asia Pacific are expected to dominate the pressure sensor market during the forecast period.
Which sensing method will dominate the pressure sensor market between 2025 and 2030?
The piezoresistive segment is expected to dominate the pressure sensor market during the forecast period.
Why is the automotive segment expected to capture the largest share of the pressure sensor market in 2030?
The automotive segment will account for the largest market share in 2030 due to the widespread adoption of ADAS systems, Industry 4.0 practices, and the growing need for real-time pressure measurement in harsh environments.
What are the major companies in the pressure sensor market?
Major players in the pressure sensor market include Honeywell International Inc. (US), TE Connectivity (Switzerland), Sensata Technologies, Inc. (US), Emerson Electric Co. (US), Amphenol Corporation (US), ABB (Switzerland), TT Electronics (UK), Rockwell Automation (US), Schneider Electric (France), Siemens (Germany), STMicroelectronics (Switzerland), Infineon Technologies AG (Germany), NXP Semiconductors (Netherlands).
Need a Tailored Report?
Customize this report to your needs
Get 10% FREE Customization
Customize This ReportPersonalize This Research
- Triangulate with your Own Data
- Get Data as per your Format and Definition
- Gain a Deeper Dive on a Specific Application, Geography, Customer or Competitor
- Any level of Personalization
Let Us Help You
- What are the Known and Unknown Adjacencies Impacting the Pressure Sensor Market
- What will your New Revenue Sources be?
- Who will be your Top Customer; what will make them switch?
- Defend your Market Share or Win Competitors
- Get a Scorecard for Target Partners

Custom Market Research Services
We Will Customise The Research For You, In Case The Report Listed Above Does Not Meet With Your Requirements
Get 10% Free CustomisationTESTIMONIALS

Tetsuya Ohhira
Business Development Manager-Technology Business
Nikon Corporation,
Leading Japanese MNC specializing in optics and imaging productswww.nikon.com
MarketsandMarkets™ response
is quick. Their attitude is flexible and positive. Analyst Insights are globally considered and
significant. Client Services quickly respond to our inquiry and demand. Their wide range of global
surveys help us make our strategic plan.
We hope Knowledge Store will be easier to search
for a report.
VP - Marketing & Business Development
Leading Provider of Process Control Solutions
We engaged with MarketsandMarkets on a study to perform an analysis and recommend a Go-To-Market strategy for metrology and process control in the semiconductor market. The study was tailored to our targets and needs with well-defined milestones. Our overall experience with the MarketsandMarkets team was very good throughout the project in all aspects including the analysis methodologies used, the quality and depth of primary and secondary data sets, the professionalism and flexibility of the team and the ability to meet the target schedule and milestones. We want to thank MarketsandMarkets team for a job well done.
Growth opportunities and latent adjacency in Pressure Sensor Market


User
Sep, 2019
Global automotive sector have witnessed a steep decline in automotive sales. According to an estimate, global automotive sales is expected to witness a decline of more than 4 million units. For pressure sensor, automotive industry is the biggest end user. At what extent, downfall in automotive sales will affect pressure sensor demand? .
Basava
Mar, 2017
Interested to purchase report Pressure Sensors Market - Global Industry Analysis, Size, Shares, Trends, Segment & Forecast to 2020. Pressure Sensor Market by Technology (Piezo resistive, Capacitive, Electromagnetic, Others), Application (Automotive, Medical, Consumer Electronics, Others), & Geography (North America, South America, Europe, APAC, RoW) - Global Forecast to 2020.
User
Sep, 2019
Other than automotive industry, pressure sensor find its application in several end user industries including oil & gas, medical, and industrial applications. Among all the end user applications, which end user application is expected to witness an increase in demand in the coming years?.
User
Sep, 2019
Several industries have witnessed an increase in adoption of MEMS sensor due to its reduced size, low cost, and ease of integration. MEMS pressure sensor is also an increasing trend which will affect the market growth. For which end user applications, MEMS pressure sensor is expected to witness an increase in demand?.
User
Nov, 2019
Price of overall sensors including pressure sensor have came down over the years, supported by increasing penetration of smaller players in the market, miniaturization of technology, and decreasing raw material cost. To what extent, decrease in overall pricing of pressure sensor will affect revenue of companies?.
Max
Oct, 2015
Dear all, Would it be possible to buy single chapter of the report? If yes, could you please let me know the prices per chapter? .
Rudra
Sep, 2015
APAC is the leader in the pressure sensor market. How do you look towards the market in Middle East, and use of pressure sensor in exploration application in this region? Have you provided the estimates for pressure sensor in Middle East region for various applications?.
Joseph
Sep, 2018
Interested in market by application and geographic information regarding pressure sensors. I would like to see what kind of information is included in that section of the report..
Yuan
Aug, 2019
I am a student from reputed university in Germany. I am working on thesis about pressure sensors and I really need some of the marketing information. Can you please share me the sample of your market research report? It would be very nice of you..
Anthony
Apr, 2019
It would be great to have a profile of sensor market based on applications, the amount of pressure and the type of gas involved..
User
Mar, 2019
Several research companies release their shipment numbers either at the chip level or at the module level which alters the market size calculated in terms of value. For pressure sensor market, has the market size calculated on chip level or module level?.