Renewable Energy Policy FiT Analysis � by Technology (Solar, Wind, Geothermal and Bio Energy), by Tariff Period (5, 10, 13, 15, 20, and 25 years), by System Size (1 kW to 15 MW), and by Key Country - Installed Capacity and Targets to 2020


[178 Pages Report] Renewable energy is defined as the energy derived from natural sources, such as, sunlight and wind, among others. These sources replenish at a higher rate than they are consumed. As a result, unlike conventional sources, it will not deplete and hence can be reused. Renewable energy sources considered for this study include wind, solar, geothermal, and bio energy. The role of renewables in electricity generation has increased with time. Focus towards reducing air pollution, curbing global warming emissions, and decreasing dependence on coal & other fossil fuels globally are positively influencing the adoption of renewable energy technologies. Moreover, various countries such as the U.S., China, and Germany are providing incentives, including feed-in tariff, for power generation from renewable sources. This coupled with the increasing cost competitiveness of renewable energy sources when compared with other conventional power generation sources is also boosting the demand for renewable power generation.
Objectives of the Study
- To analyze the factors that are driving the implementation of renewable energy technologies across various countries
- To analyze the opportunities with regard to the implementation of renewable energy technologies
- To determine renewable energy installations in terms of different technologies for various countries from 2011 to 2015
- To determine the feed-in tariffs for various countries based on different technologies such as wind, solar, geothermal, and bio energy
- To determine the renewable energy targets towards different technologies such as wind, solar (PV), geothermal, and bio energy of various countries by 2020
Countries considered for the study
- U.S.
- Canada
- Brazil
- U.K.
- Germany
- France
- Italy
- China
- India
- Japan
Research Methodology
This research study involved extensive usage of secondary sources, related research publications, and Government websites (such as EIA, and IRENA, among others) to identify and collect information useful for this technical, market-oriented, and commercial study of renewable energy. The points mentioned below explain the research methodology applied in making this report.
- Major countries implementing renewable energy feed-in tariff policy have been identified in each region. In case of the U.S., state-wise data has been gathered
- Primary and secondary research has been conducted to determine the renewable energy installation across various countries for different technologies from 2011 to 2015
- Key renewable energy projects have been identified in terms of major technologies
- Based on all the gathered data, an analysis has been done to identify the best performing or promising technologies in respective countries
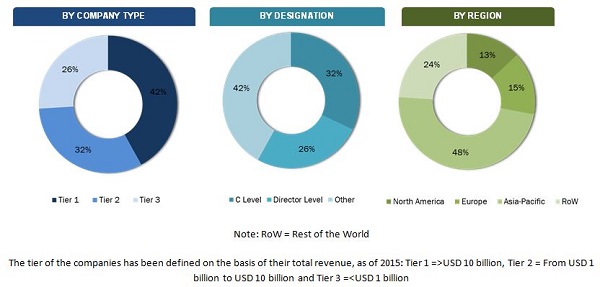
The figure given below shows the breakdown of the primaries on the basis of company type, designation, and region, conducted during the research study.
To know about the assumptions considered for the study, download the pdf brochure
Stakeholders
The stakeholders included in this report are as follows:
- Renewable energy EPC firms
- Power producers
- Government and industry associations
- Consulting companies of the energy and power sector
- Investment banks
�The study answers several questions for the stakeholders, primarily which technology to focus in the next 2�5 years for prioritizing efforts and investments.�
Scope of the Report
- By Technology
- Wind
- Solar
- Geothermal
- Bio Energy
Available Customizations
With the given data, MarketsandMarkets offers customizations as per the client�s specific needs. The following customization options are available for the report:
- Feed-in tariff rates and renewable energy installation (2011 to 2015) for a few more countries
Global focus towards reducing air pollution, curbing global warming emissions, and decreasing dependence on coal & other fossil fuels is positively influencing the adoption of renewable energy technologies. Moreover, incentives offered by the governments coupled with increasing cost competitiveness of renewable sources when compared with others of power generation are also boosting the demand for renewable power generation.
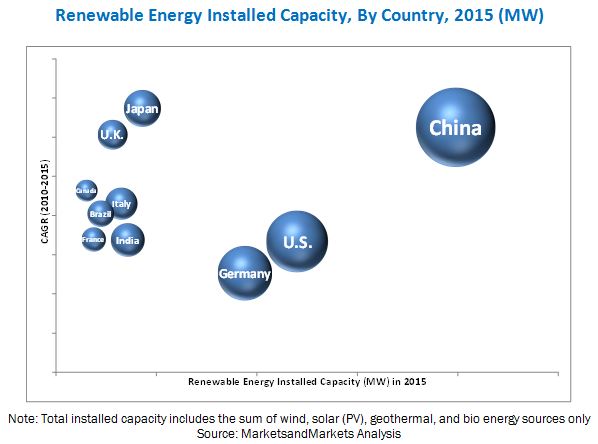
The report provides insights related to the different renewable energy technologies such as wind, solar, geothermal, and bio energy; their capacity addition from 2011 to 2015; renewable energy targets by 2020; key projects related to major technologies; and the feed-in tariff offered for each technology. The U.S., Canada, Brazil, the U.K., Germany, France, Italy, China, India, and Japan are the countries which have been considered for this study.
In terms of renewable energy installation, by technology, wind is a widely present renewable energy source, followed by solar, bio energy, and geothermal. It terms of adoption rate, solar is being widely adopted and deems to be a promising technology in the near future. Countries in North America, especially the U.S., and some major EU nations (such as Germany and France) have strict mandates for renewable energy technology adoption. Meanwhile, certain countries in Asia-Pacific such as China, India, and Japan are also actively involved in meeting the renewable energy targets. Incentives such as feed-in tariff are provided by the governments to enhance renewable energy technology adoption.
Some of the leading organizations present in the renewable energy value chain includes Ministry of Environment, Energy and the Sea (France), Ministry of New and Renewable Energy (India), Ontario Power Authority (Canada), Office of Gas & Electricity Markets, U.K. Government (U.K.), Ministry of Economy, Trade and Industry (Japan), Domion Virginia Power (U.S.), Tennessee Valley Authority (U.S.), Los Angeles Department of Water & Power (U.S.), Orcas Power & Light (U.S.), Green Mountain Power (U.S.), and Eugene Water & Electric Board (U.S.), among others.
To speak to our analyst for a discussion on the above findings, click Speak to Analyst
 Exclusive indicates content/data unique to MarketsandMarkets and not available with any competitors.
Table of Contents
1 Introduction (Page No. - 8)
2 Research Methodology (Page No. - 10)
2.1 Research Data
2.1.1 Secondary Data
2.1.1.1 Key Data From Secondary Sources
2.1.2 Primary Data
2.1.2.1 Key Data From Primary Sources
2.1.2.2 Key Industry Insights
2.1.2.3 Breakdown of Primaries
2.4 Research Assumptions & Limitations
2.4.1 Assumptions
2.4.2 Limitations
3 Executive Summary (Page No. - 22)
3.1 Introduction
3.2 Current Scenario
3.3 Future Trends
3.4 Conclusion
4 Renewable Sector Overview (Page No. - 28)
4.1 Introduction
4.2 Drivers and Opportunities
4.3 Electrification Rate
4.4 Renewable Energy Investment Trends
5 Renewable Energy Analysis (Page No. - 33)
5.1 Introduction
5.2 System Cost ($/MW)
5.3 Key Utility Scale Projects
5.4 Renewable Energy Target 2020, By Key Countries
5.5 Competitiveness � Key Countries vs Renewable Technology
6 Feed-In Tariff Rates (Solar, Wind, Bio-Energy, and Geothermal) (Page No. - 50)
6.1 Introduction
6.2 Americas
6.2.1 U.S.A*
6.2.1.1 Solar
6.2.1.2 Wind
6.2.1.3 Bio-Energy
6.2.1.4 Geothermal
*Include Fit Rates for Key 10 States - Virginia, Indiana, Washington, Maine, Vermont, Rhode Island, Oregon, California, Florida, and Hawaii
6.2.2 Canada
6.2.2.1 Solar
6.2.2.2 Wind
6.2.2.3 Bio-Energy
6.3 Europe
6.3.1 Germany.
6.3.1.1 Solar
6.3.1.2 Wind
6.3.1.3 Bio-Energy
6.3.2 U.K.
6.3.2.1 Solar
6.3.2.2 Wind
6.3.2.3 Bio-Energy
6.3.3 France
6.3.3.1 Solar
6.3.3.2 Wind
6.3.3.3 Bio-Energy
6.3.3.4 Geothermal
6.3.4 Italy
6.3.4.1 Solar
6.3.4.2 Wind
6.3.4.3 Bio-Energy
6.3.4.4 Geothermal
6.4 Asia-Pacific
6.4.1 China
6.4.1.1 Solar
6.4.1.2 Wind
6.4.1.3 Bio-Energy
6.4.2 India
6.4.2.1 Solar
6.4.2.2 Wind
6.4.2.3 Bio-Energy
6.4.3 Japan
6.4.3.1 Solar
6.4.3.2 Wind
6.4.3.3 Bio-Energy
6.4.3.4 Geothermal
7 Renewable Energy Installations, By Technology 2011-15 (Page No. - 140)
7.1 Key Findings
7.2 Americas
7.2.1 U.S.A
7.2.2 Canada
7.3 Europe
7.3.1 U.K.
7.3.2 Germany
7.3.3 France
7.3.4 Italy
7.4 Asia-Pacific
7.4.1 China
7.4.2 India
7.4.3 Japan
8 Company Profiles (Page No. - 147)
8.1 Introduction
8.2 First Solar, Inc
8.3 JUWI AG. ..
8.4 Sunedison Inc..
8.5 Hanwha Q Cells GmbH
8.6 Martifier Solar
8.7 Borea Construction ULC
8.8 Gamesa Corporation.
8.9 Prenecon S.A.
8.10 M.A. Mortenson Company.
8.11 Suzlon Energy
8.12 Black & Veatch Holding.
8.13 Areva.
8.14 AMEC Foster Wheeler PLC
8.15 Ormat Technologies Inc.
8.16 Mannvit.
9 Appendix (Page No. - 178)
List of Tables (35 Tables)
Table 1 Renewable Energy Installations, By Type, 2011-2015 (MW)
Table 2 Electrification Rate
Table 3 Renewable Energy Investment Trends
Table 4 System Cost ($/MW) Solar 2016
Table 5 System Cost ($/MW) Onshore Wind 2015
Table 6 System Cost ($/MW) Offshore Wind 2015
Table 7 Solar and Wind - Key Utility Scale Projects 2016
Table 8 Renewable Energy Targets By Key Countries to 2020
Table 9 California Feed-In Tariff for Solar, Wind, Bio-Energy
Table 10 Flotida Feed-In Tariff for Solar, Wind, Bio-Energy
Table 11 Hawaii Feed-In Tariff for Solar, Wind, Bio-Energy
Table 12 Indiana Feed-In Tariff for Solar, Wind, Bio-Energy
Table 13 Maine Feed-In Tariff for Solar, Wind, Bio-Energy
Table 14 Oregon Feed-In Tariff for Solar, Wind, Bio-Energy
Table 15 Rhode Island Feed-In Tariff for Solar, Wind, Bio-Energy
Table 16 Vermont Feed-In Tariff for Solar, Wind, Bio-Energy
Table 17 Virginia Feed-In Tariff for Solar, Wind, Bio-Energy
Table 18 Washington Feed-In Tariff for Solar, Wind, Bio-Energy, and Geothermal
Table 19 Canada Feed-In Tariff for Solar, Wind, Bio-Energy
Table 20 Germany Feed-In Tariff for Solar, Wind, Bio-Energy
Table 21 U.K. Feed-In Tariff for Solar, Wind, Bio-Energy
Table 22 France Feed-In Tariff for Solar, Wind, Bio-Energy, and Geothermal
Table 23 Italy Feed-In Tariff for Solar, Wind, Bio-Energy, and Geothermal
Table 24 China Feed-In Tariff for Solar, Wind, Bio-Energy
Table 25 India Feed-In Tariff for Solar, Wind, Bio-Energy
Table 26 Japan Feed-In Tariff for Solar, Wind, Bio-Energy, and Geothermal
Table 27 USA Renewable Energy Installations By Technology 2011-15
Table 28 Canada Renewable Energy Installations By Technology 2011-15
Table 29 U.K. Renewable Energy Installations By Technology 2011-15
Table 30 Germany Renewable Energy Installations By Technology 2011-15
Table 31 France Renewable Energy Installations By Technology 2011-15
Table 32 Italy Renewable Energy Installations By Technology 2011-15
Table 33 China Renewable Energy Installations By Technology 2011-15
Table 34 India Renewable Energy Installations By Technology 2011-15
Table 35 Japan Renewable Energy Installations By Technology 2011-15
List of Figures (27 Figures)
Figure 1 Assumptions of the Research Study
Figure 2 Limitations of the Research Study
Figure 3 Americas Renewable Energy Installations 2011-15
Figure 4 Europe Renewable Energy Installations 2011-15
Figure 5 Asia-Pacific Renewable Energy Installations 2011-15
Figure 6 Attractive Market Opportunities in the Renewable Energy Sector
Figure 7 Electricity Consumption in Major Countries, 2008�2014 (In TWH)
Figure 8 System Cost ($/MW) Solar vs Wind, 2015-16
Figure 9 System Cost ($/MW) Onshore Wind vs Offshore Wind, 2015
Figure 10 Renewable Energy Targets By Key Countries to 2020
Figure 11 Competitiveness � Key Countries vs Renewable Technologies
Figure 12 Investment in Renewable Energy, By Region, 2014 (USD Billion)
Figure 13 First Solar, Inc.: Company Snapshot
Figure 14 JUWI AG.: Company Snapshot
Figure 15 Sunedison Inc.: Company Snapshot
Figure 16 Hanwha Q Cells GmbH: Company Snapshot
Figure 17 Martifier Solar: Company Snapshot
Figure 18 Borea Construction ULC: Company Snapshot
Figure 19 Gamesa Corporation: Company Snapshot
Figure 20 Prenecon S.A.: Company Snapshot
Figure 21 M.A. Mortenson Company.: Company Snapshot
Figure 22 Suzlon Energy: Company Snapshot
Figure 23 Black & Veatch Holding: Company Snapshot
Figure 24 Areva: Company Snapshot
Figure 25 AMEC Foster Wheeler PLC: Company Snapshot
Figure 26 Ormat Technologies Inc: Company Snapshot
Figure 27 Mannvit.: Company Snapshot


Growth opportunities and latent adjacency in Renewable Energy Policy FiT Analysis