Floating Power Plant Market by Power Source (Non-Renewable (Gas Turbines, IC Engines), Renewable (Solar Panels, Solar Floating Structure, Wind Turbines, Wind Substructure)), Capacity, and Region - Global Forecast to 2022


The global floating power plant market is expected to grow from an estimated USD 889.6 Million in 2017 to USD 1,440.1 Million by 2022, at a CAGR of 10.11%, from 2017 to 2022. The factors driving the market include increasing demand for power, coupled with the lack of power infrastructure, benefits over land based power plants (majorly as it eliminates the land acquisition related problems), and energy efficiency mandates and demand for clean energy (renewable energy source).
Request for Customization to get the global Floating Power Plant Market forecast to 2024
Objectives of the Study
- To define, describe, and forecast the global floating power plant market on the basis of power source, capacity, and region
- To provide a detailed information on major factors influencing the growth of the market, such as drivers, restraints, opportunities, and industry-specific challenges
- To strategically analyze the micro-markets with respect to components used in floating power plants, analyzing individual growth trends, future prospects, and contribution to the global market
- To analyze market size and trends for major components involved in floating power plants
- To analyze market opportunities for stakeholders and details of the competitive landscape for market leaders supplying floating power plant components
- To forecast market size of segments with respect to major regions, namely, North America, Europe, Asia-Pacific, and the rest of the world (South & Central America and the Middle East & Africa)
- To strategically profile key players and comprehensively analyze their market shares and core competencies
- To benchmark players within the market using the proprietary Vendor DIVE framework, which analyzes market players which supply key components to the market. The vendor dive analysis is based on various parameters within broad categories of business and product strategies
- To track and analyze developments in the market, such as new product and technology launches, expansions, mergers & acquisitions, contracts & agreements, and partnerships, collaborations, alliances, and joint ventures
- Core competencies of the companies are captured in terms of their key developments, and key strategies adopted by them to sustain their position in the market
Research Methodology
This research study involves the extensive usage of secondary sources, directories, press releases, industry white papers, presentations, company annual reports, and databases of articles, journals on power barges, power ships, offshore wind turbines, floating wind sub-structure, solar panels, and floating solar structures; and information portals, such as Hoover�s, Bloomberg, Businessweek, Factiva, and OneSource; and other publicly available sources to identify and collect information useful for this technical, market-oriented, and commercial study of the global floating power plant market. The points mentioned below explain the research methodology applied in this report.
- Analysis of all the operational and upcoming floating power plant projects across the globe
- Analysis of country-wise industrial growth for power generation for the past 5 years
- Estimation of the cost of key components used in floating power plants across various regions using the cost variant models
- Analysis of the market trends in various regions and countries supported by floating power plant equipment manufacturers and EPC companies
- Overall market size values are finalized by triangulation with the supply-side data which includes product developments, supply chain, and annual deliveries of the equipment used in the floating power plant industry across the globe
After arriving at the overall market size, the total market has been split into several segments and sub-segments. The figure given below shows the breakdown of primaries on the basis of company type, designation, and region.
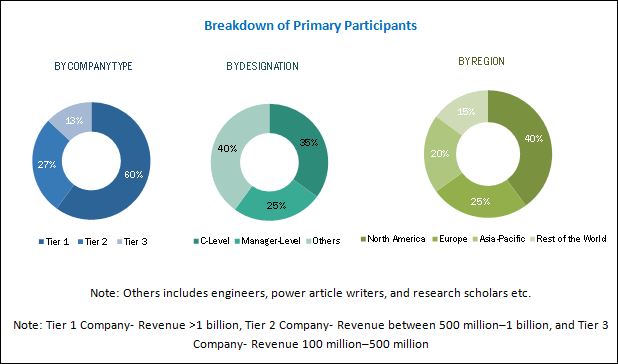
To know about the assumptions considered for the study, download the pdf brochure
Market Ecosystem
Stakeholders
The stakeholders included in this report are as follows:
- Consulting companies of the energy and power sector
- Electrical infrastructure providers
- Electric utilities
- Environmental and regional solar power associations
- Gas turbine and IC engine manufacturers
- Government and research organizations
- Investment banks
- Investors and financial community professionals
- Public and private operators of power barges and power ships
- Solar floating solution manufacturers
- Solar panel manufactures
- Wind farm owners, operators, and developers
- Wind sub-structure manufacturers
- Wind turbine manufacturers
The study answers several questions for stakeholders, primarily which market segments to focus on, in the next two to five years to prioritize efforts and investments.
Scope of the Report
- By Power Source:
- Non-renewable
- Gas turbines
- IC engines
- Renewable
- Solar
- Solar panels
- Floating structures
- Solar
- Wind
- Wind turbines
- Sub-structures
- Non-renewable
- By Capacity
- 1 MW�5 MW
- 5.1 MW�20 MW
- 20.1 MW�100 MW
- 100.1 MW�250 MW
- Above 250 MW
- By Region
- Renewable regions
- North America
- Europe
- Asia-Pacific
- Rest of the World (South & Central America (Brazil))
- Non-renewable regions
- North America
- Asia-Pacific
- Middle East & Africa
- South & Central America
- Floating power plant regions (Combined)
- North America
- Europe
- Asia-Pacific
- Rest of the World (Middle East & Africa, South & Central America, and Rest of the World (Brazil))
- Renewable regions
Available Customizations
With the given market data, MarketsandMarkets offers customizations as per the client�s specific needs. The following customization options are available for the report:
- Detailed analysis and profiling of additional market players (up to five)
- Country-wise analysis can be extended by one country for every region
The global floating power plant market is expected to grow from an estimated USD 889.6 Million in 2017 to USD 1,440.1 Million by 2022, at a CAGR of 10.11%, from 2017 to 2022. The factors driving the market of floating power plant includes increasing demand for power, coupled with the lack of power infrastructure, benefits over land based power plants (majorly as it eliminates the land acquisition related problems), and energy efficiency mandates and demand for clean energy (renewable energy source).
The report segments the floating power plant market, by power source, into renewable and non-renewable power sources. The non-renewable power segment holds a major share, and this is majorly due to the lack of power infrastructure, coupled with the upsurge in energy demand. The renewable power source segment is estimated to be the fastest growing segment, due to the increasing demand for energy efficiency mandates and demand for clean energy (renewable energy source). Floating solar and wind have seen a rise in installations, owing to its benefits over the land based solar plants and the offshore wind farms. The floating solar energy source consists of key components, such as solar panel and floating structures.
The report segments the floating power plant market, by capacity, into, 1 MW to 5 MW, 5.1 MW to 20 MW, 20.1 MW to 100 MW, 100.1 MW to 250 MW, and above 250 MW. The capacity segment above 250 MW is projected to dominate the market of floating power plant till 2022. The 20.1 MW to 100 MW capacity segment is estimated to be the fastest growing segment, owing to the increase in projects for floating solar and wind.
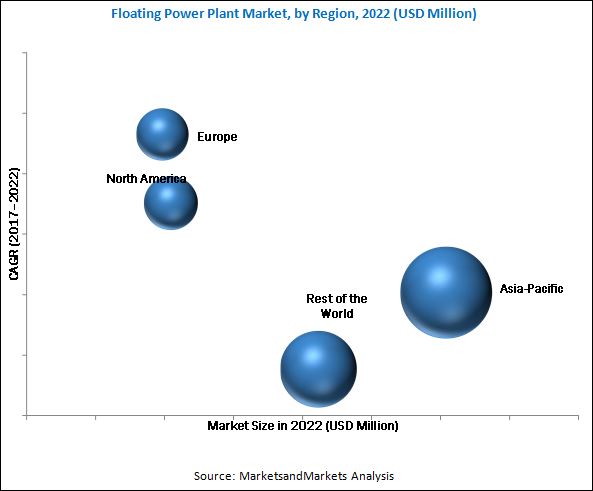
The report segments the combined (i.e. the renewable and non-renewable) global floating power plant market by region, into, North America, Europe, Asia-Pacific, and the rest of the world. The European region is expected to be the fastest growing segment of the floating power plant industry, as the European region has the highest offshore wind potential and the countries in the region are focusing on energy generation from renewable sources. The market in the rest of the world dominated the market in 2016, owing to the rise in demand from the Middle East and African countries which was closely followed by the Asia-Pacific region. The market in the Asia-Pacific region is projected to dominate the market by 2022, Owing to the rise in renewable floating power plants in countries such as Japan and China.
High capital cost associated with transportation, logistics, and accessibility issues is a key restraint for the growth of the market.
Some of the leading players in the global floating power plant market of floating power plant include MAN Diesel & Turbo SE (Germany), Mitsubishi Corporation (Japan), Wartsila (Finland), General Electric Company (U.S.), Siemens AG (Germany), Caterpillar, Inc. (U.S.), Ciel & Terre International (France), Floating Power Plant A/S (Denmark), Ideol (France), Kyocera Corporation (Japan), Principle Power, Inc.(U.S.), Upsolar (Hong Kong), Vikram Solar Pvt., Ltd. (India), Yingli Solar (China), and SeaTwirl AB (Sweden), among others.
Contracts & agreements, and partnerships, collaborations, alliances, and joint ventures have been the key growth strategies adopted by companies to strengthen their portfolios and enhance their client bases in the floating power plant market. The other common strategies employed were new product launches, expansions, and mergers & acquisitions.
To speak to our analyst for a discussion on the above findings, click Speak to Analyst
 Exclusive indicates content/data unique to MarketsandMarkets and not available with any competitors.
Table of Contents
1 Introduction (Page No. - 15)
1.1 Objectives of the Study
1.2 Market Definition
1.3 Market Scope
1.3.1 Markets Covered
1.3.2 Countries Covered
1.3.3 Years Considered for the Study
1.4 Currency
1.5 Limitations
1.6 Stakeholders
2 Research Methodology (Page No. - 19)
2.1 Research Data
2.1.1 Secondary Data
2.1.1.1 Key Data From Secondary Sources
2.1.1.1 Key Data From Primary Sources
2.1.1.2 Key Industry Insights
2.1.1.3 Break-Up of Primaries
2.2 Market Size Estimation
2.2.1 Bottom-Up Approach
2.2.2 Top-Down Approach
2.3 Market Breakdown & Data Triangulation
2.4 Research Assumptions
3 Executive Summary (Page No. - 27)
4 Premium Insights (Page No. - 32)
4.1 Floating Power Plant Market Overview
4.2 Market, By Power Source
4.3 Market: Energy Source & Region
4.4 Market, By Capacity (2017�2022)
5 Market Overview (Page No. - 36)
5.1 Introduction
5.2 Market Dynamics
5.2.1 Drivers
5.2.1.1 Demand for Clean Energy to Drive Renewable Market
5.2.1.2 Increasing Demand for Power, Coupled With the Lack of Power Infrastructure
5.2.1.3 Benefits Over Land Based Power Plants
5.2.2 Restraints
5.2.2.1 High Capital Cost Associated With Transportation, Logistics, & Accessibility Issues
5.2.3 Opportunities
5.2.3.1 Developments in Floating Wind Farms
5.2.3.2 R&D in Floating Power Plants
5.2.4 Challenges
5.2.4.1 Growth in Distributed Energy Generation Affecting the Non-Renewable Generation
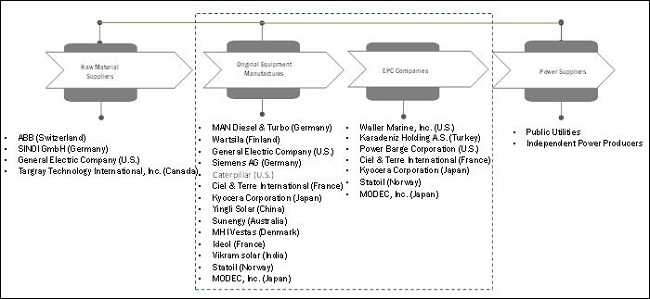
5.3 Supply Chain Overview
5.3.1 Key Influencers
5.3.1.1 Raw Material Suppliers
5.3.1.2 Original Equipment Manufacturers
5.3.1.3 Engineering Procurement Construction (EPC) Company
5.3.1.4 Power Suppliers
5.4 Upcoming Technologies & Trends in the Floating Power Plants Industry
5.4.1 Non-Renewable Floating Power Plants Industry
5.4.1.1 Nuclear Floating Power Plants- the Next Big Thing
5.4.2 Renewable Floating Power Plants Industry
5.4.2.1 Technologies in Solar Floating Power Plants
5.4.2.2 Technologies in Wind Floating Power Plants
6 Market, By Power Source (Page No. - 48)
6.1 Introduction
6.2 Renewable Power Source
6.2.1 Renewable, By Energy Source
6.2.1.1 Solar
6.2.1.1.1 Solar, By Key Components
6.2.1.1.1.1 Solar Panels
6.2.1.1.1.2 Solar Floating Structure
6.2.1.2 Wind
6.2.1.2.1 Wind, By Key Components
6.2.1.2.1.1 Wind Turbines
6.2.1.2.1.2 Wind Sub-Structure
6.3 Non-Renewable Power Source
6.3.1.1 By Key Components
6.3.1.1.1 Gas Turbines
6.3.1.1.2 Ic Engines
7 Market, By Capacity (Page No. - 60)
7.1 Introduction
7.2 0 MW�5 MW
7.3 5.1 MW�20 MW
7.4 20.1 MW�100 MW
7.5 100.1 MW�250 MW
7.6 Above 250 MW
8 Market, By Region (Page No. - 66)
8.1 Introduction
8.2 Asia-Pacific
8.2.1 Floating Power Plant Market, By Power Source
8.2.2 Renewable Market, By Energy Source
8.2.3 By Key Components
8.2.3.1 Non-Renewable, By Key Components
8.2.3.2 Renewable, By Key Components
8.2.4 By Capacity
8.2.5 By Country
8.2.5.1 Japan
8.2.5.2 China
8.2.5.3 India
8.2.5.4 Rest of Asia-Pacific
8.3 Europe
8.3.1 Floating Power Plant Market, By Power Source
8.3.2 Renewable Market, By Energy Source
8.3.3 By Key Components
8.3.3.1 Renewable, By Key Components
8.3.4 By Capacity
8.3.5 By Country
8.3.5.1 U.K.
8.3.5.2 Italy
8.3.5.3 The Netherlands
8.3.5.4 France
8.3.5.5 Portugal
8.3.5.6 Rest of Europe
8.4 North America
8.4.1 Floating Power Plant Market, By Power Source
8.4.2 By Key Components
8.4.2.1 Non-Renewable, By Key Components
8.4.2.2 Renewable, By Key Components
8.4.3 By Capacity
8.4.4 By Country
8.4.4.1 U.S.
8.5 Rest of the World
8.5.1 Floating Power Plant Market, By Power Source
8.5.2 Renewable Market, By Energy Source
8.5.3 By Key Components
8.5.3.1 Non-Renewable, By Key Components
8.5.3.2 Renewable, By Key Components
8.5.4 By Capacity
9 Competitive Landscape (Page No. - 98)
9.1 Overview
9.2 Key Players in the Market
9.2.1 Growth Strategies in the Market
9.3 Market Ranking, Floating Power Plant Market, 2016
9.4 Competitive Situation & Trends
9.5 Floating Power Plant (Global): Competitive Leadership Mapping
9.5.1 Visionary Leaders
9.5.2 Innovators
9.5.3 Dynamic
9.5.4 Emerging
9.6 Strength of Product Portfolio (For All 25 Players)
9.7 Business Strategy Excellence (For All 25 Players)
10 Company Profiles (Page No. - 106)
(Overview, Strength of Product Portfolio , Business Strategy Excellence , Products Offering, Recent Development�s, Business Strategy)*
10.1 General Electric Company
10.2 Siemens AG
10.3 W�rtsil� Corporation
10.4 Kyocera Corporation
10.5 Mitsubishi Corporation
10.6 Caterpillar Inc.
10.7 Yingli Green Energy Holding Company Limited
10.8 Ciel & Terre International
10.9 Vikram Solar Pvt. Ltd.
10.10 Principle Power, Inc.
10.11 MAN Diesel & Turbo SE
10.12 Ideol SA
10.13 Seatwirl AB
10.14 Upsolar Global Co., Ltd
10.15 Floating Power Plant A/S
*Details on Overview, Strength of Product Portfolio, Business Strategy Excellence, Products Offering, Recent Development�s, Business Strategy Might Not Be Captured in Case of Unlisted Companies.
11 Appendix (Page No. - 157)
11.1 Insights of Industry Experts
11.2 Discussion Guide
11.3 Knowledge Store: Marketsandmarkets� Subscription Portal
11.4 Introducing RT: Real-Time Market Intelligence
11.5 Available Customizations
11.6 Related Reports
11.7 Author Details
List of Tables (76 Tables)
Table 1 Global Floating Power Plant Market Snapshot
Table 2 Potential Floating Offshore Wind Regions
Table 3 List of Key Projects in Pipeline for Floating Offshore Wind
Table 4 Floating Power Plants Market Size, By Power Source, 2015�2022 (USD Million)
Table 5 Renewable Market Size, By Region, 2015�2022 (USD Million)
Table 6 Renewable Floating Power Plants Market Size, By Energy Source, 2015�2022 (USD Million)
Table 7 Solar Floating Power Plants Market Size, By Region, 2015�2022 (USD Million)
Table 8 Solar Floating Power Plants Market Size, By Key Components, 2015�2022 (USD Million)
Table 9 Solar Panels Market Size, By Region, 2015�2022 (USD Million)
Table 10 Solar Floating Structure Market Size, By Region, 2015�2022 (USD Million)
Table 11 Wind Floating Power Plants Market Size, By Region, 2015�2022 (USD Million)
Table 12 Wind Floating Power Plants Market Size, By Key Components, 2015�2022 (USD Million)
Table 13 Wind Turbine Market Size, By Region, 2015�2022 (USD Million)
Table 14 Wind Sub-Structure Market Size, By Region, 2015�2022 (USD Million)
Table 15 Non-Renewable Floating Power Plants Market Size, By Region, 2015�2022 (USD Million)
Table 16 Non-Renewable Floating Power Plants Market Size, By Key Components, 2015�2022 (USD Million)
Table 17 Gas Turbines Market Size, By Region, 2015�2022 (USD Million)
Table 18 Ic Engines Market Size, By Region, 2015�2022 (USD Million)
Table 19 Global Market Size (By Value), By Capacity, 2015�2022 (USD Million)
Table 20 0 MW�5 MW: Floating Power Plants Market Size (By Value), By Region, 2015�2022 (USD Million)
Table 21 5.1 MW�20 MW: Floating Power Plants Market Size (By Value), By Region, 2015�2022 (USD Million)
Table 22 20.1 MW�100 MW: Market Size (By Value), By Region, 2015�2022 (USD Million)
Table 23 100.1 MW�250 MW: Floating Power Plants Market Size (By Value), By Region, 2015�2022 (USD Million)
Table 24 Above 250 MW: Market Size (By Value), By Region, 2015�2022 (USD Million)
Table 25 Floating Power Plants Market Size, By Region, 2015�2022 (USD Million)
Table 26 Asia-Pacific: Market, By Power Source, 2015�2022 (USD Million)
Table 27 Asia-Pacific: Renewable Floating Power Plants Market, By Energy Source, 2015�2022 (USD Million)
Table 28 Asia-Pacific: Non-Renewable Market Size, By Key Components, 2015�2022 (USD Million)
Table 29 Asia-Pacific: Renewable Market Size, By Key Components, 2015�2022 (USD Million)
Table 30 Asia-Pacific: Market, By Capacity, 2015�2022 (USD Million)
Table 31 Asia-Pacific: Renewable Market, By Country, 2015�2022 (USD Million)
Table 32 Asia-Pacific: Solar Renewable Market, By Country, 2015�2022 (USD Million)
Table 33 Asia-Pacific: Wind Renewable Market, By Country, 2015�2022 (USD Million)
Table 34 Japan: Renewable Market, By Energy Source, 2015�2022 (USD Million)
Table 35 Japan: Solar Renewable Market, By Key Components, 2015�2022 (USD Million)
Table 36 Japan: Wind Renewable Market, By Key Components, 2015�2022 (USD Million)
Table 37 China: Renewable Market, By Energy Source, 2015�2022 (USD Million)
Table 38 China: Solar Renewable Market, By Key Components, 2015�2022 (USD Million)
Table 39 India: Renewable Market, By Energy Source, 2015�2022 (USD Million)
Table 40 India: Solar Renewable Market, By Key Components, 2015�2022 (USD Million)
Table 41 Rest of Asia-Pacific: Renewable Market, By Energy Source, 2015�2022 (USD Million)
Table 42 Rest of Asia-Pacific: Solar Renewable Market, By Key Components, 2015�2022 (USD Thousand)
Table 43 Europe: Market, By Power Source, 2015�2022 (USD Million)
Table 44 Europe: Renewable Market, By Energy Source, 2015�2022 (USD Million)
Table 45 Europe: Renewable Market Size, By Key Components, 2015�2022 (USD Million)
Table 46 Europe: Floating Power Plant, By Capacity, 2015�2022 (USD Million)
Table 47 Europe: Renewable Market, By Country, 2015�2022 (USD Thousand)
Table 48 Europe: Solar Renewable Market, By Country, 2015�2022 (USD Thousand)
Table 49 Europe: Wind Renewable Market, By Country, 2015�2022 (USD Million)
Table 50 U.K.: Renewable Market, By Energy Source, 2015�2022 (USD Million)
Table 51 U.K.: Solar Renewable Market, By Key Components, 2015�2022 (USD Million)
Table 52 U.K.: Wind Renewable Market, By Key Components, 2015�2022 (USD Million)
Table 53 Italy: Renewable Market, By Energy Source, 2015�2022 (USD Million)
Table 54 Italy: Solar Renewable Market, By Key Components, 2015�2022 (USD Thousand)
Table 55 The Netherlands: Renewable Market, By Energy Source, 2015�2022 (USD Thousand)
Table 56 The Netherlands: Solar Renewable Market, By Key Components, 2015�2022 (USD Thousand)
Table 57 France: Renewable Market, By Energy Source, 2015�2022 (USD Million)
Table 58 France: Wind Renewable Market, By Key Components, 2015�2022 (USD Million)
Table 59 Portugal: Renewable Market, By Energy Source, 2015�2022 (USD Million)
Table 60 Portugal: Solar Renewable Market, By Key Components, 2015�2022 (USD Thousand)
Table 61 Rest of Europe: Renewable Market, By Energy Source, 2015�2022 (USD Million)
Table 62 Rest of Europe: Wind Renewable Market, By Key Components, 2015�2022 (USD Million)
Table 63 North America: Market Size, By Power Source, 2015�2022 (USD Million)
Table 64 North America: Non-Renewable Market Size, By Key Components, 2015�2022 (USD Million)
Table 65 North America: Renewable Market Size, By Key Components, 2015�2022 (USD Million)
Table 66 North America: Market Size, By Capacity, 2015�2022 (USD Million)
Table 67 North America: Renewable Market Size, By Country, 2015�2022 (USD Million)
Table 68 U.S.: Renewable Market Size, By Energy Source, 2015�2022 (USD Million)
Table 69 U.S.: Solar Market Size, By Key Components, 2015�2022 (USD Million)
Table 70 U.S.: Wind Market Size, By Key Components, 2015�2022 (USD Million)
Table 71 Rest of the World: Market Size, By Power Source, 2015�2022 (USD Million)
Table 72 Rest of the World: Renewable Market Size, By Energy Source, 2015�2022 (USD Million)
Table 73 Rest of the World: Non-Renewable Market Size, By Key Components, 2015�2022 (USD Million)
Table 74 Rest of the World: Solar Renewable Market Size, By Key Components, 2015�2022 (USD Million)
Table 75 Rest of the World: Market Size, By Capacity, 2015�2022 (USD Million)
Table 76 Floating Power Plant Market Ranking, Market, 2016
List of Figures (39 Figures)
Figure 1 Floating Power Plant Market: Research Design
Figure 2 Floating Power Plant Size Estimation Methodology: Bottom-Up Approach
Figure 3 Floating Power Plant Size Estimation Methodology: Top-Down Approach
Figure 4 Data Triangulation Methodology
Figure 5 Asia-Pacific is Expected to Dominate the Market, By 2022
Figure 6 Renewable Segment is Expected to Grow at A Faster Rate From 2017�2022
Figure 7 Above 250 MW Segment Dominated the Market in 2016
Figure 8 Contracts & Agreements Was the Key Strategy Adopted By Players in the Market
Figure 9 Demand for Clean Energy is Expected to Drive the Market in the Future
Figure 10 The Renewable Power Source Segment is Expected to Lead in Terms of the Market Growth From 2017 to 2022
Figure 11 Asia-Pacific Contributed the Maximum Share of the Renewable Market in 2016
Figure 12 20.1 MW�100 MW Capacity Segment is Expected to Grow at the Highest Rate During the Forecast Period
Figure 13 Non-Renewable Market, By Key Components (2017)
Figure 14 Renewable Market, By Key Components (2017)
Figure 15 Floating Power Plant Industry Dynamics for Floating Power Plants
Figure 16 Global CO2 Emissions From the Fossil Fuel & Cement Production, 1990�2015 (Kton CO2 Per Year)
Figure 17 Global: Historical Investment in Renewable Energies
Figure 18 Net Electricity Generation in OECD and Non-OECD Economies
Figure 19 Floating Power Plant Supply Chain
Figure 20 Non-Renewable Power Source Segment is Expected to Dominate the Market During the Forecast Period
Figure 21 Solar Floating Power Plant, By Component, 2016 (USD Million)
Figure 22 Wind Floating Power Plant, By Component, 2017 and 2022
Figure 23 Global Market (By Value), By Capacity (2017 & 2022)
Figure 24 Regional Snapshot: the European Market is Expected to Be the Fastest Growing Market, By CAGR, During the Forecast Period
Figure 25 Floating Power Plant, By Region, 2017�2022
Figure 26 Regional Snapshot: Asia-Pacific Offered Attractive Market Opportunities in 2016
Figure 27 Regional Snapshot: Europe is Expected to Be the Fastest Growing Market During the Forecast Period
Figure 28 Companies Adopted Contracts & Agreements as the Key Growth Strategy, 2013�2017
Figure 29 Floating Power Plant Evaluation Framework, 2013�2017
Figure 30 Battle for Market Share (2013�2017): Contracts & Agreements Was the Key Strategy Adopted By Players in the Market
Figure 31 Competitive Leadership Mapping 2016
Figure 32 General Electric Company: Company Snapshot
Figure 33 Siemens AG : Company Snapshot
Figure 34 W�rtsil� Corporation: Company Snapshot
Figure 35 Kyocera Corporation: Company Snapshot
Figure 36 Mitsubishi Corporation: Company Snapshot
Figure 37 Caterpillar Inc.: Company Snapshot
Figure 38 Yingli Green Energy Holding Company Limited: Company Snapshot
Figure 39 MAN Diesel & Turbo SE: Company Snapshot


Growth opportunities and latent adjacency in Floating Power Plant Market