Retail Analytics Market

Retail Analytics Market by Application (Merchandising Analysis, Customer Analytics, and Promotional Analysis and Planning), Business Function (Finance and Operations), Component, Organization Size, End User, and Region - Global Forecast to 2025

Report Code: TC 2663 Oct, 2020, by marketsandmarkets.com

Retail Analytics Market Analysis, Industry Size and Forecast

The global Retail Analytics Market size was crossed $4.3 billion in 2020 and is anticipated to exhibit a CAGR of 21.2% to reach USD 11.1 billion by the end of 2025. The retail analytics industry growth is driven by major factors such as rising demand for dashboards for data visualization, growing adoption of cloud and continuous increase in data generation.

Attractive Opportunities in the Retail Analytics Market

To know about the assumptions considered for the study, Request for Free Sample Report

Market Dynamics

Driver:  Digitalizing to enhance customer experience and retail operations

As digital acceleration takes hold, the global retail and consumer goods community is adapting more quickly than anyone ever thought possible. Enterprises and users have started realizing that digital transformation is about taking a data-driven approach to every aspect of their business to create a competitive advantage. For example, for a retailer, digital transformation might be about providing real-time best offers while customers are in physical stores or optimizing inventory to provide a better online and in-store experience. Digital transformation in retail can boost customer retention and satisfaction by offering customers the services and products they need. The fourth industrial revolution (Industry 4.0) is defined by emerging technologies that blur lines between the digital and physical worlds. Combined with powerful analytics tools, including scenario analysis, predictive learning algorithms and visualization, access to data is transforming how companies perform. Companies can now collect vast data sets from physical facilities and assets in real-time, execute advanced analytics to generate new insights and make more effective decisions. The digital revolution is transforming the way products are designed, developed, and delivered to customers. It offers tremendous implications for the retail value chain.

Restraint: Lack of technology adoption by unorganized retail sector

Technology is being used by large retail outlets for routine activities like billing and payments, prevention of shrinkage, keeping records of stock, and supply chain management. Solutions like retail analytics are used to get insights related to sales, inventory, customers, and other important aspects crucial for the decision-making process; CRM tools ensure improved customer relationship management; and ERP tools facilitate other activities. While large companies are making the most of such technologies, the unorganized retail sector has to deal with the limited availability, feasibility and adoption of technology. Unorganized retailers are facing pressure from deep-pocketed offline, modern trade outlets and from the e-commerce bandwagon, and while they may want to use technology to move forward, they are often held back by budget constraint. The hidden costs of maintaining archaic legacy systems can quickly become burdensome, leaving no budget for innovation or digital transformation. The high cost of capital and difficulties in accessing capital funding have significantly deterred the growth and upgrades of such retail businesses, especially in the rural and remote areas.

Opportunity: Proliferation of data analytics to understand customer data during COVID-19 

Organizations are setting up analytics capabilities in a matter of weeks to inform business responses to COVID-19 challenges and prepare for the future. Companies will need to leverage powerful data and analytical capabilities to predict and act upon fluctuating baselines during and post-COVID-19. The retail market is becoming more and more competitive, and it has become crucial to optimize business processes while satisfying customer expectations. Data analytics is being implemented at all stages of the retail process; it helps to keep track of all emerging products, forecast sales and predict future demand. It can also be used to optimize placements of offers and products via the heat-mapping of customers. Using analytics, customers who are interested in specific products can be identified quickly and effectively based on their past purchases. This helps retailers create targeted marketing campaigns. 

Challenge: Retailers face a data deficit in the wake of the COVID-19 pandemic

The retail sector is finding it challenging to get business back on track after being under complete lockdown for almost three months. Like other customer-driven sectors, retail too thrives on customer behavior and engagement, and is struggling to keep up with lockdown-induced changes in customer behavior. Along with plummeting sales, retail is facing a data deficit. This data is normally the key to ensuring enhanced customer experience. With the drying up of such crucial information based on sales, the retail sector has lost access to relevant insights to sustain customer loyalty schemes, AI-driven products, and services recommendations. It has also affected strategies for marketing and business decisions. All types of retail organizations have been affected by this lack of data, whether independent or chain, brick-and-mortar or e-commerce, or startup or established entities..

Among applications, the inventory analysis segment to grow at the highest CAGR during the forecast period

The retail analytics market is segmented into various applications, such as merchandising analysis, pricing analysis, customer analytics, promotional analysis and planning, yield analysis, inventory analysis, and others (order management, transportation management, assortment and cluster planning, and real-estate planning). The merchandising analysis segment is estimated to hold a largest market share in 2020. The growth of the segment is due to companies across the retail industry using advanced technologies to leverage customer insights from huge data volumes of store-based operations. The inventory analysis segment is projected to register a higher CAGR during the forecast period due to the growing need to enhance business processes by keeping track of stocked goods and ensure surplus inventory.

The operation business function to grow at the highest CAGR during the forecast period

The retail analytics market by business function has been segmented into four segments, namely, marketing and sales, finance, operations, and human Resources. The finance business function segment is estimated to hold a larger market share in 2020. The operations segment is projected to grow at the highest CAGR during the forecast period. The growth can be attributed to the rising need of retailers to generate deeper insights across the entire value chain of retail operations, including procurement, supply chain, sales and marketing, store operations, and customer management. 

Asia Pacific to grow at the highest CAGR during the forecast period

The North American retail analytics market is estimated to hold the largest share in 2020. The major countries in the North American retail analytics market are the US and Canada. The US is one of the most dominant markets, as it is an early adopter of technology, and large enterprises in the country invest significantly in various technologies to maintain competitiveness. APAC is expected to record the highest CAGR during the forecast period, as it is home to many developed and emerging economies, which offer major opportunities for the growth of retail stores and technology development. China, India, and Japan in particular are focusing on the management of data to enable data-based business decisions and enhance business processes in the retail market.

Retail Analytics Market By Region

To know about the assumptions considered for the study, download the pdf brochure

Retail Analytics Market By Region

Key Market Players

The retail analytics vendors have implemented various types of organic as well as inorganic growth strategies, such as new product launches, product upgradations, partnerships and agreements, business expansions, and mergers and acquisitions, to strengthen their offerings in the market. The major vendors in the global retail analytics market include Microsoft (US), IBM (US), Oracle (US), Salesforce (US), SAP (Germany), AWS (US), SAS Institute (US), Qlik (US), Manthan (India), Bridgei2i (India), MicroStrategy (US), Teradata (US), HCL (India), Fujitsu (Japan), Domo (US), Google (US), FLIR Systems (US), Information Builders (US), 1010Data (US), Capillary (Singapore), RetailNext (US), WNS (India), True Fit (US), Vend (New Zealand), Fit Analytics (Geramny),  Edited (UK), Decision6 (Brazil), Cubelizer (Spain), ThinkInside (Italy), Dor Technology (US), Glimpse Analytics (India), Pygmalios (Slovakia), and Orenda Software Solutions (Canada).  The study includes an in-depth competitive analysis of these key players in the retail analytics market with their company profiles, recent developments, and key market strategies.

Get online access to the report on the World's First Market Intelligence Cloud

  • Easy to Download Historical Data & Forecast Numbers
  • Company Analysis Dashboard for high growth potential opportunities
  • Research Analyst Access for customization & queries
  • Competitor Analysis with Interactive dashboard
  • Latest News, Updates & Trend analysis
Request Sample

Scope of the Report

Report Metrics

Details

Market size available for years

2016–2025

Base year considered

2019

Forecast period

2020–2025

Forecast units

USD Million

Segments covered

Component, business function, application, organization size, end user and region

Geographies covered

North America, Europe, APAC, Latin America, and MEA

Companies covered

Microsoft (US), IBM (US), Oracle (US), Salesforce (US), SAP (Germany), AWS (US), SAS Institute (US), Qlik (US), Manthan (India), Bridgei2i (India), MicroStrategy (US), Teradata (US), HCL (India), Fujitsu (Japan), Domo (US), Google (US), FLIR Systems (US), Information Builders (US), 1010Data (US), Capillary (Singapore), RetailNext (US), WNS (India), True Fit (US), Vend (New Zealand), Fit Analytics (Geramny),  Edited (UK), Decision6 (Brazil), Cubelizer (Spain), ThinkInside (Italy), Dor Technology (US), Glimpse Analytics (India), Pygmalios (Slovakia), and Orenda Software Solutions (Canada)

This research report categorizes the retail analytics market based on components, deployment modes, organization size, business functions, verticals, and regions.

By component:

  • Solutions
  • Services
    • Professional Services
    • Managed Services

By business function:

  • Finance
  • Marketing and sales
  • Human Resources
  • Operations

By application:

  • Merchandising analysis
  • Pricing analysis
  • Customer analytics
  • Promotional analysis and planning
  • Yield analysis
  • Inventory analysis
  • Others (order management, transportation management, assortment and cluster planning, and real-estate planning) 

By organization size:

  • Large Enterprises
  • Small and Medium-sized Enterprises (SMEs) 

By end user:

  • Offline
  • Online

By region:

  • North America
    • US
    • Canada
  • Europe
    • UK
    • Germany
    • France
    • Rest of Europe
  • APAC
    • China
    • Japan
    • India
    • Rest of APAC
  • MEA
    • Middle East
    • Africa
    • Rest of MEA
  • Latin America
    • Brazil
    • Mexico
    • Rest of Latin America

Recent Developments:

  • In February 2020, MicroStrategy and enterprise data warehouse vendor Yellowbrick Data announced a new partnership that will integrate a Yellowbrick Data warehouse with the Microsoft 2020 analytics platform. The goal is to enable faster queries and provide improved insights into data.
  • In June 2020, Microsoft and SAS Institute announced an extensive technology and go-to-market strategic partnership. As part of the partnership, both companies will migrate SAS Institute’s analytical products and industry solutions to Microsoft Azure as the preferred cloud provider for SAS Cloud. Microsoft partnered with SAS Institute to bring cloud-based SAS industry solutions to its customers
  • In November 2019, SAS Institute enhanced its Software-as-a-Service (SaaS) offerings across the UK public sector. It collaborated with AWS to make analytics available in the cloud for public sector clients in the UK.
  • In May 2019, Qlik enhanced and expanded customer success programs and organizations to closely align with customer needs so that customers can derive more value from data through analytics.
  • In August 2019, Salesforce acquired Tableau, a data visualization and analytics solution provider. With this acquisition, Salesforce aims to compete with Microsoft in the Power BI and data visualization space.

Frequently Asked Questions (FAQ):


To speak to our analyst for a discussion on the above findings, click Speak to Analyst


TABLE OF CONTENTS
 
1 INTRODUCTION (Page No. - 23)
    1.1 INTRODUCTION TO COVID-19
    1.2 COVID-19 HEALTH ASSESSMENT
        FIGURE 1 COVID-19: THE GLOBAL PROPAGATION
        FIGURE 2 COVID-19 PROPAGATION: SELECT COUNTRIES
    1.3 COVID-19 ECONOMIC ASSESSMENT
        FIGURE 3 REVISED GROSS DOMESTIC PRODUCT FORECASTS FOR SELECT G20 COUNTRIES IN 2020
           1.3.1 COVID-19 ECONOMIC IMPACT-SCENARIO ASSESSMENT
                  FIGURE 4 CRITERIA IMPACTING THE GLOBAL ECONOMY
                  FIGURE 5 SCENARIOS IN TERMS OF RECOVERY OF THE GLOBAL ECONOMY
    1.4 OBJECTIVES OF THE STUDY
    1.5 MARKET DEFINITION
           1.5.1 INCLUSIONS AND EXCLUSIONS
    1.6 MARKET SCOPE
           1.6.1 MARKET SEGMENTATION
           1.6.2 REGIONS COVERED
           1.6.3 YEARS CONSIDERED FOR THE STUDY
    1.7 CURRENCY CONSIDERED
        TABLE 1 UNITED STATES DOLLAR EXCHANGE RATE, 2017-2019
    1.8 STAKEHOLDERS
    1.9 SUMMARY OF CHANGES

2 RESEARCH METHODOLOGY (Page No. - 33)
    2.1 RESEARCH DATA
        FIGURE 6 RETAIL ANALYTICS MARKET: RESEARCH DESIGN
           2.1.1 SECONDARY DATA
           2.1.2 PRIMARY DATA
                 TABLE 2 PRIMARY INTERVIEWS
                   2.1.2.1 Breakup of primary profiles
                   2.1.2.2 Key industry insights
    2.2 MARKET BREAKUP AND DATA TRIANGULATION
        FIGURE 7 DATA TRIANGULATION
    2.3 MARKET SIZE ESTIMATION
        FIGURE 8 MARKET: TOP-DOWN AND BOTTOM-UP APPROACHES
           2.3.1 TOP-DOWN APPROACH
           2.3.2 BOTTOM-UP APPROACH
                 FIGURE 9 MARKET SIZE ESTIMATION METHODOLOGY ? APPROACH 1 (SUPPLY SIDE
                 FIGURE 10 MARKET SIZE ESTIMATION METHODOLOGY ? APPROACH 2 BOTTOM-UP (SUPPLY SIDE : REVENUE OF SOLUTIONS/SERVICES OF RETAIL ANALYTICS MARKET)
                 FIGURE 11 MARKET SIZE ESTIMATION METHODOLOGY-APPROACH 3-BOTTOM-UP (DEMAND SIDE : SHARE OF RETAIL ANALYTICS THROUGH OVERALL RETAIL ANALYTICS SPENDING
    2.4 MARKET FORECAST
        TABLE 3 FACTOR ANALYSIS
    2.5 COMPETITIVE LEADERSHIP MAPPING METHODOLOGY
        FIGURE 12 COMPETITIVE LEADERSHIP MAPPING: CRITERIA WEIGHTAGE
    2.6 STARTUP/SME COMPETITIVE LEADERSHIP MAPPING METHODOLOGY
        FIGURE 13 STARTUP/SME COMPETITIVE LEADERSHIP MAPPING: CRITERIA WEIGHTAGE
    2.7 ASSUMPTIONS FOR THE STUDY
    2.8 LIMITATIONS OF THE STUDY
    2.9 IMPLICATIONS OF COVID-19 ON THE RETAIL ANALYTICS MARKET
        FIGURE 14 QUARTERLY IMPACT OF COVID-19 DURING 2020-2021

3 EXECUTIVE SUMMARY (Page No. - 48)
  TABLE 4 RETAIL ANALYTICS MARKET SIZE AND GROWTH RATE, 2016-2019 (USD MILLION), Y-O-Y %
  TABLE 5 MARKET SIZE AND GROWTH RATE, 2019-2025 (USD MILLION), Y-O-Y %
  FIGURE 15 MARKET SNAPSHOT, BY COMPONENT
  FIGURE 16 MARKET SNAPSHOT, BY SERVICE
  FIGURE 17 MARKET SNAPSHOT, BY PROFESSIONAL SERVICE
  FIGURE 18 MARKET SNAPSHOT, BY APPLICATION
  FIGURE 19 MARKET SNAPSHOT, BY ORGANIZATION SIZE
  FIGURE 20 MARKET SNAPSHOT, BY BUSINESS FUNCTION
  FIGURE 21 MARKET SNAPSHOT, BY END USER
  FIGURE 22 MARKET SNAPSHOT, BY REGION

4 PREMIUM INSIGHTS (Page No. - 53)
    4.1 ATTRACTIVE OPPORTUNITIES IN RETAIL ANALYTICS MARKET
        FIGURE 23 RISING NEED TO CREATE VALUABLE INSIGHTS FROM UNUSED CUSTOMER DATA ACROSS RETAIL INDUSTRY TO DRIVE MARKET GROWTH
    4.2 MARKET: TOP THREE APPLICATIONS
        FIGURE 24 INVENTORY ANALYSIS SEGMENT TO GROW AT HIGHEST CAGR DURING FORECAST PERIOD
    4.3 MARKET, BY REGION
        FIGURE 25 NORTH AMERICA TO HOLD HIGHEST MARKET SHARE IN 2020
    4.4 MARKET, BY BUSINESS FUNCTION AND APPLICATION
        FIGURE 26 MARKETING AND SALES, AND MERCHANDISING ANALYSIS SEGMENTS TO ACCOUNT FOR HIGHEST SHARES OF MARKET IN 2020

5 MARKET OVERVIEW AND INDUSTRY TRENDS (Page No. - 55)
    5.1 INTRODUCTION
    5.2 RETAIL ANALYTICS: EVOLUTION
        FIGURE 27 EVOLUTION OF TECHNOLOGY IN RETAIL
    5.3 RETAIL ANALYTICS: ECOSYSTEM
        FIGURE 28 ECOSYSTEM
    5.4 MARKET DYNAMICS
        FIGURE 29 DRIVERS, RESTRAINTS, OPPORTUNITIES, AND CHALLENGES: RETAIL ANALYTICS MARKET
           5.4.1 DRIVERS
                    5.4.1.1 Digitalizing to enhance customer experience and retail operations
                    5.4.1.2 Rising adoption of disruptive technologies to forecast future market trends
                    5.4.1.3 Growing number of smartphones, and increasing use of m-commerce
           5.4.2 RESTRAINTS
                    5.4.2.1 Lack of technology adoption by unorganized retail sector
                    5.4.2.2 Legal concerns and data privacy issues
           5.4.3 OPPORTUNITIES
                    5.4.3.1 Growing adoption of cloud services in retail
                    5.4.3.2 Proliferation of data analytics to understand customer data during COVID-19
           5.4.4 CHALLENGES
                    5.4.4.1 Retailers face a data deficit in the wake of the COVID-19 pandemic
           5.4.5 CUMULATIVE GROWTH ANALYSIS
    5.5 RETAIL ANALYTICS MARKET: COVID-19 IMPACT
        FIGURE 30 MARKET TO WITNESS DECLINE IN GROWTH IN 2020
    5.6 CASE STUDY ANALYSIS
           5.6.1 A GLOBAL RETAIL CHAIN USED ADVANCED ANALYTICS & MACHINE LEARNING TO FORECAST NEW STORE LOCATIONS AND REVENUES
           5.6.2 A FORTUNE 500 RETAILER USED CUSTOMER GENOME TO DELIVER PERSONALIZED INTERACTION TO CUSTOMERS AND DRIVE MORE REVENUE
           5.6.3 A GLOBAL RETAILER LEVERAGED MANTHAN'S SMART ANALYTICS SOLUTION TO TAKE DATA-DRIVEN BUSINESS DECISIONS
           5.6.4 THE RETAILER USED BRIDGEI2I TO DELIVER AN ENHANCED CUSTOMER EXPERIENCE
           5.6.5 THE CLIENT ADOPTED SAS ANALYTICS TO UNDERSTAND CUSTOMER NEEDS
           5.6.6 GROUPO MERZA LEVERAGED SAP SOLUTIONS FOR MARKET BASKET ANALYSIS
           5.6.7 PETER ENGLAND ADOPTED CAPILLARY'S CUSTOMER ACQUISITION PLATFORM TO ANALYZE CUSTOMER FOOTFALL
           5.6.8 A GLOBAL IT COMPANY INCREASED CUSTOMER BASE AND IMPROVED LOYALTY
           5.6.9 A HOME IMPROVEMENT RETAILER ENHANCED SALES AND WORKFORCE OPTIMIZATION
    5.7 PATENT ANALYSIS
           5.7.1 PATENTS FILED: RETAIL ANALYTICS, BY APPLICATION, 2019-2020
    5.8 VALUE CHAIN ANALYSIS
        FIGURE 31 VALUE CHAIN ANALYSIS
    5.9 TECHNOLOGY ANALYSIS
           5.9.1 VOICE SEARCH
           5.9.2 IN-STORE DIGITAL DISPLAY
           5.9.3 SOCIAL SHOPPING
           5.9.4 GEO-LOCATION SERVICES
           5.9.5 VISUAL SEARCH
           5.9.6 SMART FITTING ROOM
           5.9.7 AI AND ML IN RETAIL
           5.9.8 IOT IN RETAIL
           5.9.9 BIG DATA IN RETAIL
    5.1 PRICING ANALYSIS
    5.11 RETAIL ANALYTICS, KEY PERFORMANCE INDICATORS (KPIS
         FIGURE 32 GLOBAL MARKET: KPIS

6 RETAIL ANALYTICS MARKET, BY COMPONENT (Page No. - 74)
    6.1 INTRODUCTION
           6.1.1 COMPONENTS: COVID-19 IMPACT
                 FIGURE 33 SERVICES SEGMENT TO GROW AT HIGHEST CAGR DURING FORECAST PERIOD
                 TABLE 6 MARKET SIZE, BY COMPONENT, 2016-2019 (USD MILLION)
                 TABLE 7 MARKET SIZE, BY COMPONENT, 2019-2025 (USD MILLION)
    6.2 SOLUTIONS
           6.2.1 SOLUTIONS: MARKET DRIVERS
                 TABLE 8 SOLUTIONS: MARKET SIZE, BY REGION, 2016-2019 (USD MILLION)
                 TABLE 9 SOLUTIONS: MARKET SIZE, BY REGION, 2019-2025 (USD MILLION)
    6.3 SERVICES
           6.3.1 SERVICES: RETAIL ANALYTICS MARKET DRIVERS
                 FIGURE 34 MANAGED SERVICES SEGMENT TO GROW AT HIGHEST CAGR DURING FORECAST PERIOD
                 TABLE 10 MARKET SIZE, BY SERVICES, 2016-2019 (USD MILLION)
                 TABLE 11 MARKET SIZE, BY SERVICES, 2019-2025 (USD MILLION)
                 TABLE 12 SERVICES: MARKET SIZE, BY REGION, 2016-2019 (USD MILLION)
                 TABLE 13 SERVICES: MARKET SIZE, BY REGION, 2019-2025 (USD MILLION)
           6.3.2 PROFESSIONAL SERVICES
                 FIGURE 35 TRAINING AND SUPPORT SEGMENT TO GROW AT HIGHEST CAGR DURING FORECAST PERIOD
                 TABLE 14 MARKET SIZE, BY PROFESSIONAL SERVICES, 2016-2019 (USD MILLION)
                 TABLE 15 MARKET SIZE, BY PROFESSIONAL SERVICES, 2019-2025 (USD MILLION)
                    6.3.2.1 Training and Support
                    6.3.2.2 Implementation and Consulting
           6.3.3 MANAGED SERVICES

7 RETAIL ANALYTICS MARKET, BY BUSINESS FUNCTION (Page No. - 83)
    7.1 INTRODUCTION
           7.1.1 BUSINESS FUNCTIONS: COVID-19 IMPACT
           7.1.2 BUSINESS FUNCTIONS: MARKET DRIVERS
                 FIGURE 36 OPERATIONS SEGMENT TO GROW AT HIGHEST CAGR DURING FORECAST PERIOD
                 TABLE 16 MARKET SIZE, BY BUSINESS FUNCTION, 2016-2019 (USD MILLION)
                 TABLE 17 MARKET SIZE, BY BUSINESS FUNCTION, 2019-2025 (USD MILLION)
    7.2 FINANCE
        TABLE 18 FINANCE: MARKET SIZE, BY REGION, 2016-2019 (USD MILLION)
        TABLE 19 FINANCE: MARKET SIZE, BY REGION, 2019-2025 (USD MILLION)
    7.3 MARKETING AND SALES
        TABLE 20 MARKETING AND SALES: MARKET SIZE, BY REGION, 2016-2019 (USD MILLION)
        TABLE 21 MARKETING AND SALES: MARKET SIZE, BY REGION, 2019-2025 (USD MILLION)
    7.4 HUMAN RESOURCES
        TABLE 22 HUMAN RESOURCES: MARKET SIZE, BY REGION, 2016-2019 (USD MILLION)
        TABLE 23 HUMAN RESOURCES: MARKET SIZE, BY REGION, 2019-2025 (USD MILLION)
    7.5 OPERATIONS
        TABLE 24 OPERATIONS: MARKET SIZE, BY REGION, 2016-2019 (USD MILLION)
        TABLE 25 OPERATIONS: MARKET SIZE, BY REGION, 2019-2025 (USD MILLION)

8 RETAIL ANALYTICS MARKET, BY APPLICATION (Page No. - 90)
    8.1 INTRODUCTION
           8.1.1 APPLICATIONS: COVID-19 IMPACT
           8.1.2 APPLICATIONS: MARKET DRIVERS
                 FIGURE 37 INVENTORY ANALYSIS SEGMENT TO GROW AT HIGHEST CAGR DURING FORECAST PERIOD
                 TABLE 26 MARKET SIZE, BY APPLICATION, 2016-2019 (USD MILLION)
                 TABLE 27 MARKET SIZE, BY APPLICATION, 2019-2025 (USD MILLION)
    8.2 MERCHANDISING ANALYSIS
        TABLE 28 MERCHANDISING ANALYSIS: MARKET SIZE, BY REGION, 2016-2019 (USD MILLION)
        TABLE 29 MERCHANDISING ANALYSIS: MARKET SIZE, BY REGION, 2019-2025 (USD MILLION)
    8.3 PRICING ANALYSIS
        TABLE 30 PRICING ANALYSIS: MARKET SIZE, BY REGION, 2016-2019 (USD MILLION)
        TABLE 31 PRICING ANALYSIS: MARKET SIZE, BY REGION, 2019-2025 (USD MILLION)
    8.4 CUSTOMER ANALYTICS
        TABLE 32 CUSTOMER ANALYTICS: MARKET SIZE, BY REGION, 2016-2019 (USD MILLION)
        TABLE 33 CUSTOMER ANALYTICS: MARKET SIZE, BY REGION, 2019-2025 (USD MILLION)
    8.5 PROMOTIONAL ANALYSIS AND PLANNING
        TABLE 34 PROMOTIONAL ANALYSIS AND PLANNING: RETAIL ANALYTICS MARKET SIZE, BY REGION, 2016-2019 (USD MILLION)
        TABLE 35 PROMOTIONAL ANALYSIS AND PLANNING: MARKET SIZE, BY REGION, 2019-2025 (USD MILLION)
    8.6 YEILD ANALYSIS
        TABLE 36 YEILD ANALYSIS: MARKET SIZE, BY REGION, 2016-2019 (USD MILLION)
        TABLE 37 YEILD ANALYSIS: MARKET SIZE, BY REGION, 2019-2025 (USD MILLION)
    8.7 INVENTORY ANALYSIS
        TABLE 38 INVENTORY ANALYSIS: MARKET SIZE, BY REGION, 2016-2019 (USD MILLION)
        TABLE 39 INVENTORY ANALYSIS: MARKET SIZE, BY REGION, 2019-2025 (USD MILLION)
    8.8 OTHERS
        TABLE 40 OTHERS: MARKET SIZE, BY REGION, 2016-2019 (USD MILLION)
        TABLE 41 OTHERS: MARKET SIZE, BY REGION, 2019-2025 (USD MILLION)

9 RETAIL ANALYTICS MARKET, BY ORGANIZATION SIZE (Page No. - 103)
    9.1 INTRODUCTION
           9.1.1 ORGANIZATION SIZE: COVID-19 IMPACT
           9.1.2 ORGANIZATION SIZE: MARKET DRIVERS
                 FIGURE 38 SMALL AND MEDIUM-SIZED ENTERPRISES SEGMENT TO REGISTER HIGHER CAGR DURING FORECAST PERIOD
                 TABLE 42 MARKET SIZE, BY ORGANIZATION SIZE, 2016-2019 (USD MILLION)
                 TABLE 43 MARKET SIZE, BY ORGANIZATION SIZE, 2019-2025 (USD MILLION)
    9.2 LARGE ENTERPRISES
    9.3 SMALL AND MEDIUM-SIZED ENTERPRISES

10 RETAIL ANALYTICS MARKET, BY END USER (Page No. - 107)
     10.1 INTRODUCTION
            10.1.1 END USER: COVID-19 IMPACT
            10.1.2 END USER: MARKET DRIVERS
                   FIGURE 39 ONLINE END USERS SEGMENT TO REGISTER HIGHER CAGR DURING FORECAST PERIOD
                   TABLE 44 MARKET SIZE, BY END USER, 2016-2019 (USD MILLION)
                   TABLE 45 MARKET SIZE, BY END USER, 2019-2025 (USD MILLION)
     10.2 OFFLINE
     10.3 ONLINE

11 RETAIL ANALYTICS MARKET, BY REGION (Page No. - 111)
     11.1 INTRODUCTION
          FIGURE 40 INDIA TO REGISTER HIGHEST CAGR DURING FORECAST PERIOD
          FIGURE 41 APAC TO EXHIBIT HIGHEST CAGR DURING FORECAST PERIOD
          TABLE 46 MARKET SIZE, BY REGION, 2016-2019 (USD MILLION)
          TABLE 47 MARKET SIZE, BY REGION, 2019-2025 (USD MILLION)
     11.2 NORTH AMERICA
            11.2.1 NORTH AMERICA: MARKET DRIVERS
            11.2.2 NORTH AMERICA: COVID-19 IMPACT
            11.2.3 NORTH AMERICA: REGULATIONS
                     11.2.3.1 Health Insurance Portability and Accountability Act of 1996
                     11.2.3.2 California Consumer Privacy Act
                     11.2.3.3 Gramm-Leach-Bliley Act
                     11.2.3.4 Institute of Electrical and Electronics Engineers Standards Association
                              FIGURE 42 NORTH AMERICA: MARKET SNAPSHOT
                              TABLE 48 NORTH AMERICA: RETAIL ANALYTICS MARKET SIZE, BY COMPONENT, 2016-2019 (USD MILLION)
                              TABLE 49 NORTH AMERICA: MARKET SIZE, BY COMPONENT, 2019-2025 (USD MILLION)
                              TABLE 50 NORTH AMERICA: MARKET SIZE, BY SERVICES, 2016-2019 (USD MILLION)
                              TABLE 51 NORTH AMERICA: MARKET SIZE, BY SERVICES, 2019-2025 (USD MILLION)
                              TABLE 52 NORTH AMERICA: MARKET SIZE, BY PROFESSIONAL SERVICES, 2016-2019 (USD MILLION)
                              TABLE 53 NORTH AMERICA: RETAIL DATA ANALYTICS MARKET SIZE, BY PROFESSIONAL SERVICES, 2019-2025 (USD MILLION)
                              TABLE 54 NORTH AMERICA: MARKET SIZE, BY BUSINESS FUNCTION, 2016-2019 (USD MILLION)
                              TABLE 55 NORTH AMERICA: MARKET SIZE, BY BUSINESS FUNCTION, 2019-2025 (USD MILLION)
                              TABLE 56 NORTH AMERICA: MARKET SIZE, BY ORGANIZATION SIZE, 2016-2019 (USD MILLION)
                              TABLE 57 NORTH AMERICA: MARKET SIZE, BY ORGANIZATION SIZE, 2019-2025 (USD MILLION)
                              TABLE 58 NORTH AMERICA: MARKET SIZE, BY APPLICATION, 2016-2019 (USD MILLION)
                              TABLE 59 NORTH AMERICA: MARKET SIZE, BY APPLICATION, 2019-2025 (USD MILLION)
                              TABLE 60 NORTH AMERICA: MARKET SIZE, BY END USER, 2016-2019 (USD MILLION)
                              TABLE 61 NORTH AMERICA: MARKET SIZE, BY END USER, 2019-2025 (USD MILLION)
                              TABLE 62 NORTH AMERICA: MARKET SIZE, BY COUNTRY, 2016-2019 (USD MILLION)
                              TABLE 63 NORTH AMERICA: MARKET SIZE, BY COUNTRY, 2019-2025 (USD MILLION)
            11.2.4 UNITED STATES
            11.2.5 CANADA
     11.3 EUROPE
            11.3.1 EUROPE: MARKET DRIVERS
            11.3.2 EUROPE: COVID-19 IMPACT
            11.3.3 EUROPE: REGULATIONS
                     11.3.3.1 General Data Protection Regulation
                     11.3.3.2 European Market Infrastructure Regulation
                     11.3.3.3 European Committee for Standardization
                     11.3.3.4 European Technical Standards Institute
                              TABLE 64 EUROPE: RETAIL ANALYTICS MARKET SIZE, BY COMPONENT, 2016-2019 (USD MILLION)
                              TABLE 65 EUROPE: MARKET SIZE, BY COMPONENT, 2019-2025 (USD MILLION)
                              TABLE 66 EUROPE: MARKET SIZE, BY SERVICES, 2016-2019 (USD MILLION)
                              TABLE 67 EUROPE: MARKET SIZE, BY SERVICES, 2019-2025 (USD MILLION)
                              TABLE 68 EUROPE: MARKET SIZE, BY PROFESSIONAL SERVICES, 2016-2019 (USD MILLION)
                              TABLE 69 EUROPE: RETAIL DATA ANALYTICS MARKET SIZE, BY PROFESSIONAL SERVICES, 2019-2025 (USD MILLION)
                              TABLE 70 EUROPE: MARKET SIZE, BY BUSINESS FUNCTION, 2016-2019 (USD MILLION)
                              TABLE 71 EUROPE: MARKET SIZE, BY BUSINESS FUNCTION, 2019-2025 (USD MILLION)
                              TABLE 72 EUROPE: MARKET SIZE, BY ORGANIZATION SIZE, 2016-2019 (USD MILLION)
                              TABLE 73 EUROPE: MARKET SIZE, BY ORGANIZATION SIZE, 2019-2025 (USD MILLION)
                              TABLE 74 EUROPE: MARKET SIZE, BY APPLICATION, 2016-2019 (USD MILLION)
                              TABLE 75 EUROPE: MARKET SIZE, BY APPLICATION, 2019-2025 (USD MILLION)
                              TABLE 76 EUROPE: MARKET SIZE, BY END USER, 2016-2019 (USD MILLION)
                              TABLE 77 EUROPE: MARKET SIZE, BY END USER, 2019-2025 (USD MILLION)
                              TABLE 78 EUROPE: MARKET SIZE, BY COUNTRY, 2016-2019 (USD MILLION)
                              TABLE 79 EUROPE: MARKET SIZE, BY COUNTRY, 2019-2025 (USD MILLION)
            11.3.4 UNITED KINGDOM
            11.3.5 GERMANY
            11.3.6 FRANCE
            11.3.7 REST OF EUROPE
     11.4 ASIA PACIFIC
            11.4.1 ASIA PACIFIC: MARKET DRIVERS
            11.4.2 ASIA PACIFIC: COVID-19 IMPACT
            11.4.3 ASIA PACIFIC: REGULATIONS
                     11.4.3.1 International Organization for Standardization 27001
                     11.4.3.2 Personal Data Protection Act
                              FIGURE 43 ASIA PACIFIC: MARKET SNAPSHOT
                              TABLE 80 ASIA PACIFIC: RETAIL ANALYTICS MARKET SIZE, BY COMPONENT, 2016-2019 (USD MILLION)
                              TABLE 81 ASIA PACIFIC: MARKET SIZE, BY COMPONENT, 2019-2025 (USD MILLION)
                              TABLE 82 ASIA PACIFIC: MARKET SIZE, BY SERVICES, 2016-2019 (USD MILLION)
                              TABLE 83 ASIA PACIFIC: MARKET SIZE, BY SERVICES, 2019-2025 (USD MILLION)
                              TABLE 84 ASIA PACIFIC: MARKET SIZE, BY PROFESSIONAL SERVICES, 2016-2019 (USD MILLION)
                              TABLE 85 ASIA PACIFIC: RETAIL DATA ANALYTICS MARKET SIZE, BY PROFESSIONAL SERVICES, 2019-2025 (USD MILLION)
                              TABLE 86 ASIA PACIFIC: MARKET SIZE, BY BUSINESS FUNCTION, 2016-2019 (USD MILLION)
                              TABLE 87 ASIA PACIFIC: MARKET SIZE, BY BUSINESS FUNCTION, 2019-2025 (USD MILLION)
                              TABLE 88 ASIA PACIFIC: MARKET SIZE, BY ORGANIZATION SIZE, 2016-2019 (USD MILLION)
                              TABLE 89 ASIA PACIFIC: MARKET SIZE, BY ORGANIZATION SIZE, 2019-2025 (USD MILLION)
                              TABLE 90 ASIA PACIFIC: MARKET SIZE, BY APPLICATION, 2016-2019 (USD MILLION)
                              TABLE 91 ASIA PACIFIC: MARKET SIZE, BY APPLICATION, 2019-2025 (USD MILLION)
                              TABLE 92 ASIA PACIFIC: MARKET SIZE, BY END USER, 2016-2019 (USD MILLION)
                              TABLE 93 ASIA PACIFIC: MARKET SIZE, BY END USER, 2019-2025 (USD MILLION)
                              TABLE 94 ASIA PACIFIC: MARKET SIZE, BY COUNTRY, 2016-2019 (USD MILLION)
                              TABLE 95 ASIA PACIFIC: MARKET SIZE, BY COUNTRY, 2019-2025 (USD MILLION)
            11.4.4 CHINA
            11.4.5 JAPAN
            11.4.6 INDIA
            11.4.7 REST OF ASIA PACIFIC
     11.5 MIDDLE EAST & AFRICA
            11.5.1 MIDDLE EAST & AFRICA: MARKET DRIVERS
            11.5.2 MIDDLE EAST & AFRICA: COVID-19 IMPACT
            11.5.3 MIDDLE EAST & AFRICA: REGULATIONS
                     11.5.3.1 Israeli Privacy Protection Regulations (Data Security
                     11.5.3.2 Cloud Computing Framework
                     11.5.3.3 GDPR Applicability in KSA
                     11.5.3.4 Protection of Personal Information Act
                     11.5.3.5 TRA's IoT Regulatory Policy
                              TABLE 96 MIDDLE EAST & AFRICA: RETAIL ANALYTICS MARKET SIZE, BY COMPONENT, 2016-2019 (USD MILLION)
                              TABLE 97 MIDDLE EAST & AFRICA: MARKET SIZE, BY COMPONENT, 2019-2025 (USD MILLION)
                              TABLE 98 MIDDLE EAST & AFRICA: MARKET SIZE, BY SERVICES, 2016-2019 (USD MILLION)
                              TABLE 99 MIDDLE EAST & AFRICA: MARKET SIZE, BY SERVICES, 2019-2025 (USD MILLION)
                              TABLE 100 MIDDLE EAST & AFRICA: MARKET SIZE, BY PROFESSIONAL SERVICES, 2016-2019 (USD MILLION)
                              TABLE 101 MIDDLE EAST & AFRICA: RETAIL DATA ANALYTICS MARKET SIZE, BY PROFESSIONAL SERVICES, 2019-2025 (USD MILLION)
                              TABLE 102 MIDDLE EAST & AFRICA: MARKET SIZE, BY BUSINESS FUNCTION, 2016-2019 (USD MILLION)
                              TABLE 103 MIDDLE EAST & AFRICA: MARKET SIZE, BY BUSINESS FUNCTION, 2019-2025 (USD MILLION)
                              TABLE 104 MIDDLE EAST & AFRICA: RETAIL ANALYTICS MARKET SIZE, BY ORGANIZATION SIZE, 2016-2019 (USD MILLION)
                              TABLE 105 MIDDLE EAST & AFRICA: MARKET SIZE, BY ORGANIZATION SIZE, 2019-2025 (USD MILLION)
                              TABLE 106 MIDDLE EAST & AFRICA: MARKET SIZE, BY APPLICATION, 2016-2019 (USD MILLION)
                              TABLE 107 MIDDLE EAST & AFRICA: MARKET SIZE, BY APPLICATION, 2019-2025 (USD MILLION)
                              TABLE 108 MIDDLE EAST & AFRICA: MARKET SIZE, BY END USER, 2016-2019 (USD MILLION)
                              TABLE 109 MIDDLE EAST & AFRICA: MARKET SIZE, BY END USER, 2019-2025 (USD MILLION)
                              TABLE 110 MIDDLE EAST & AFRICA: MARKET SIZE, BY COUNTRY, 2016-2019 (USD MILLION)
                              TABLE 111 MIDDLE EAST & AFRICA: MARKET SIZE, BY COUNTRY, 2019-2025 (USD MILLION)
            11.5.4 MIDDLE EAST
            11.5.5 AFRICA
            11.5.6 REST OF MIDDLE EAST & AFRICA
     11.6 LATIN AMERICA
            11.6.1 LATIN AMERICA: MARKET DRIVERS
            11.6.2 LATIN AMERICA: COVID-19 IMPACT
            11.6.3 LATIN AMERICA: REGULATIONS
                     11.6.3.1 Brazil Data Protection Law
                     11.6.3.2 Argentina Personal Data Protection Law No. 25.326
                              TABLE 112 LATIN AMERICA: RETAIL ANALYTICS MARKET SIZE, BY COMPONENT, 2016-2019 (USD MILLION)
                              TABLE 113 LATIN AMERICA: MARKET SIZE, BY COMPONENT, 2019-2025 (USD MILLION)
                              TABLE 114 LATIN AMERICA: MARKET SIZE, BY SERVICES, 2016-2019 (USD MILLION)
                              TABLE 115 LATIN AMERICA: MARKET SIZE, BY SERVICES, 2019-2025 (USD MILLION)
                              TABLE 116 LATIN AMERICA: MARKET SIZE, BY PROFESSIONAL SERVICES, 2016-2019 (USD MILLION)
                              TABLE 117 LATIN AMERICA: RETAIL DATA ANALYTICS MARKET SIZE, BY PROFESSIONAL SERVICES, 2019-2025 (USD MILLION)
                              TABLE 118 LATIN AMERICA: MARKET SIZE, BY BUSINESS FUNCTION, 2016-2019 (USD MILLION)
                              TABLE 119 LATIN AMERICA: MARKET SIZE, BY BUSINESS FUNCTION, 2019-2025 (USD MILLION)
                              TABLE 120 LATIN AMERICA: MARKET SIZE, BY ORGANIZATION SIZE, 2016-2019 (USD MILLION)
                              TABLE 121 LATIN AMERICA: MARKET SIZE, BY ORGANIZATION SIZE, 2019-2025 (USD MILLION)
                              TABLE 122 LATIN AMERICA: MARKET SIZE, BY APPLICATION, 2016-2019 (USD MILLION)
                              TABLE 123 LATIN AMERICA: MARKET SIZE, BY APPLICATION, 2019-2025 (USD MILLION)
                              TABLE 124 LATIN AMERICA: MARKET SIZE, BY END USER, 2016-2019 (USD MILLION)
                              TABLE 125 LATIN AMERICA: MARKET SIZE, BY END USER, 2019-2025 (USD MILLION)
                              TABLE 126 LATIN AMERICA: MARKET SIZE, BY COUNTRY, 2016-2019 (USD MILLION)
                              TABLE 127 LATIN AMERICA: MARKET SIZE, BY COUNTRY, 2019-2025 (USD MILLION)
            11.6.4 BRAZIL
            11.6.5 MEXICO
            11.6.6 REST OF LATIN AMERICA

12 COMPETITIVE LANDSCAPE (Page No. - 158)
     12.1 OVERVIEW
     12.2 MARKET EVALUATION FRAMEWORK
          FIGURE 44 MARKET EVALUATION FRAMEWORK
     12.3 MARKET SHARE, 2019
          FIGURE 45 MICROSOFT LED RETAIL ANALYTICS MARKET IN 2020
     12.4 HISTORIC REVENUE ANALYSIS OF KEY MARKET PLAYERS
          FIGURE 46 REVENUE ANALYSIS OF KEY MARKET PLAYERS
     12.5 KEY MARKET DEVELOPMENTS
            12.5.1 NEW PRODUCT LAUNCHES AND PRODUCT ENHANCEMENTS
                   TABLE 128 NEW PRODUCT LAUNCHES AND PRODUCT ENHANCEMENTS, 2018-2020
            12.5.2 BUSINESS EXPANSIONS
                   TABLE 129 BUSINESS EXPANSIONS, 2019-2020
            12.5.3 MERGERS AND ACQUISITIONS
                   TABLE 130 MERGERS AND ACQUISITIONS, 2018-2020
            12.5.4 PARTNERSHIPS, AGREEMENTS, CONTRACTS, AND COLLABORATIONS
                   TABLE 131 PARTNERSHIPS, AGREEMENTS, CONTRACTS, AND COLLABORATIONS, 2018-2020 168
     12.6 COMPANY EVALUATION MATRIX, 2020
            12.6.1 STAR
            12.6.2 EMERGING LEADER
            12.6.3 PERVASIVE
            12.6.4 PARTICIPANT
                   FIGURE 47 RETAIL ANALYTICS MARKET (GLOBAL , COMPANY EVALUATION MATRIX, 2020
     12.7 STARTUP/SME EVALUATION MATRIX, 2020
            12.7.1 PROGRESSIVE COMPANIES
            12.7.2 RESPONSIVE COMPANIES
            12.7.3 DYNAMIC COMPANIES
            12.7.4 STARTING BLOCKS
                   FIGURE 48 RETAIL ANALYTICS MARKET (GLOBAL , STARTUP/SME EVALUATION MATRIX, 2020)
     12.8 MARKET RANKING ANALYSIS, BY COMPANY
          FIGURE 49 RANKING OF KEY PLAYERS, 2020

13 COMPANY PROFILES (Page No. - 117)
     13.1 INTRODUCTION
(Business and financial overview, Products offered, Solutions and services offered, Recent developments & MnM View
     13.2 MICROSOFT
FIGURE 50 MICROSOFT: COMPANY SNAPSHOT
     13.3 IBM
FIGURE 51 IBM: COMPANY SNAPSHOT
     13.4 ORACLE
FIGURE 52 ORACLE: COMPANY SNAPSHOT
     13.5 SALESFORCE
FIGURE 53 SALESFORCE: COMPANY SNAPSHOT
     13.6 SAP
FIGURE 54 SAP: COMPANY SNAPSHOT
     13.7 AWS
FIGURE 55 AWS: COMPANY SNAPSHOT
     13.8 SAS INSTITUTE
FIGURE 56 SAS INSTITUTE: COMPANY SNAPSHOT
     13.9 QLIK
     13.10 MANTHAN
     13.11 BRIDGEI2I
     13.12 MICROSTRATEGY
FIGURE 57 MICROSTRATEGY: COMPANY SNAPSHOT
     13.13 TERADATA
FIGURE 58 TERADATA: COMPANY SNAPSHOT
     13.14 HCL
FIGURE 59 HCL: COMPANY SNAPSHOT
     13.15 FUJITSU
FIGURE 60 FUJITSU: COMPANY SNAPSHOT
     13.16 DOMO
FIGURE 61 DOMO: COMPANY SNAPSHOT
     13.17 GOOGLE
FIGURE 62 GOOGLE: COMPANY SNAPSHOT
     13.18 FLIR SYSTEMS
FIGURE 63 FLIR SYSTEMS: COMPANY SNAPSHOT
     13.19 INFORMATION BUILDERS
     13.20 1010DATA
     13.21 CAPILLARY
     13.22 RETAILNEXT
     13.23 WNS
     13.24 TRUE FIT
     13.25 VEND
     13.26 FIT ANALYTICS
     13.27 EDITED
     13.28 DECISION6
     13.29 CUBELIZER
     13.30 THINKINSIDE
     13.31 DOR TECHNOLOGIES
     13.32 GLIMPSE ANALYTICS
     13.33 PYGMALIOS
     13.34 ORENDA SOFTWARE SOLUTIONS

*Details on Business and financial overview, Products offered, Solutions and services offered, Recent developments & MnM View might not be captured in case of unlisted companies.

14 APPENDIX (Page No. - 260)
     14.1 ADJACENT AND RELATED MARKETS
             14.1.1 INTRODUCTION
             14.1.2 CUSTOMER JOURNEY ANALYTICS MARKET- GLOBAL FORECAST TO 2022
                       14.1.2.1 Market definition
                       14.1.2.2 Market overview
                                TABLE 132 GLOBAL CUSTOMER JOURNEY ANALYTICS MARKET SIZE AND GROWTH RATE, 2017-2022 (USD MILLION) AND Y-O-Y %
                                    14.1.2.2.1 Customer journey analytics market, by component
                                               TABLE 133 CUSTOMER JOURNEY ANALYTICS MARKET SIZE, BY COMPONENT, 2017-2022 (USD MILLION)
                                               TABLE 134 CUSTOMER JOURNEY ANALYTICS MARKET SIZE, BY SERVICES, 2017-2022 (USD MILLION)
                                               TABLE 135 CUSTOMER JOURNEY ANALYTICS MARKET SIZE, BY PROFESSIONAL SERVICES, 2017-2022 (USD MILLION)
                                    14.1.2.2.2 Customer journey analytics market, by deployment mode
                                               TABLE 136 CUSTOMER JOURNEY ANALYTICS MARKET SIZE, BY DEPLOYMENT MODE, 2017-2022 (USD MILLION)
                                    14.1.2.2.3 Customer journey analytics market, by organization size
                                               TABLE 137 CUSTOMER JOURNEY ANALYTICS MARKET SIZE, BY ORGANIZATION SIZE, 2017-2022 (USD MILLION)
                                    14.1.2.2.4 Customer journey analytics market, by vertical
                                               TABLE 138 CUSTOMER JOURNEY ANALYTICS MARKET SIZE, BY VERTICAL, 2017-2022 (USD MILLION)
                                    14.1.2.2.5 Customer journey analytics market, by application
                                               TABLE 139 CUSTOMER JOURNEY ANALYTICS MARKET SIZE, BY APPLICATION, 2017-2022 (USD MILLION)
                                    14.1.2.2.6 Customer journey analytics market, by region
                                               TABLE 140 CUSTOMER JOURNEY ANALYTICS MARKET SIZE, BY REGION, 2017-2022 (USD MILLION)
             14.1.3 IN-STORE ANALYTICS MARKET- GLOBAL FORECAST TO 2022
                       14.1.3.1 Market definition
                       14.1.3.2 Market overview
                                TABLE 141 IN-STORE ANALYTICS MARKET SIZE AND GROWTH RATE, 2016-2023 (USD MILLION), Y-O-Y %
                                    14.1.3.2.1 In-store analytics, by component
                                               TABLE 142 IN-STORE ANALYTICS MARKET SIZE, BY COMPONENT, 2016-2023 (USD MILLION)
                                    14.1.3.2.2 In-store analytics, by application
                                               TABLE 143 IN-STORE ANALYTICS MARKET SIZE, BY APPLICATION, 2016-2023 (USD MILLION)
                                    14.1.3.2.3 In-store analytics, by deployment model
                                               TABLE 144 IN-STORE ANALYTICS MARKET SIZE, BY DEPLOYMENT MODEL, 2016-2023 (USD MILLION)
                                    14.1.3.2.4 In-store analytics, by organization size
                                               TABLE 145 IN-STORE ANALYTICS MARKET SIZE, BY ORGANIZATION SIZE, 2016-2023 (USD MILLION)
                                    14.1.3.2.5 In-store analytics, by region
                                               TABLE 146 IN-STORE ANALYTICS MARKET SIZE, BY REGION, 2016-2023 (USD MILLION)

15 APPENDIX (Page No. - 268)
     15.1 INDUSTRY EXPERTS
     15.2 DISCUSSION GUIDE
     15.3 KNOWLEDGE STORE: MARKETSANDMARKETS' SUBSCRIPTION PORTAL
     15.4 AVAILABLE CUSTOMIZATIONS
     15.5 RELATED REPORTS
     15.6 AUTHOR DETAILS
     15.6 AUTHOR DETAILS

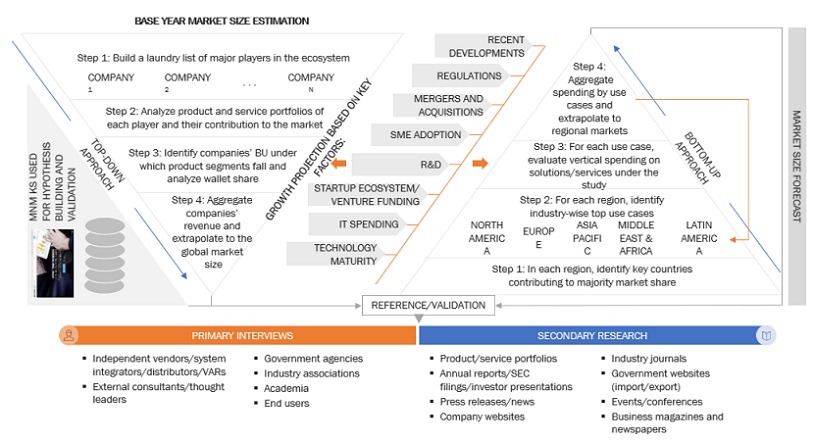
The study involved four major activities in estimating the current market size of the retail analytics market. Extensive secondary research was done to collect information on the market, peer market, and parent market. The next step was to validate these findings, assumptions, and sizing with industry experts across the value chain through primary research. Both top-down and bottom-up approaches were used to estimate the total market size. After that, the market breakup and data triangulation procedures were used to estimate the market size of the segments and subsegments of the market.

Secondary Research

In the secondary research process, various secondary sources, such as Analytics Insight, Data Science and Artificial Intelligence for Communications, and related magazines, have been referred to for identifying and collecting information for this study. Secondary sources included annual reports; press releases and investor presentations of companies; whitepapers, certified publications, and articles by recognized authors; gold standard and silver standard websites; Research and Development (R&D) organizations; regulatory bodies; and databases.

Primary Research

Various primary sources from both supply and demand sides were interviewed to obtain qualitative and quantitative information on the market. The primary sources from the supply side included various industry experts, including Chief X Officers (CXOs); Vice Presidents (VPs); directors from business development, marketing, and product development/innovation teams; related key executives from retail analytics solution vendors, system integrators, professional service providers, industry associations, and consultants; and key opinion leaders. All possible parameters that affect the market covered in this research study have been accounted for, viewed in extensive detail, verified through primary research, and analyzed to get the final quantitative and qualitative data.

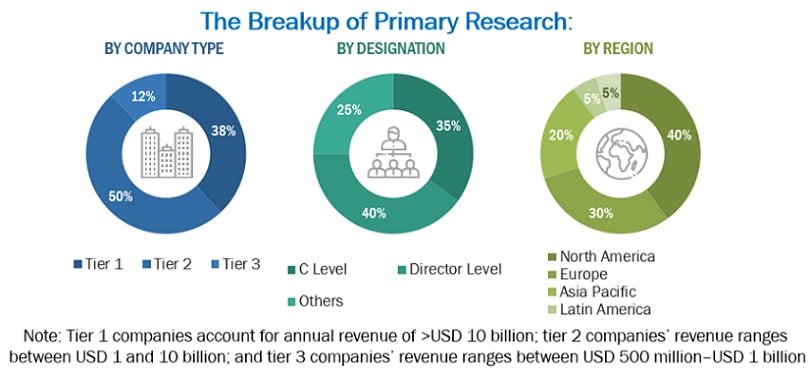
The following is the breakup of primary profiles: 

Retail Analytics Market Size

To know about the assumptions considered for the study, download the pdf brochure

Note: Tier 1 companies comprise the overall annual revenue of >USD 10 billion; tier 2 companies’ revenue ranges in between USD 1 and 10 billion; and tier 3 companies’ revenue ranges in between USD 500 million–USD 1 billion

*Others include sales managers, marketing managers, and product managers

Source: MarketsandMarkets Analysis

Market Size Estimation

Both top-down and bottom-up approaches were used to estimate and validate the total size of the retail analytics market. The top-down approach was used to derive the revenue contribution of top vendors and their offerings in the retail analytics market. The bottom-up approach was used to arrive at the overall market size of the global retail analytics market using key companies’ revenue and their offerings in the market. The research methodology used to estimate the market size includes the following: 

  • The key players in the market were identified through extensive secondary research.
  • The market size, in terms of value, was determined through primary and secondary research processes.
  • All percentages, shares, and breakups were determined using secondary sources and verified through primary sources.

Data Triangulation

After arriving at the overall market size using the market size estimation processes as explained above, the market was split into several segments and subsegments. To complete the overall market engineering process and arrive at the exact statistics of each market segment and subsegment, data triangulation and market breakup procedures were employed, wherever applicable. The overall market size was then used in the top-down procedure to estimate the size of other individual markets via percentage splits of the market segmentation. 

Report Objectives

  • To define, describe, and forecast the retail analytics market by component (solutions and services), deployment mode, organization size, business function, application, end user, and region 
  • To provide detailed information about the major factors (drivers, restraints, opportunities, and industry-specific challenges) influencing the market growth
  • To analyse the opportunities in the market and provide details of the competitive landscape for stakeholders and market leaders 
  • To forecast the market size of the segments with respect to five main regions: North America, Europe, Asia Pacific (APAC), Middle East and Africa (MEA), and Latin America
  • To profile the key players and comprehensively analyse their market rankings and core competencies
  • To analyse competitive developments in the retail analytics market, such as partnerships, new product launches, and mergers and acquisitions 
  • To analyse the impact of the COVID-19 pandemic on the retail analytics market 

Available customizations

With the given market data, MarketsandMarkets offers customizations as per the company’s specific needs. The following customization options are available for the report:

Product analysis

  • Product matrix provides a detailed comparison of the product portfolio of each company

Geographic analysis 

  • Further breakdown of the countries on a best-efforts basis

Company information

  • Additional profiling of companies in the retail analytics market
Custom Market Research Services

We will customize the research for you, in case the report listed above does not meet with your exact requirements. Our custom research will comprehensively cover the business information you require to help you arrive at strategic and profitable business decisions.

Request Customization
Report Code
TC 2663
Published ON
Oct, 2020
Choose License Type
BUY NOW
  • SHARE
X
Request Customization
Speak to Analyst
Speak to Analyst
OR FACE-TO-FACE MEETING
PERSONALIZE THIS RESEARCH
  • Triangulate with your Own Data
  • Get Data as per your Format and Definition
  • Gain a Deeper Dive on a Specific Application, Geography, Customer or Competitor
  • Any level of Personalization
REQUEST A FREE CUSTOMIZATION
LET US HELP YOU!
  • What are the Known and Unknown Adjacencies Impacting the Retail Analytics Market
  • What will your New Revenue Sources be?
  • Who will be your Top Customer; what will make them switch?
  • Defend your Market Share or Win Competitors
  • Get a Scorecard for Target Partners
CUSTOMIZED WORKSHOP REQUEST
+1-888-600-6441
  • Call Us
  • +1-888-600-6441 (Corporate office hours)
  • +1-888-600-6441 (US/Can toll free)
  • +44-800-368-9399 (UK office hours)
CONNECT WITH US
ABOUT TRUST ONLINE
©2024 MarketsandMarkets Research Private Ltd. All rights reserved
DMCA.com Protection Status Website Feedback