RF Tunable Filter Market by Type (Bandpass, Band Reject), Tuning Mechanism, Tuning Component, System (Handheld and Pocket Radio, Radar System), Application (Aerospace and Defense, Transportation, Smart Cities) and Geography - Global Forecast to 2027


Updated on : October 22, 2024
RF Tunable Filter Market Size
[260 Pages Report] The global RF tunable filter market is projected to reach USD 168 million by 2027 from an estimated USD 100 million in 2022, at a CAGR of 10.8% from 2022 to 2027. The growth of the market can be attributed to the escalating demand for software-defined radios to be deployed in military communication equipment.

To know about the assumptions considered for the study, Request for Free Sample Report
COVID-19 Impact
The outbreak of the COVID-19 pandemic has adversely affected every sector and industry in North America. The region recorded the highest number of cases in the world. The countries in the region faced severe disruptions in the aerospace & defense, transportation, healthcare, smart cities, and mining sectors, leading to complete or partial shutdown of manufacturing units. Thus, the RF tunable filter industry , too, has been affected by this crisis.
The supply chains of major RF tunable filter manufacturers, especially those based in the US, the UK, China, Brazil, India, and France, have been significantly affected by the pandemic. Before the outbreak of the COVID-19 pandemic, RF tunable filter manufacturers were optimistic that 2020 would witness normalization in inventory levels, fueled by the rise in deployment of 5G technology and the smartphone using population worldwide. However, the demand for RF tunable filters has reduced significantly after the virus outbreak. Nevertheless, the global demand for RF tunable filters increased post-Q1 of 2021.
Market Dynamics of RF Tunable Filter Market
How does aerospace & defense industry increases the demand for RF tunable filter?
The aerospace & defense industry generates a high demand for RF tunable filters, as the communication systems aid forces on the war grounds. Thus, the aerospace & defense industry players mainly focus on modernizing combat and tactical vehicles to improve ground forces’ mobility, protection, and lethality. Combat and tactical vehicles use modern digitized electronics for command, control, communication, surveillance, target acquisition, and reconnaissance (C4ISTAR) applications. C4ISTAR provides commanders and crew enhanced situational awareness, secure and dynamic network connectivity, and improved combat effectiveness. Maintaining constant mobile communications regardless of location has increased the demand for Satellite Communication (SATCOM), particularly for SATCOM on-the-move (SOTM) products and service offerings. These SOTM systems use antennas that operate in Ku and Ka frequency bands to deliver higher data rates at the fleet and unit levels. Also, they provide secure, beyond-line-of-sight communications for military troops operating in remote locations. RF tunable filters enable high-quality voice and data communication. Thus, they are widely used in the global aerospace & defense industry.
How high capital requirement and short life cycle of RF tunable filters restraining the market growth?
Manufacturing of RF tunable filters requires substantial capital. These tunable filters use several accurate tuning components, such as SAW filters, oscillator filters, RF MEMS capacitors, digitally tunable capacitors (DTCs), varactor diodes, and surface-mount device (SMD) variants. To shift from one tuning component to another, companies need to consider several factors such as the requirements of end users, trends in the semiconductor industry, and frequency or bandwidth range. For this purpose, RF tunable filter manufacturing companies must consistently invest in R&D.
Is increase in deployment of 5G technology and adoption of IoT devices would be one of the opportunity for filter manufacturers?
5G technology is pushing the boundaries of wireless communications, enabling use cases that rely on ultra-fast speeds, low latency, and high reliability. The necessity of higher data rates, better coverage, and greater spectral efficiency demands 5G network infrastructure development. This network can handle multiple modes and frequencies to migrate legacy systems to 5G. Several manufacturers, including EXFO Inc., NXP Semiconductors, and NewEdge Signal Solutions Inc., are working on developing 5G-enabled RF solutions to address the high growth areas. The 3rd Generation Partnership Project (3GPP) has developed a new radio access technology called 5G new radio (NR), designed to become the standard for 5G networks worldwide. The 5G NR includes several low and mid-frequency bands in the sub-7 GHz range, defined as FR1, and higher frequency bands above 24 GHz, defined as FR2/mmWave. 5G frequency includes all previous cellular spectrum and additional spectrum in the sub-7 GHz frequency range and beyond to overcome the physical limitations associated with throughput and bandwidth.
How rising complexity and shrinking size of electronic devices is impacting growth of the market?
The electronics industry is focusing on integrating multiple functionalities on a single chip. This will help the industry to offer advanced, power-efficient, and cost-optimized solutions. However, using a higher switching frequency in these devices is necessary, thereby presenting unique design-related challenges. This complexity in the design structure of control algorithms pulls down the switching speed, affecting the overall performance of the control structure. These complex devices require high specialization, robust methodology, and toolset for integration, posing a challenge for players in the RF tunable filter market.
RF Tunable Filter Ecosystem

To know about the assumptions considered for the study, download the pdf brochure
The RF tunable filter market for the bandpass filter segment is projected to capture a larger share of the overall market during the forecast period. They are the simplest tunable filters with a straightforward control mechanism, widely used in wireless transmitters and receivers. They are ideal for wireless communication applications in aerospace & defense, communications, and healthcare industries.
The mechanical tuning segment is expected to account for the largest share of the overall market in 2022
The RF tunable filter market for the mechanical tuning segment is expected to account for the largest share of the overall market in 2022, and the trend is expected to continue during the forecast period. Mechanical tuning is the traditional tuning method and offers high Q factor and linearity, and is capable of superior power handling.
The varactor diode segment is expected to hold the largest share of the overall market in 2022
The RF tunable filter market for the varactor diode segment is expected to hold the largest share of the overall market in 2022. The growth of this segment can be attributed to the rising use of varactor diodes due to their several features, including low power loss, low DC power consumption, high linearity, resistance to high voltage and high current, wide tuning range, high reliability, low cost, low area usage, and capability of adjusting the frequency with a high tuning speed.
The handheld and pocket radio segment is expected to dominate the RF tunable filter market, from 2022 to 2027
The handheld and pocket radio segment is expected to dominate the RF tunable filter market, registering the highest CAGR (13.7%) from 2022 to 2027. The growth can be attributed to huge deployment of handheld and pocket radios integrated with the RF filters in military, aerospace, and defense applications for smooth communication. Also, these devices adhere to several military standards, including electromagnetic capability, nuclear survivability, and electrical characteristics of a digital interface.
Asia Pacific is expected to register the highest growth in the RF tunable filter market during the forecast period
The RF tunable filter market in the Asia Pacific is expected to register the highest growth during the forecast period, as it is an ideal solution for secure and smooth communication in various end user applications such as aerospace and defense, transportation, healthcare, mining, and smart cities in the region.
Key Market Players
Analog Devices, Inc. (US), Dover Corporation (US), Smiths Group plc (UK), The LGL Group, Inc. (US), EXFO Inc. (Canada), DiCon Fiberoptics, Inc. (US), Netcom, Inc. (US), RF Products Inc. (US), Telonic Berkeley Corporation (US), and Coleman Microwave Company (US) are some of the RF tunable filter companies.
RF Tunable Filter Market Report Scope :
|
Report Metric |
Details |
| Market Size Value in 2022 | USD 168 Million |
| Revenue Forecast in 2027 | USD 100 Million |
| Growth Rate | 10.8% |
|
Market size available for years |
2018–2027 |
|
Base year considered |
2021 |
|
Forecast period |
2022–2027 |
|
Forecast unit |
Value (USD Million/Thousand) |
|
Segments covered |
|
|
|
|
|
Market Leaders |
|
| Largest Growing Region | Asia Pacific |
| Largest Market Share Segment | Mechanical tuning segment |
This research report categorizes the RF tunable filter market based on type, tuning mechanism, tuning component, system, application, and geography.
RF Tunable Filter Market:
Based on Type
- Band Pass Filter
- Band Reject Filter
Based on Tuning Mechanism
- Mechanical Tuning
- Electronic Tuning
- Magnetic Tuning
Based on Tuning Component
- Surface Acoustic Wave (SAW) Filter
- Varactor Diode
- MEMS Capacitor
- Oscillator Filters
- Digitally Tunable Capacitor (DTC)
- Surface Mount Device (SMD) Variant
Based on System
- Handheld and Pocket Radio
- Radar System
- RF Amplifier
- Software-defined Radio
- Mobile Antenna
- Avionics Communication System
- Test and Measurement Systems
Based on Application
- Aerospace and Defense
- Smart Cities
- Transportation
- TV White Spaces
- Healthcare
- Energy and Power
- Mining
Based on Geography
-
North America
- US
- Canada
- Mexico
-
Europe
- UK
- Germany
- France
- Rest of Europe
-
Aisa Pacific
- China
- Japan
- India
- South Korea
- Rest of Asia Pacific
-
Rest of the world
- Middle East and Africa
- South America
Recent Developments
- In September 2021, MtronPTI partnered with Digi-Key Electronics, a leading electronic component distributor, to distribute its crystal resonators, filters, and oscillators to its customers worldwide.
- In August 2021, RF Products Inc. received a contract from the US Navy for a new production release of ultra-high frequency (UHF), 225–400 MHz, 4-port, tunable filter/multi-couplers.
- In October 2020, Analog Devices, Inc. collaborated with NEC Corporation to design a massive 5G network MIMO antenna radio unit for Rakuten mobile. The RF equipment offered by Analog Devices, Inc. allows NEC to provide the connectivity required to build an architecture that supports 5G spectrum systems.
- In September 2020, Smiths Interconnect expanded its Qualification and Test Laboratory in Suzhou, China, to offer a one-stop shop for necessary qualification and testing of Smiths Interconnect’s semiconductor test products manufactured in China.
- In August 2019, Pole/Zero Corporation has launched the next-generation line of NANO-POLE tunable bandpass filters. The filter is available in a smaller package and requires higher power.
Frequently Asked Questions (FAQ):
Which is the potential market for RF tunable filters in terms of the region?
The North America region is expected to dominate the RF tunable filter market due to the presence of numerous consumers and suppliers of RF tunable filters.
Which are the major companies in the global RF tunable filter market? What are their major strategies to strengthen their market presence?
Analog Devices, Inc. (US), Dover Corporation (US), Smiths Group plc (UK), The LGL Group, Inc. (US), and EXFO Inc. (Canada), are some of the key players in the RF tunable filter market. These players have adopted various growth strategies such as product launches, collaborations, partnerships, contracts, agreements, acquisitions, and expansions to expand their global presence and increase their share in the global RF tunable filter market.
What are the major opportunities for the RF tunable filter market?
Increased adoption of IoT by different industries and the increasing deployment of 5G technology and adoption of IoT devices are among the key opportunities that are expected to support market growth in future.
What are the growing applications in the RF tunable filter market?
The RF tunable filter market is led by aerospace and defense segment. Besides, the demand from smart cities and transportation segments is expected to generate huge demand for RF tunable filters in future.
What is the impact of COVID-19 on the global RF tunable filter market?
Due to COVID-19, the manufacturing units of major players are highly hampered due to worldwide lockdown and limited availability of labor and raw material. A number of scheduled product launches and related developments have been postponed due to the pandemic. However, the impact of COVID-19 is expected to reduce during the forecast period. .
To speak to our analyst for a discussion on the above findings, click Speak to Analyst
 Exclusive indicates content/data unique to MarketsandMarkets and not available with any competitors.
TABLE OF CONTENTS
1 INTRODUCTION (Page No. - 27)
1.1 STUDY OBJECTIVES
1.2 DEFINITION AND SCOPE
1.2.1 INCLUSIONS AND EXCLUSIONS
1.3 STUDY SCOPE
1.3.1 MARKETS COVERED
FIGURE 1 RF TUNABLE FILTER MARKET SEGMENTATION
1.3.2 GEOGRAPHIC SCOPE
1.3.3 YEARS CONSIDERED
1.4 CURRENCY
1.5 UNITS CONSIDERED
1.6 STAKEHOLDERS
1.7 SUMMARY OF CHANGES
2 RESEARCH METHODOLOGY (Page No. - 33)
2.1 RESEARCH DATA
FIGURE 2 RF TUNABLE FILTER MARKET: RESEARCH DESIGN
2.1.1 SECONDARY & PRIMARY RESEARCH
2.1.2 SECONDARY DATA
2.1.2.1 List of key secondary sources
2.1.2.2 Secondary sources
2.1.3 PRIMARY DATA
2.1.3.1 Primary interviews with experts
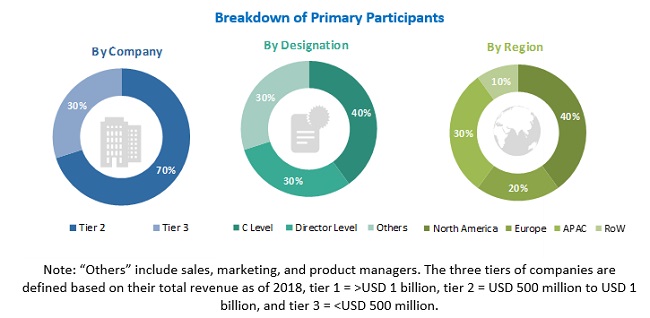
2.1.3.2 Breakdown of primaries
2.1.3.3 Key data from primary sources
2.1.3.4 Key industry insights
2.2 FACTOR ANALYSIS
FIGURE 3 MARKET SIZE ESTIMATION METHODOLOGY: APPROACH 1 – TOP-DOWN (SUPPLY SIDE): REVENUES GENERATED BY COMPANIES FROM SALES OF RF TUNABLE FILTERS
FIGURE 4 MARKET SIZE ESTIMATION METHODOLOGY: APPROACH 1 – TOP-DOWN (SUPPLY SIDE): ILLUSTRATION OF REVENUE ESTIMATIONS FOR ONE COMPANY IN RF TUNABLE FILTER MARKET
FIGURE 5 MARKET SIZE ESTIMATION METHODOLOGY: APPROACH 3 – BOTTOM-UP (DEMAND SIDE): DEMAND FOR RF TUNABLE FILTERS, BY TYPE
2.3 MARKET SIZE ESTIMATION
2.3.1 BOTTOM-UP APPROACH
2.3.1.1 Approach for arriving at market size by bottom-up analysis (demand side)
FIGURE 6 RF TUNABLE FILTER MARKET: BOTTOM-UP APPROACH
2.3.2 TOP-DOWN APPROACH
2.3.2.1 Approach for capturing market size by top-down analysis (supply side)
FIGURE 7 RF TUNABLE FILTER MARKET: TOP-DOWN APPROACH
2.4 MARKET BREAKDOWN AND DATA TRIANGULATION
FIGURE 8 DATA TRIANGULATION
2.5 RESEARCH ASSUMPTIONS
2.5.1 ASSUMPTIONS
2.5.2 LIMITATIONS
2.6 RISK ASSESSMENT
3 EXECUTIVE SUMMARY (Page No. - 46)
3.1 IMPACT OF COVID-19 PANDEMIC ON RF TUNABLE FILTER MARKET
FIGURE 9 GLOBAL PROPAGATION OF COVID-19
TABLE 1 RECOVERY SCENARIOS FOR GLOBAL ECONOMY
3.1.1 REALISTIC SCENARIO
3.1.2 OPTIMISTIC SCENARIO
3.1.3 PESSIMISTIC SCENARIO
FIGURE 10 GROWTH PROJECTIONS OF RF TUNABLE FILTER MARKET IN REALISTIC, OPTIMISTIC, AND PESSIMISTIC SCENARIOS
FIGURE 11 SURFACE-MOUNT DEVICE VARIANT SEGMENT TO REGISTER HIGHEST CAGR IN RF TUNABLE FILTER MARKET, BY TUNING COMPONENT, DURING 2022–2027
FIGURE 12 HANDHELD AND POCKET RADIO SEGMENT TO HOLD LARGEST SHARE OF RF TUNABLE FILTER MARKET, BY SYSTEM, IN 2027
FIGURE 13 SMART CITIES SEGMENT TO RECORD HIGHEST CAGR IN MARKET, BY APPLICATION, DURING FORECAST PERIOD
FIGURE 14 ASIA PACIFIC TO REGISTER HIGHEST CAGR IN MARKET FROM 2022 TO 2027
4 PREMIUM INSIGHTS (Page No. - 53)
4.1 ATTRACTIVE GROWTH OPPORTUNITIES IN RF TUNABLE FILTER MARKET
FIGURE 15 INCREASING FOCUS ON DEPLOYMENT OF 5G TECHNOLOGY TO FUEL MARKET GROWTH FROM 2022 TO 2027
4.2 MARKET, BY TYPE
FIGURE 16 BANDPASS FILTER SEGMENT TO ACCOUNT LARGER SHARE OF MARKET IN 2027
4.3 MARKET, BY TUNING MECHANISM
FIGURE 17 MECHANICAL TUNING SEGMENT TO HOLD LARGEST SHARE OF MARKET IN 2027
4.4 MARKET, BY TUNING COMPONENT
FIGURE 18 MEMS CAPACITOR SEGMENT TO HOLD LARGEST SHARE OF MARKET IN 2027
4.5 MARKET, BY SYSTEM
FIGURE 19 HANDHELD AND POCKET RADIO SEGMENT TO ACCOUNT FOR LARGEST SHARE OF MARKET IN 2027
4.6 MARKET, BY APPLICATION
FIGURE 20 AEROSPACE AND DEFENSE SEGMENT TO CAPTURE LARGEST SHARE OF MARKET IN 2027
4.7 RF TUNABLE FILTER MARKET, BY REGION
FIGURE 21 NORTH AMERICA TO LEAD RF TUNABLE FILTER MARKET IN 2027
4.8 MARKET, BY COUNTRY
FIGURE 22 CHINA TO REGISTER HIGHEST CAGR IN GLOBAL RF TUNABLE FILTER MARKET DURING FORECAST PERIOD
5 MARKET OVERVIEW (Page No. - 58)
5.1 INTRODUCTION
5.2 MARKET DYNAMICS
FIGURE 23 RF TUNABLE FILTER MARKET: DRIVERS, RESTRAINTS, OPPORTUNITIES, AND CHALLENGES
5.2.1 DRIVERS
5.2.1.1 Rising demand for RF tunable filters in aerospace & defense industry
5.2.1.2 Increasing demand for 5G smartphones, smartphones, and mobile phones
FIGURE 24 NUMBER OF SMARTPHONE AND MOBILE PHONE USERS GLOBALLY (BILLION) (2020–2025)
5.2.1.3 Escalating demand for software-defined radios to be deployed in military communication equipment
FIGURE 25 RF TUNABLE FILTER MARKET DRIVERS AND THEIR IMPACT
5.2.2 RESTRAINTS
5.2.2.1 Requirement for high capital and short life cycle of RF tunable filters
FIGURE 26 MARKET RESTRAINTS AND THEIR IMPACT
5.2.3 OPPORTUNITIES
5.2.3.1 Increased adoption of IoT by different industries
5.2.3.2 Increasing deployment of 5G technology and adoption of IoT devices
5.2.3.3 High demand for telematics and infotainment equipment from automotive sector
FIGURE 27 MARKET OPPORTUNITIES AND THEIR IMPACT
5.2.4 CHALLENGES
5.2.4.1 High regulatory barriers
5.2.4.2 Designing constant bandwidth RF tunable filters
5.2.4.3 Rising complexity and shrinking size of electronic devices
FIGURE 28 RF TUNABLE FILTER MARKET CHALLENGES AND THEIR IMPACT
5.3 SUPPLY CHAIN ANALYSIS
FIGURE 29 SUPPLY CHAIN OF RF TUNABLE FILTER MARKET
5.4 ECOSYSTEM
FIGURE 30 RF TUNABLE FILTER ECOSYSTEM
TABLE 2 LIST OF RF TUNABLE FILTER PROVIDERS
5.5 PRICING ANALYSIS
TABLE 3 AVERAGE SELLING PRICES OF RF TUNABLE FILTERS, BY TYPE
FIGURE 31 AVERAGE SELLING PRICES OF RF TUNABLE FILTERS OFFERED BY KEY PLAYERS, BY TYPE
TABLE 4 AVERAGE SELLING PRICES OF RF TUNABLE FILTERS OFFERED BY KEY PLAYERS, BY TYPE
FIGURE 32 AVERAGE SELLING PRICE TREND FOR BANDPASS AND BAND REJECT FILTERS, 2018–2027 (USD)
5.6 TRENDS/DISRUPTIONS IMPACTING BUSINESS OF MARKET PLAYERS AND RAW MATERIAL SUPPLIERS
5.6.1 REVENUE SHIFT AND NEW REVENUE POCKETS FOR MARKET PLAYERS
FIGURE 33 REVENUE SHIFT IN MARKET
5.7 TECHNOLOGY ANALYSIS
5.7.1 KEY TECHNOLOGIES
5.7.1.1 Radiofrequency
5.7.2 COMPLEMENTARY TECHNOLOGIES
5.7.2.1 MEMS technology
5.7.2.2 Bluetooth low energy (BLE)
5.8 PORTER’S FIVE FORCE ANALYSIS
TABLE 5 RF TUNABLE FILTER MARKET: PORTER’S FIVE FORCES ANALYSIS
FIGURE 34 PORTER’S FIVE FORCES ANALYSIS
5.8.1 INTENSITY OF COMPETITIVE RIVALRY
5.8.2 THREAT OF SUBSTITUTES
5.8.3 BARGAINING POWER OF BUYERS
5.8.4 BARGAINING POWER OF SUPPLIERS
5.8.5 THREAT OF NEW ENTRANTS
5.9 KEY STAKEHOLDERS & BUYING CRITERIA
5.9.1 KEY STAKEHOLDERS IN BUYING PROCESS
FIGURE 35 INFLUENCE OF STAKEHOLDERS IN BUYING PROCESS FOR MAJOR APPLICATIONS
TABLE 6 INFLUENCE OF STAKEHOLDERS IN BUYING PROCESS FOR MAJOR APPLICATIONS (%)
5.9.2 BUYING CRITERIA
FIGURE 36 KEY BUYING CRITERIA FOR MAJOR APPLICATION
TABLE 7 KEY BUYING CRITERIA FOR MAJOR APPLICATIONS
5.10 CASE STUDIES
TABLE 8 DEVELOPING METOP-SG SATELLITES FOR DEFENSE AND SPACE APPLICATIONS
TABLE 9 QORVO’S FILTERS HELP TO INCREASE RANGE AND EFFICIENCY OF RADIO WITHIN PACEMAKER
5.11 TRADE ANALYSIS
5.11.1 IMPORT SCENARIO
TABLE 10 IMPORT DATA, BY COUNTRY, 2017–2021 (USD BILLION)
FIGURE 37 RF TUNABLE FILTER, IMPORT VALUES FOR MAJOR COUNTRIES, 2017–2021
5.11.2 EXPORT SCENARIO
TABLE 11 EXPORT DATA, BY COUNTRY, 2017–2021 (USD BILLION)
FIGURE 38 RF TUNABLE FILTER, EXPORT VALUES FOR MAJOR COUNTRIES, 2017–2021
5.12 PATENT ANALYSIS
FIGURE 39 PATENTS GRANTED WORLDWIDE, 2012–2021
TABLE 12 TOP 20 PATENT OWNERS IN US, 2012–2021
FIGURE 40 TOP 10 COMPANIES WITH HIGHEST NUMBER OF PATENT APPLICATIONS, 2012–2021
5.13 KEY CONFERENCES AND EVENTS BETWEEN 2022 AND 2023
TABLE 13 RF TUNABLE FILTER MARKET: DETAILED LIST OF CONFERENCES AND EVENTS
5.14 TARIFFS AND REGULATIONS
5.14.1 TARIFFS
5.14.2 REGULATORY COMPLIANCE
5.14.2.1 North America
5.14.2.2 Europe
5.14.3 STANDARDS
6 RF TUNABLE FILTER MARKET, BY TYPE (Page No. - 87)
6.1 INTRODUCTION
FIGURE 41 RF TUNABLE FILTER MARKET, BY TYPE
FIGURE 42 BANDPASS FILTER SEGMENT TO HOLD LARGER SHARE OF MARKET FROM 2022 TO 2027
TABLE 14 MARKET, BY TYPE, 2018–2021 (USD MILLION)
TABLE 15 MARKET, BY TYPE, 2022–2027 (USD MILLION)
TABLE 16 MARKET, BY TYPE, 2018–2021 (THOUSAND UNITS)
TABLE 17 MARKET, BY TYPE, 2022–2027 (THOUSAND UNITS)
6.2 BANDPASS FILTER
6.2.1 CAPABILITY OF ATTENUATING HIGH AND LOW FREQUENCIES TO FUEL DEMAND FOR BANDPASS FILTERS
TABLE 18 BANDPASS: MARKET, BY SYSTEM, 2018–2021 (USD THOUSAND)
TABLE 19 BANDPASS: MARKET, BY SYSTEM, 2022–2027 (USD THOUSAND)
TABLE 20 BANDPASS: MARKET, BY APPLICATION, 2018–2021 (USD THOUSAND)
TABLE 21 BANDPASS: MARKET, BY APPLICATION, 2022–2027 (USD THOUSAND)
TABLE 22 BANDPASS: MARKET, BY REGION, 2018–2021 (USD THOUSAND)
TABLE 23 BANDPASS: MARKET, BY REGION, 2022–2027 (USD THOUSAND)
6.3 BAND REJECT FILTER
6.3.1 BAND REJECT FILTER SEGMENT TO REGISTER HIGHER CAGR DURING FORECAST PERIOD
TABLE 24 BAND REJECT: MARKET, BY SYSTEM, 2018–2021 (USD THOUSAND)
TABLE 25 BAND REJECT: MARKET, BY SYSTEM, 2022–2027 (USD THOUSAND)
TABLE 26 BAND REJECT: MARKET, BY APPLICATION, 2018–2021 (USD THOUSAND)
TABLE 27 BAND REJECT: MARKET, BY APPLICATION, 2022–2027 (USD THOUSAND)
TABLE 28 BAND REJECT: MARKET, BY REGION, 2018–2021 (USD THOUSAND)
TABLE 29 BAND REJECT: MARKET, BY REGION, 2022–2027 (USD THOUSAND)
7 RF TUNABLE FILTER MARKET, BY TUNING MECHANISM (Page No. - 95)
7.1 INTRODUCTION
FIGURE 43 MARKET, BY TUNING MECHANISM
FIGURE 44 MECHANICAL TUNING SEGMENT TO HOLD LARGEST SHARE OF RF TUNABLE FILTER MARKET, BY TUNING MECHANISM, IN 2022
TABLE 30 RF TUNABLE FILTER MARKET, BY TUNING MECHANISM, 2018–2021 (USD MILLION)
TABLE 31 RF TUNABLE FILTER MARKET, BY TUNING MECHANISM, 2022–2027 (USD MILLION)
7.2 MECHANICAL TUNING
7.2.1 MECHANICAL TUNING SEGMENT TO LEAD RF TUNABLE FILTER MARKET
TABLE 32 MECHANICAL TUNING: MARKET, BY REGION, 2018–2021 (USD THOUSAND)
TABLE 33 MECHANICAL TUNING: MARKET, BY REGION, 2022–2027 (USD THOUSAND)
7.3 ELECTRONIC TUNING
7.3.1 FAST TUNING SPEED OF ELECTRONICALLY TUNED RF FILTERS TO FUEL THEIR DEMAND
TABLE 34 ELECTRONIC TUNING: MARKET, BY REGION, 2018–2021 (USD THOUSAND)
TABLE 35 ELECTRONIC TUNING: MARKET, BY REGION, 2022–2027 (USD THOUSAND)
7.4 MAGNETIC TUNING
7.4.1 MAGNETIC TUNING SEGMENT TO REGISTER HIGHEST CAGR DURING FORECAST PERIOD
TABLE 36 MAGNETIC TUNING: MARKET, BY REGION, 2018–2021 (USD THOUSAND)
TABLE 37 MAGNETIC TUNING: MARKET, BY REGION, 2022–2027 (USD THOUSAND)
8 RF TUNABLE FILTER MARKET, BY TUNING COMPONENT (Page No. - 101)
8.1 INTRODUCTION
FIGURE 45 RF TUNABLE FILTER MARKET, BY TUNING COMPONENT
FIGURE 46 VARACTOR DIODE SEGMENT TO ACCOUNT FOR LARGEST SHARE OF RF TUNABLE FILTER MARKET IN 2022
TABLE 38 RF TUNABLE FILTER MARKET, BY TUNING COMPONENT, 2018–2021 (USD MILLION)
TABLE 39 RF TUNABLE FILTER MARKET, BY TUNING COMPONENT, 2022–2027 (USD MILLION)
8.2 SURFACE ACOUSTIC WAVE (SAW) FILTER
8.2.1 SURFACE ACOUSTIC WAVE (SAW) FILTERS ARE IDEAL FOR APPLICATIONS REQUIRING UP TO 3 GHZ FREQUENCY
FIGURE 47 NORTH AMERICA TO HOLD LARGEST SHARE OF RF TUNABLE FILTER MARKET FOR SAW FILTERS IN 2022
TABLE 40 SAW FILTER: MARKET, BY REGION, 2018–2021 (USD THOUSAND)
TABLE 41 SAW FILTER: MARKET, BY REGION, 2022–2027 (USD THOUSAND)
8.3 VARACTOR DIODE
8.3.1 VARACTOR DIODES ARE SMALL IN SIZE, LESS EXPENSIVE, LIGHT IN WEIGHT, AND HAVE HIGH TUNING SPEED
TABLE 42 VARACTOR DIODE: MARKET, BY REGION, 2018–2021 (USD THOUSAND)
TABLE 43 VARACTOR DIODE: MARKET, BY REGION, 2022–2027 (USD THOUSAND)
8.4 MEMS CAPACITORS
8.4.1 MEMS TECHNOLOGY AND RF MEMS VARIABLE CAPACITOR-BASED TUNABLE FILTERS USED IN COMMUNICATION SYSTEMS
TABLE 44 MEMS CAPACITOR: MARKET, BY REGION, 2018–2021 (USD THOUSAND)
TABLE 45 MEMS CAPACITOR: MARKET, BY REGION, 2022–2027 (USD THOUSAND)
8.5 OSCILLATOR FILTER
8.5.1 OSCILLATOR FILTERS ARE SUITABLE FOR COMMUNICATION APPLICATIONS
TABLE 46 OSCILLATOR FILTER: MARKET, BY REGION, 2018–2021 (USD THOUSAND)
TABLE 47 OSCILLATOR FILTER: MARKET, BY REGION, 2022–2027 (USD THOUSAND)
8.6 DIGITALLY TUNABLE CAPACITOR
8.6.1 DIGITALLY TUNABLE CAPACITORS ARE CAPABLE OF DIGITALLY CONTROLLING VARIABLE CAPACITORS
TABLE 48 DIGITALLY TUNABLE CAPACITOR: MARKET, BY REGION, 2018–2021 (USD THOUSAND)
TABLE 49 DIGITALLY TUNABLE CAPACITOR: MARKET, BY REGION, 2022–2027 (USD THOUSAND)
8.7 SURFACE-MOUNT DEVICE VARIANT
8.7.1 SURFACE-MOUNT DEVICE (SMD) PACKAGES ARE DEPLOYED IN CONSUMER ELECTRONIC DEVICES
FIGURE 48 ASIA PACIFIC TO REGISTER HIGHEST CAGR IN RF TUNABLE FILTER MARKET FOR SURFACE-MOUNT DEVICE VARIANTS DURING FORECAST PERIOD
TABLE 50 SURFACE-MOUNT DEVICE VARIANT: MARKET, BY REGION, 2018–2021 (USD THOUSAND)
TABLE 51 SURFACE-MOUNT DEVICE VARIANT: MARKET, BY REGION, 2022–2027 (USD THOUSAND)
9 RF TUNABLE FILTER MARKET, BY SYSTEM (Page No. - 112)
9.1 INTRODUCTION
FIGURE 49 RF TUNABLE FILTER MARKET, BY SYSTEM
FIGURE 50 HANDHELD AND POCKET RADIO SEGMENT TO CAPTURE LARGEST SHARE OF RF TUNABLE FILTER MARKET DURING FORECAST PERIOD
TABLE 52 MARKET, BY SYSTEM, 2018–2021 (USD MILLION)
TABLE 53 MARKET, BY SYSTEM, 2022–2027 (USD MILLION)
9.2 HANDHELD AND POCKET RADIO
9.2.1 RF TUNABLE FILTERS HELP ACHIEVE DESIRED FREQUENCY FOR SECURE COMMUNICATION
TABLE 54 HANDHELD AND POCKET RADIO: MARKET, BY TYPE, 2018–2021 (USD MILLION)
TABLE 55 HANDHELD AND POCKET RADIO: MARKET, BY TYPE, 2022–2027 (USD MILLION)
FIGURE 51 NORTH AMERICA TO HOLD LARGEST SHARE OF RF TUNABLE FILTER MARKET FOR HANDHELD AND POCKET RADIOS IN 2022
TABLE 56 HANDHELD AND POCKET RADIO: MARKET, BY REGION, 2018–2021 (USD THOUSAND)
TABLE 57 HANDHELD AND POCKET RADIO: MARKET, BY REGION, 2022–2027 (USD THOUSAND)
9.3 RADAR SYSTEM
9.3.1 RADAR SYSTEMS ARE HIGHLY USED IN MILITARY, AIR TRAFFIC CONTROL, GROUND TRAFFIC CONTROL, SPACE, AND REMOTE SENSING APPLICATIONS
TABLE 58 RADAR SYSTEM: MARKET, BY TYPE, 2018–2021 (USD MILLION)
TABLE 59 RADAR SYSTEM: MARKET, BY TYPE, 2022–2027 (USD MILLION)
TABLE 60 RADAR SYSTEM: MARKET, BY REGION, 2018–2021 (USD THOUSAND)
TABLE 61 RADAR SYSTEM: MARKET, BY REGION, 2022–2027 (USD THOUSAND)
9.4 RF AMPLIFIER
9.4.1 RF AMPLIFIERS ARE IDEAL FOR AEROSPACE AND DEFENSE, INDUSTRIAL, AND HEALTHCARE APPLICATIONS
TABLE 62 RF AMPLIFIER: MARKET, BY TYPE, 2018–2021 (USD THOUSAND)
TABLE 63 RF AMPLIFIER: MARKET, BY TYPE, 2022–2027 (USD THOUSAND)
TABLE 64 RF AMPLIFIER: MARKET, BY REGION, 2018–2021 (USD THOUSAND)
TABLE 65 RF AMPLIFIER: MARKET, BY REGION, 2022–2027 (USD THOUSAND)
9.5 SOFTWARE-DEFINED RADIO
9.5.1 SOFTWARE-DEFINED RADIO ARCHITECTURE SUPPORTS MULTI-BAND AND MULTI-STANDARD OPERATIONS
TABLE 66 SOFTWARE-DEFINED RADIO: MARKET, BY TYPE, 2018–2021 (USD MILLION)
TABLE 67 SOFTWARE-DEFINED RADIO: MARKET, BY TYPE, 2022–2027 (USD MILLION)
TABLE 68 SOFTWARE-DEFINED RADIO: MARKET, BY REGION, 2018–2021 (USD THOUSAND)
TABLE 69 SOFTWARE-DEFINED RADIO: MARKET, BY REGION, 2022–2027 (USD THOUSAND)
9.6 MOBILE ANTENNA
9.6.1 RF TUNABLE FILTER REDUCES POWER AMPLIFIER NOISE
TABLE 70 MOBILE ANTENNA: MARKET, BY TYPE, 2018–2021 (USD MILLION)
TABLE 71 MOBILE ANTENNA: MARKET, BY TYPE, 2022–2027 (USD MILLION)
FIGURE 52 ASIA PACIFIC TO REGISTER HIGHEST CAGR IN RF TUNABLE FILTER MARKET FOR MOBILE ANTENNAS DURING FORECAST PERIOD
TABLE 72 MOBILE ANTENNA: MARKET, BY REGION, 2018–2021 (USD THOUSAND)
TABLE 73 MOBILE ANTENNA: MARKET, BY REGION, 2022–2027 (USD THOUSAND)
9.7 AVIONICS COMMUNICATION SYSTEM
9.7.1 RF TUNABLE FILTERS ARE USED FOR VOICE TRANSMISSION AND COMMUNICATION APPLICATIONS
TABLE 74 AVIONICS COMMUNICATION SYSTEM: MARKET, BY TYPE, 2018–2021 (USD MILLION)
TABLE 75 AVIONICS COMMUNICATION SYSTEM: MARKET, BY TYPE, 2022–2027 (USD MILLION)
TABLE 76 AVIONICS COMMUNICATION SYSTEM: MARKET, BY REGION, 2018–2021 (USD THOUSAND)
TABLE 77 AVIONICS COMMUNICATION SYSTEM: MARKET, BY REGION, 2022–2027 (USD THOUSAND)
9.8 TEST AND MEASUREMENT INSTRUMENTS
9.8.1 TEST AND MEASUREMENT INSTRUMENTS ARE USED FOR MEASURING SIGNALS IN WIRELESS COMMUNICATION
TABLE 78 TEST AND MEASUREMENT INSTRUMENTS: MARKET, BY TYPE, 2018–2021 (USD THOUSAND)
TABLE 79 TEST AND MEASUREMENT INSTRUMENTS: MARKET, BY TYPE, 2022–2027 (USD THOUSAND)
TABLE 80 TEST AND MEASUREMENT INSTRUMENTS: MARKET, BY REGION, 2018–2021 (USD THOUSAND)
TABLE 81 TEST AND MEASUREMENT INSTRUMENTS: MARKET, BY REGION, 2022–2027 (USD THOUSAND)
10 RF TUNABLE FILTER MARKET, BY APPLICATION (Page No. - 128)
10.1 INTRODUCTION
FIGURE 53 RF TUNABLE FILTER MARKET, BY APPLICATION
FIGURE 54 AEROSPACE AND DEFENSE SEGMENT TO CAPTURE LARGEST SHARE OF RF TUNABLE FILTER MARKET IN 2022
TABLE 82 RF TUNABLE FILTER MARKET, BY APPLICATION, 2018–2021 (USD MILLION)
TABLE 83 RF TUNABLE FILTER MARKET, BY APPLICATION, 2022–2027 (USD MILLION)
10.2 AEROSPACE AND DEFENSE
10.2.1 RF TUNABLE FILTERS ENABLE SECURE COMMUNICATION IN AEROSPACE & DEFENSE INDUSTRY
TABLE 84 AEROSPACE AND DEFENSE: MARKET, BY TYPE, 2018–2021 (USD MILLION)
TABLE 85 AEROSPACE AND DEFENSE: MARKET, BY TYPE, 2022–2027 (USD MILLION)
FIGURE 55 NORTH AMERICA TO HOLD LARGEST SHARE OF RF TUNABLE FILTER MARKET FOR AEROSPACE AND DEFENSE APPLICATION IN 2022
TABLE 86 AEROSPACE AND DEFENSE: MARKET, BY REGION, 2018–2021 (USD THOUSAND)
TABLE 87 AEROSPACE AND DEFENSE: MARKET, BY REGION, 2022–2027 (USD THOUSAND)
10.3 ENERGY AND POWER
10.3.1 HANDHELD AND POCKET RADIOS FACILITATE EFFECTIVE COMMUNICATION IN ENERGY & POWER SECTOR
TABLE 88 ENERGY AND POWER: MARKET, BY TYPE, 2018–2021 (USD THOUSAND)
TABLE 89 ENERGY AND POWER: MARKET, BY TYPE, 2022–2027 (USD THOUSAND)
FIGURE 56 ASIA PACIFIC TO REGISTER HIGHEST CAGR IN RF TUNABLE FILTER MARKET FOR ENERGY AND POWER APPLICATION FROM 2022 TO 2027
TABLE 90 ENERGY AND POWER: MARKET, BY REGION, 2018–2021 (USD THOUSAND)
TABLE 91 ENERGY AND POWER: MARKET, BY REGION, 2022–2027 (USD THOUSAND)
10.4 MINING
10.4.1 RFID TAGS AND COMMUNICATION SYSTEMS INCREASE OPERATIONAL EFFICIENCY OF MINING PLANTS
TABLE 92 MINING: MARKET, BY TYPE, 2018–2021 (USD THOUSAND)
TABLE 93 MINING: MARKET, BY TYPE, 2022–2027 (USD THOUSAND)
TABLE 94 MINING: MARKET, BY REGION, 2018–2021 (USD THOUSAND)
TABLE 95 MINING: MARKET, BY REGION, 2022–2027 (USD THOUSAND)
10.5 TRANSPORTATION
10.5.1 SOFTWARE-DEFINED RADIO (SDR) AND CONNECTING DEVICES IMPROVE COMMUNICATION IN AUTOMOTIVE INDUSTRY
TABLE 96 TRANSPORTATION: MARKET, BY TYPE, 2018–2021 (USD THOUSAND)
TABLE 97 TRANSPORTATION: MARKET, BY TYPE, 2022–2027 (USD THOUSAND)
FIGURE 57 ASIA PACIFIC TO REGISTER HIGHEST GROWTH IN RF TUNABLE FILTER MARKET FOR TRANSPORTATION APPLICATION DURING FORECAST PERIOD
TABLE 98 TRANSPORTATION: MARKET, BY REGION, 2018–2021 (USD THOUSAND)
TABLE 99 TRANSPORTATION: MARKET, BY REGION, 2022–2027 (USD THOUSAND)
10.6 SMART CITIES
10.6.1 SMART CITIES DELIVER INNOVATIVE SERVICES AND HIGHLY DEVELOPED INFRASTRUCTURE
TABLE 100 SMART CITIES: MARKET, BY TYPE, 2018–2021 (USD MILLION)
TABLE 101 SMART CITIES: MARKET, BY TYPE, 2022–2027 (USD MILLION)
FIGURE 58 EUROPE TO HOLD SECOND-LARGEST SHARE OF RF TUNABLE FILTER MARKET FOR SMART CITIES APPLICATION IN 2022
TABLE 102 SMART CITIES: MARKET, BY REGION, 2018–2021 (USD THOUSAND)
TABLE 103 SMART CITIES: MARKET, BY REGION, 2022–2027 (USD THOUSAND)
10.7 TV WHITE SPACES
10.7.1 UNUSED TV BAND SPECTRUM ARE USED FOR WIRELESS APPLICATIONS
TABLE 104 TV WHITE SPACES: MARKET, BY TYPE, 2018–2021 (USD THOUSAND)
TABLE 105 TV WHITE SPACES: MARKET, BY TYPE, 2022–2027 (USD THOUSAND)
TABLE 106 TV WHITE SPACES: MARKET, BY REGION, 2018–2021 (USD THOUSAND)
TABLE 107 TV WHITE SPACES: MARKET, BY REGION, 2022–2027 (USD THOUSAND)
10.8 HEALTHCARE
10.8.1 RF TUNABLE FILTERS OFFER WIRELESS COVERAGE THROUGHOUT HOSPITALS
TABLE 108 HEALTHCARE: MARKET, BY TYPE, 2018–2021 (USD THOUSAND)
TABLE 109 HEALTHCARE: MARKET, BY TYPE, 2022–2027 (USD THOUSAND)
TABLE 110 HEALTHCARE: MARKET, BY REGION, 2018–2021 (USD THOUSAND)
TABLE 111 HEALTHCARE: MARKET, BY REGION, 2022–2027 (USD THOUSAND)
11 OTHER APPLICATIONS OF RF TUNABLE FILTERS (Page No. - 147)
11.1 INTRODUCTION
FIGURE 59 OTHER APPLICATIONS OF RF TUNABLE FILTER MARKET
11.2 CONSTRUCTION
11.3 PUBLIC ADMINISTRATION
11.4 RESEARCH AND DEVELOPMENT
11.5 EVENT MANAGEMENT (PROGRAM MAKING AND SPECIAL EVENTS)
12 VARIOUS FREQUENCY BANDS OF RF TUNABLE FILTERS (Page No. - 149)
12.1 INTRODUCTION
FIGURE 60 VARIOUS FREQUENCY BANDS OF RF TUNABLE FILTER MARKET
12.2 L BAND
12.3 S BAND
12.4 C BAND
12.5 KU BAND
12.6 X BAND
12.7 OTHERS
13 GEOGRAPHIC ANALYSIS (Page No. - 152)
13.1 INTRODUCTION
FIGURE 61 REGIONAL SPLIT OF RF TUNABLE FILTER MARKET
FIGURE 62 NORTH AMERICA TO LEAD GLOBAL RF TUNABLE FILTER MARKET IN 2022
TABLE 112 RF TUNABLE FILTER MARKET, BY REGION, 2018–2021 (USD MILLION)
TABLE 113 RF TUNABLE FILTER MARKET, BY REGION, 2022–2027 (USD MILLION)
13.2 NORTH AMERICA
FIGURE 63 NORTH AMERICA: MARKET SNAPSHOT
TABLE 114 NORTH AMERICA: MARKET, BY COUNTRY, 2018–2021 (USD THOUSAND)
TABLE 115 NORTH AMERICA: MARKET, BY COUNTRY, 2022–2027 (USD THOUSAND)
TABLE 116 NORTH AMERICA: MARKET, BY TYPE, 2018–2021 (USD MILLION)
TABLE 117 NORTH AMERICA: MARKET, BY TYPE, 2022–2027 (USD MILLION)
TABLE 118 NORTH AMERICA: MARKET, BY TUNING MECHANISM, 2018–2021 (USD MILLION)
TABLE 119 NORTH AMERICA: MARKET, BY TUNING MECHANISM, 2022–2027 (USD MILLION)
TABLE 120 NORTH AMERICA: MARKET, BY TUNING COMPONENT, 2018–2021 (USD THOUSAND)
TABLE 121 NORTH AMERICA: MARKET, BY TUNING COMPONENT, 2022–2027 (USD THOUSAND)
TABLE 122 NORTH AMERICA: MARKET, BY SYSTEM, 2018–2021 (USD THOUSAND)
TABLE 123 NORTH AMERICA: MARKET, BY SYSTEM, 2022–2027 (USD THOUSAND)
FIGURE 64 AEROSPACE AND DEFENSE SEGMENT TO DOMINATE MARKET IN NORTH AMERICA, BY APPLICATION, DURING FORECAST PERIOD
TABLE 124 NORTH AMERICA: MARKET, BY APPLICATION, 2018–2021 (USD THOUSAND)
TABLE 125 NORTH AMERICA: MARKET, BY APPLICATION, 2022–2027 (USD THOUSAND)
13.2.1 US
13.2.1.1 High demand for RF tunable filters in aerospace, defense, and navy sectors to drive market growth
TABLE 126 US: MARKET, BY TYPE, 2018–2021 (USD MILLION)
TABLE 127 US: MARKET, BY TYPE, 2022–2027 (USD MILLION)
TABLE 128 US: MARKET, BY TUNING MECHANISM, 2018–2021 (USD MILLION)
TABLE 129 US: MARKET, BY TUNING MECHANISM, 2022–2027 (USD MILLION)
13.2.2 CANADA
13.2.2.1 Canada holds second-largest share of North American market
TABLE 130 CANADA: MARKET, BY TYPE, 2018–2021 (USD THOUSAND)
TABLE 131 CANADA: MARKET, BY TYPE, 2022–2027 (USD THOUSAND)
TABLE 132 CANADA: MARKET, BY TUNING MECHANISM, 2018–2021 (USD THOUSAND)
TABLE 133 CANADA: MARKET, BY TUNING MECHANISM, 2022–2027 (USD THOUSAND)
13.2.3 MEXICO
13.2.3.1 Increase in automotive manufacturing and export to fuel demand for RF tunable filters
FIGURE 65 BANDPASS FILTER SEGMENT TO DOMINATE MEXICO RF TUNABLE FILTER MARKET IN 2022
TABLE 134 MEXICO: MARKET, BY TYPE, 2018–2021 (USD THOUSAND)
TABLE 135 MEXICO: MARKET, BY TYPE, 2022–2027 (USD THOUSAND)
TABLE 136 MEXICO: MARKET, BY TUNING MECHANISM, 2018–2021 (USD THOUSAND)
TABLE 137 MEXICO: MARKET, BY TUNING MECHANISM, 2022–2027 (USD THOUSAND)
13.3 EUROPE
FIGURE 66 EUROPE: RF TUNABLE FILTER MARKET SNAPSHOT
TABLE 138 EUROPE: MARKET, BY COUNTRY, 2018–2021 (USD THOUSAND)
TABLE 139 EUROPE: MARKET, BY COUNTRY, 2022–2027 (USD THOUSAND)
TABLE 140 EUROPE: MARKET, BY TYPE, 2018–2021 (USD MILLION)
TABLE 141 EUROPE: MARKET, BY TYPE, 2022–2027 (USD MILLION)
FIGURE 67 MECHANICAL TUNING SEGMENT TO CAPTURE LARGEST SHARE OF RF TUNABLE FILTER MARKET IN EUROPE DURING FORECAST PERIOD
TABLE 142 EUROPE: MARKET, BY TUNING MECHANISM, 2018–2021 (USD THOUSAND)
TABLE 143 EUROPE: MARKET, BY TUNING MECHANISM, 2022–2027 (USD THOUSAND)
TABLE 144 EUROPE: MARKET, BY TUNING COMPONENT, 2018–2021 (USD THOUSAND)
TABLE 145 EUROPE: MARKET, BY TUNING COMPONENT, 2022–2027 (USD THOUSAND)
TABLE 146 EUROPE: MARKET, BY SYSTEM, 2018–2021 (USD THOUSAND)
TABLE 147 EUROPE: MARKET, BY SYSTEM, 2022–2027 (USD THOUSAND)
TABLE 148 EUROPE: MARKET, BY APPLICATION, 2018–2021 (USD THOUSAND)
TABLE 149 EUROPE: MARKET, BY APPLICATION, 2022–2027 (USD THOUSAND)
13.3.1 UK
13.3.1.1 Digital services with high-speed data networking to drive market growth in UK
FIGURE 68 BANDPASS FILTER SEGMENT TO HOLD LARGER SHARE OF MARKET IN UK DURING FORECAST PERIOD
TABLE 150 UK: MARKET, BY TYPE, 2018–2021 (USD THOUSAND)
TABLE 151 UK: MARKET, BY TYPE, 2022–2027 (USD THOUSAND)
TABLE 152 UK: MARKET, BY TUNING MECHANISM, 2018–2021 (USD THOUSAND)
TABLE 153 UK: MARKET, BY TUNING MECHANISM, 2022–2027 (USD THOUSAND)
13.3.2 GERMANY
13.3.2.1 Technological innovations related to automotive industry are driving market growth in Germany
TABLE 154 GERMANY: MARKET, BY TYPE, 2018–2021 (USD THOUSAND)
TABLE 155 GERMANY: MARKET, BY TYPE, 2022–2027 (USD THOUSAND)
TABLE 156 GERMANY: MARKET, BY TUNING MECHANISM, 2018–2021 (USD THOUSAND)
TABLE 157 GERMANY: MARKET, BY TUNING MECHANISM, 2022–2027 (USD THOUSAND)
13.3.3 FRANCE
13.3.3.1 Urgent need for strong security measures and public safety in France to spur market growth
TABLE 158 FRANCE: MARKET, BY TYPE, 2018–2021 (USD THOUSAND)
TABLE 159 FRANCE: MARKET, BY TYPE, 2022–2027 (USD THOUSAND)
TABLE 160 FRANCE: MARKET, BY TUNING MECHANISM, 2018–2021 (USD THOUSAND)
TABLE 161 FRANCE: MARKET, BY TUNING MECHANISM, 2022–2027 (USD THOUSAND)
13.3.4 REST OF EUROPE
TABLE 162 REST OF EUROPE: MARKET, BY TYPE, 2018–2021 (USD THOUSAND)
TABLE 163 REST OF EUROPE: MARKET, BY TYPE, 2022–2027 (USD THOUSAND)
TABLE 164 REST OF EUROPE: MARKET, BY TUNING MECHANISM, 2018–2021 (USD THOUSAND)
TABLE 165 REST OF EUROPE: MARKET, BY TUNING MECHANISM, 2022–2027 (USD THOUSAND)
13.4 ASIA PACIFIC
FIGURE 69 ASIA PACIFIC: MARKET SNAPSHOT
TABLE 166 ASIA PACIFIC: MARKET, BY COUNTRY, 2018–2021 (USD THOUSAND)
TABLE 167 ASIA PACIFIC: MARKET, BY COUNTRY, 2022–2027 (USD THOUSAND)
TABLE 168 ASIA PACIFIC: MARKET, BY TYPE, 2018–2021 (USD MILLION)
TABLE 169 ASIA PACIFIC: MARKET, BY TYPE, 2022–2027 (USD MILLION)
TABLE 170 ASIA PACIFIC: MARKET, BY TUNING MECHANISM, 2018–2021 (USD THOUSAND)
TABLE 171 ASIA PACIFIC: MARKET, BY TUNING MECHANISM, 2022–2027 (USD THOUSAND)
FIGURE 70 MEMS CAPACITOR SEGMENT TO DOMINATE RF TUNABLE FILTER MARKET IN ASIA PACIFIC DURING FORECAST PERIOD
TABLE 172 ASIA PACIFIC: MARKET, BY TUNING COMPONENT, 2018–2021 (USD THOUSAND)
TABLE 173 ASIA PACIFIC: MARKET, BY TUNING COMPONENT, 2022–2027 (USD THOUSAND)
TABLE 174 ASIA PACIFIC: MARKET, BY SYSTEM, 2018–2021 (USD THOUSAND)
TABLE 175 ASIA PACIFIC: MARKET, BY SYSTEM, 2022–2027 (USD THOUSAND)
TABLE 176 ASIA PACIFIC: MARKET, BY APPLICATION, 2018–2021 (USD THOUSAND)
TABLE 177 ASIA PACIFIC: MARKET, BY APPLICATION, 2022–2027 (USD THOUSAND)
13.4.1 CHINA
13.4.1.1 Large presence of airports and consumer electronics manufacturers to propel RF tunable filter demand in China
TABLE 178 CHINA: MARKET, BY TYPE, 2018–2021 (USD MILLION)
TABLE 179 CHINA: MARKET, BY TYPE, 2022–2027 (USD MILLION)
TABLE 180 CHINA: MARKET, BY TUNING MECHANISM, 2018–2021 (USD THOUSAND)
TABLE 181 CHINA: MARKET, BY TUNING MECHANISM, 2022–2027 (USD THOUSAND)
13.4.2 JAPAN
13.4.2.1 Deployment of 5G network infrastructure to spur market growth in Japan
TABLE 182 JAPAN: MARKET, BY TYPE, 2018–2021 (USD THOUSAND)
TABLE 183 JAPAN: MARKET, BY TYPE, 2022–2027 (USD THOUSAND)
TABLE 184 JAPAN: MARKET, BY TUNING MECHANISM, 2018–2021 (USD THOUSAND)
TABLE 185 JAPAN: MARKET, BY TUNING MECHANISM, 2022–2027 (USD THOUSAND)
13.4.3 INDIA
13.4.3.1 Affordability of internet-enabled devices is driving their demand in India
TABLE 186 INDIA: MARKET, BY TYPE, 2018–2021 (USD THOUSAND)
TABLE 187 INDIA: MARKET, BY TYPE, 2022–2027 (USD THOUSAND)
TABLE 188 INDIA: MARKET, BY TUNING MECHANISM, 2018–2021 (USD THOUSAND)
TABLE 189 INDIA: MARKET, BY TUNING MECHANISM, 2022–2027 (USD THOUSAND)
13.4.4 SOUTH KOREA
13.4.4.1 Roll out of commercial 5G network to drive market growth
TABLE 190 SOUTH KOREA: MARKET, BY TYPE, 2018–2021 (USD THOUSAND)
TABLE 191 SOUTH KOREA: MARKET, BY TYPE, 2022–2027 (USD THOUSAND)
TABLE 192 SOUTH KOREA: MARKET, BY TUNING MECHANISM, 2018–2021 (USD THOUSAND)
TABLE 193 SOUTH KOREA: MARKET, BY TUNING MECHANISM, 2022–2027 (USD THOUSAND)
13.4.5 REST OF ASIA PACIFIC
TABLE 194 REST OF ASIA PACIFIC: MARKET, BY TYPE, 2018–2021 (USD THOUSAND)
TABLE 195 REST OF ASIA PACIFIC: MARKET, BY TYPE, 2022–2027 (USD THOUSAND)
TABLE 196 REST OF ASIA PACIFIC: MARKET, BY TUNING MECHANISM, 2018–2021 (USD THOUSAND)
TABLE 197 REST OF ASIA PACIFIC: MARKET, BY TUNING MECHANISM, 2022–2027 (USD THOUSAND)
13.5 ROW
TABLE 198 ROW: MARKET, BY REGION, 2018–2021 (USD THOUSAND)
TABLE 199 ROW: MARKET, BY REGION, 2022–2027 (USD THOUSAND)
TABLE 200 ROW: MARKET, BY TYPE, 2018–2021 (USD THOUSAND)
TABLE 201 ROW: MARKET, BY TYPE, 2022–2027 (USD THOUSAND)
FIGURE 71 MECHANICAL TUNING SEGMENT TO LEAD RF TUNABLE FILTER MARKET IN ROW IN 2022
TABLE 202 ROW: MARKET, BY TUNING MECHANISM, 2018–2021 (USD THOUSAND)
TABLE 203 ROW: MARKET, BY TUNING MECHANISM, 2022–2027 (USD THOUSAND)
TABLE 204 ROW: MARKET, BY TUNING COMPONENT, 2018–2021 (USD THOUSAND)
TABLE 205 ROW: MARKET, BY TUNING COMPONENT, 2022–2027 (USD THOUSAND)
TABLE 206 ROW: MARKET, BY SYSTEM, 2018–2021 (USD THOUSAND)
TABLE 207 ROW: MARKET, BY SYSTEM, 2022–2027 (USD THOUSAND)
TABLE 208 ROW: MARKET, BY APPLICATION, 2018–2021 (USD THOUSAND)
TABLE 209 ROW: MARKET, BY APPLICATION, 2022–2027 (USD THOUSAND)
13.5.1 MIDDLE EAST & AFRICA
13.5.1.1 Middle East & Africa to account for larger share of RF tunable filter market in RoW
TABLE 210 MIDDLE EAST & AFRICA: MARKET, BY TYPE, 2018–2021 (USD THOUSAND)
TABLE 211 MIDDLE EAST & AFRICA: MARKET, BY TYPE, 2022–2027 (USD THOUSAND)
TABLE 212 MIDDLE EAST & AFRICA: MARKET, BY TUNING MECHANISM, 2018–2021 (USD THOUSAND)
TABLE 213 MIDDLE EAST & AFRICA: MARKET, BY TUNING MECHANISM, 2022–2027 (USD THOUSAND)
13.5.2 SOUTH AMERICA
13.5.2.1 South America to register higher CAGR during review period
TABLE 214 SOUTH AMERICA: MARKET, BY TYPE, 2018–2021 (USD THOUSAND)
TABLE 215 SOUTH AMERICA: MARKET, BY TYPE, 2022–2027 (USD THOUSAND)
TABLE 216 SOUTH AMERICA: MARKET, BY TUNING MECHANISM, 2018–2021 (USD THOUSAND)
TABLE 217 SOUTH AMERICA: MARKET, BY TUNING MECHANISM, 2022–2027 (USD THOUSAND)
14 COMPETITIVE LANDSCAPE (Page No. - 198)
14.1 OVERVIEW
14.2 MARKET EVALUATION FRAMEWORK
TABLE 218 REVIEW OF STRATEGIES DEPLOYED BY KEY RF TUNABLE FILTER MANUFACTURERS
14.2.1 PRODUCT PORTFOLIO
14.2.2 REGIONAL FOCUS
14.2.3 MANUFACTURING FOOTPRINT
14.2.4 ORGANIC/INORGANIC STRATEGIES
14.3 MARKET SHARE ANALYSIS, 2021
TABLE 219 MARKET SHARE ANALYSIS OF TOP 5 COMPANIES (2021)
14.4 FIVE-YEAR COMPANY REVENUE ANALYSIS
FIGURE 72 FIVE-YEAR REVENUE ANALYSIS OF TOP 5 PLAYERS IN RF TUNABLE FILTER MARKET, 2017–2021
14.5 COMPANY EVALUATION QUADRANT
14.5.1 STAR
14.5.2 EMERGING LEADER
14.5.3 PERVASIVE
14.5.4 PARTICIPANT
FIGURE 73 RF TUNABLE FILTER MARKET: COMPANY EVALUATION QUADRANT, 2021
14.6 STARTUP/SME EVALUATION MATRIX
14.6.1 COMPETITIVE BENCHMARKING
TABLE 220 RF TUNABLE FILTER MARKET: DETAILED LIST OF KEY STARTUPS/SME PLAYERS
TABLE 221 RF TUNABLE FILTER MARKET: COMPETITIVE BENCHMARKING OF KEY PLAYERS (STARTUPS/SME COMPANIES)
14.6.2 PROGRESSIVE COMPANY
14.6.3 RESPONSIVE COMPANY
14.6.4 DYNAMIC COMPANY
14.6.5 STARTING BLOCKS
FIGURE 74 RF TUNABLE FILTER MARKET: START-UP/SME EVALUATION MATRIX, 2021
TABLE 222 COMPANY TYPE FOOTPRINT
TABLE 223 COMPANY APPLICATION FOOTPRINT
TABLE 224 COMPANY REGIONAL FOOTPRINT
TABLE 225 COMPANY FOOTPRINT
14.7 COMPETITIVE SCENARIO
14.7.1 PRODUCT LAUNCHES
TABLE 226 PRODUCT LAUNCHES, JANUARY 2019–DECEMBER 2022
14.7.2 DEALS
TABLE 227 DEALS, JANUARY 2019–DECEMBER 2022
14.7.3 OTHERS
TABLE 228 EXPANSION, JANUARY 2019–DECEMBER 2022
15 COMPANY PROFILES (Page No. - 214)
15.1 KEY PLAYERS
(Business Overview, Products & Solutions, Recent Developments, MnM View)*
15.1.1 ANALOG DEVICES, INC.
TABLE 229 ANALOG DEVICES, INC.: BUSINESS OVERVIEW
FIGURE 75 ANALOG DEVICES, INC.: COMPANY SNAPSHOT
15.1.2 DOVER CORPORATION
TABLE 230 DOVER CORPORATION: BUSINESS OVERVIEW
FIGURE 76 DOVER CORPORATION: COMPANY SNAPSHOT
15.1.3 SMITHS GROUP PLC
TABLE 231 SMITHS GROUP PLC: BUSINESS OVERVIEW
FIGURE 77 SMITHS GROUP PLC: COMPANY SNAPSHOT
15.1.4 THE LGL GROUP, INC.
TABLE 232 THE LGL GROUP, INC.: BUSINESS OVERVIEW
FIGURE 78 THE LGL GROUP, INC.: COMPANY SNAPSHOT
15.1.5 EXFO INC.
TABLE 233 EXFO INC.: BUSINESS OVERVIEW
15.1.6 DICON FIBEROPTICS, INC.
TABLE 234 DICON FIBEROPTICS, INC.: BUSINESS OVERVIEW
15.1.7 NETCOM, INC.
TABLE 235 NETCOM, INC.: BUSINESS OVERVIEW
15.1.8 RF PRODUCTS INC.
TABLE 236 RF PRODUCTS INC.: BUSINESS OVERVIEW
15.1.9 TELONIC BERKELEY CORPORATION
TABLE 237 TELONIC BERKELEY CORPORATION: BUSINESS OVERVIEW
15.1.10 COLEMAN MICROWAVE COMPANY
TABLE 238 COLEMAN MICROWAVE COMPANY: BUSINESS OVERVIEW
*Details on Business Overview, Products & Solutions, Recent Developments, MnM View might not be captured in case of unlisted companies.
15.2 OTHER PLAYERS
15.2.1 MERCURY SYSTEMS, INC. (ATLANTA MICRO, INC.)
15.2.2 QORVO, INC.
15.2.3 MURATA MANUFACTURING CO., LTD. (PSEMI)
15.2.4 FILTRONETICS INC.
15.2.5 WAINWRIGHT INSTRUMENTS GMBH
15.2.6 AKOUSTIS TECHNOLOGIES, INC.
15.2.7 THORLABS, INC.
15.2.8 TEMWELL CORPORATION
15.2.9 MARKI MICROWAVE, INC.
15.2.10 FLANN MICROWAVE LTD.
15.2.11 MICROWAVE FILTER COMPANY INC.
15.2.12 VANLONG TECHNOLOGY CO., LTD.
15.2.13 AAC TECHNOLOGIES HOLDINGS INC. (WISPRY)
15.2.14 NEWEDGE SIGNAL SOLUTIONS INC.
15.2.15 EI WAVE DIGITECH (I) PVT LTD.
16 APPENDIX (Page No. - 253)
16.1 DISCUSSION GUIDE
16.2 KNOWLEDGE STORE: MARKETSANDMARKETS’ SUBSCRIPTION PORTAL
16.3 AVAILABLE CUSTOMIZATION
16.4 RELATED REPORTS
16.5 AUTHOR DETAILS
The study involved four major activities for estimating the size of the RF tunable filter market. Exhaustive secondary research has been conducted to collect information on the market. The next step involved has been validating these findings, assumptions, and sizing with industry experts across the value chain through primary research. Both top-down and bottom-up approaches have been employed to estimate the overall market size. After that, market breakdown and data triangulation techniques have been used to estimate the market size of segments and subsegments.
Secondary Research
In the secondary research process, various secondary sources have been referred to for identifying and collecting information important for this study. Secondary sources such as corporate filings (such as annual reports, investor presentations, and financial statements), trade, business, and professional associations, white papers and RF tunable filter-related journals and certified publications, articles of recognized authors, gold- and silver-standard websites, directories, and databases have been used to identify and collect information for an extensive technical and commercial study of the RF tunable filter market.
Primary Research
In the primary research process, primary sources from both supply and demand sides have been interviewed to obtain qualitative and quantitative information important for this report. Primary sources, such as experts from related industries and suppliers, have been interviewed to obtain and verify critical information, as well as assess prospects. Key players in the RF tunable filter market have been identified through secondary research, and their respective market rankings have been determined through primary and secondary research. This research included studying annual reports of top market players and interviewing key opinion leaders such as CEOs, directors, and marketing personnel.
To know about the assumptions considered for the study, download the pdf brochure
Market Size Estimation
In the complete market engineering process, both top-down and bottom-up approaches have been implemented, along with several data triangulation methods, to estimate and validate the size of the RF tunable filter market and other dependent submarkets listed in this report.
- Key players in the industry and markets have been identified through extensive secondary research.
- The industry’s supply chain and market size, in terms of value, have been determined through primary and secondary research.
- All percentage shares, splits, and breakdowns have been determined using secondary sources and verified through primary sources.
Data Triangulation
After arriving at the overall market size, the total market has been split into several segments. To complete the overall market engineering process and arrive at exact statistics for all segments, market breakdown, and data triangulation procedures have been employed, wherever applicable. The data has been triangulated by studying various factors and trends from both the demand and supply sides. The market has also been validated using both top-down and bottom-up approaches.
Study Objectives:
- To describe and forecast the RF tunable filter market, by type, component, tuning mechanism, end-use, application, and geography
- To describe and forecast the market size for various segments with regard to 4 main regions-North America, Europe, Asia Pacific (APAC), and Rest of the World (RoW)
- To describe other key application areas of RF tunable filters, which are not covered in the application segment
- To provide detailed information regarding drivers, restraints, opportunities, and challenges influencing the growth of the RF tunable filter market
- To strategically analyze micromarkets1 with respect to growth trends, prospects, and contributions to the total market
- To analyze opportunities for stakeholders by identifying high-growth segments within the RF tunable filter market
- To study the complete value chain and allied industry segments and perform a value chain analysis of the RF tunable filter ecosystem
- To analyze competitive developments such as partnerships, mergers and acquisitions, product launches, and research and development (R&D) in the RF tunable filter market
Available Customizations:
With the given market data, MarketsandMarkets offers customizations according to a company’s specific needs. The following customization options are available for the report.
Company Information:
- Detailed analysis and profiling of additional market players (up to 5)

 Generating Response ...


Growth opportunities and latent adjacency in RF Tunable Filter Market