Robotaxi Market by Application (Goods and Passenger), Level of Autonomy (L4 and L5), Vehicle (Cars and Vans/Shuttles), Service (Rental and Station Based), Propulsion (Electric and Fuel Cell), Component and Region - Global Forecast to 2030
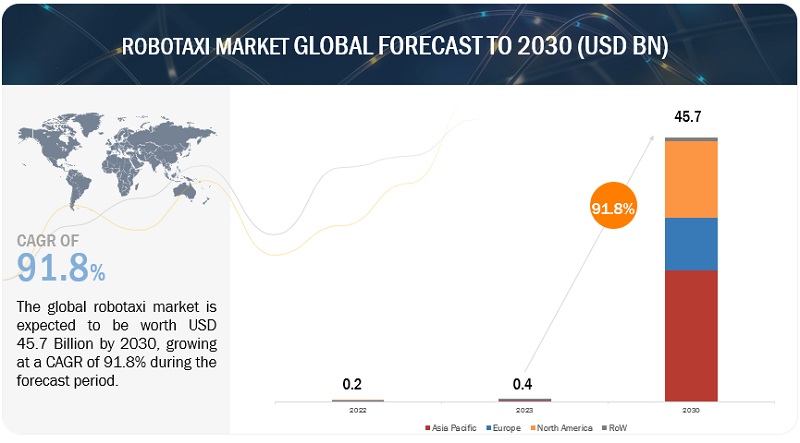
[223 Pages Report] The global robotaxi market, size was valued at USD 0.4 billion in 2023 and is expected to reach USD 45.7 billion by 2030, at a CAGR of 91.8% from 2023 to 2030. The growing need for convenient and secure transportation is the main factor propelling the market for robotaxis. People are increasingly looking for less stressful and more convenient alternatives to driving oneself about. Additionally, The Robotaxis' lower costs when compared to traditional taxi services or owning a private vehicle, as well as the growth of ride-sharing and Mobility-as-a-Service (MaaS) trends, are enticing more people to use them. The growing focus on sustainability, the necessity for efficient urban transit, and better safety as a result of eliminating human error are further factors that are driving the need for robotaxis. Due to legislative support, alliances, and changing attitudes regarding autonomous vehicles, this sector is growing.
To know about the assumptions considered for the study, Request for Free Sample Report
To know about the assumptions considered for the study, download the pdf brochure
Market Dynamics:
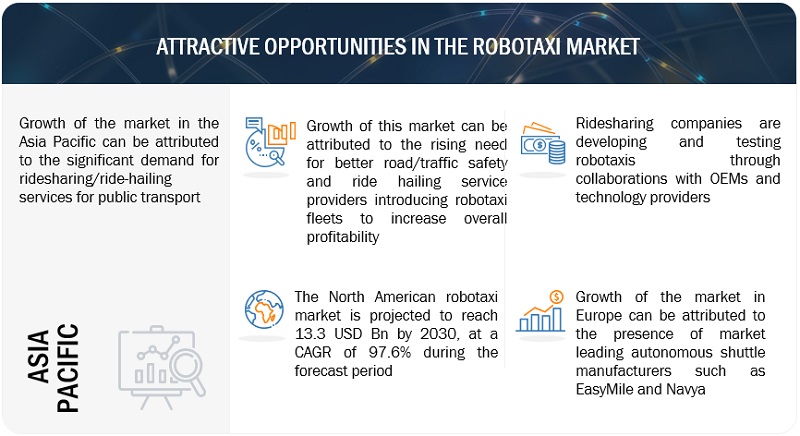
Driver: Robotaxis to reduce operating costs and increase profit margins for ridesharing companies
In various aspects, robotaxis can potentially lower total operating costs and boost profit margins for ridesharing businesses. Driver salaries are sometimes the biggest expense for ridesharing companies. Robotaxis eliminates the need for paying drivers, which can drastically lower operating expenses. There are restrictions on the availability and the number of hours that human drivers can work. Robotaxis can run continuously for 24 hours without stopping due to technological advancements in battery and development in charging infrastructure. For ridesharing companies, higher utilization of robotaxi may lead to higher profit margins. As in the absence of drivers in the taxis is an opportunity for ride-hailing companies, such as Uber Technologies, Inc., Lyft, Inc., and Beijing Xiaoju Technology Co, Ltd., to reduce overall operating costs and increase profitability.
A majority of the startups in this market, such as Cruise LLC, Argo AI, Pony.ai, and Mobileye, are backed by renowned automotive manufacturers, ridesharing companies, and technology companies such as Ford, Volkswagen, Baidu, and Toyota, who have invested billions of dollars in the development of autonomous cars. In October 2022, Volkswagen (Germany) announced an investment of around USD 2.33 billion in Beijing robotics company Horizon (China) as it seeks to accelerate its deployment of autonomous vehicle tech in China. Waymo LLC, Baidu, Inc., and AutoX, Inc. are considered pioneers in this rapidly developing market as they are already offering robotaxi services to the public. Significant competition among these robotaxi makers and ride-hailing service providers is driving the robo taxi market across the globe.
Restraint: High R&D expenditure and complexity in adoption of robotaxis
Deploying a full-fledged robotaxi service requires high investments because components such as ultrasonic sensors, cameras, and LiDAR are expensive. The deployment and adoption of robotaxi fleets is complex and time consuming. As of May 2022, very few level 4 and level 5 autonomous vehicles are available for tests. Therefore, the deployment of robotaxi services in a comprehensive manner is difficult. The widespread application of level 5 autonomous vehicles is capital-intensive and subject to regulatory compliance. A robotaxi is required to process large amounts of sensor data, which is almost 100 times higher than the most advanced vehicles available presently. The complexity of software is increasing exponentially, with Diverse Deep Neural Networks (DNNs) functioning simultaneously as part of a software stack.
Intensive DNN training using significant data is required to operate robotaxis in distinct conditions worldwide. This data is expected to grow exponentially due to the increasing number of robotaxi on the roads. For instance, a robotaxi fleet of 50 vehicles driving approximately six hours a day might produce approximately 1.6 petabytes of data daily. This volume of data is difficult to store and process for vehicles performing various functions under various conditions.
Google (US), Volkswagen (Germany), Volvo Cars (Sweden), Nissan (Japan), Toyota (Japan), and General Motors (US) have sufficient resources to tap into the robotaxi market. However, companies with limited resources are not capable of affording costly R&D processes.
Opportunity: Robotic assistance in goods delivery
Increased technological advancements and related AI applications for autonomous vehicles are expected to help create an increasing number of supporting services. Robotic assistance could also be used for delivery, picking up supplies, and other routine tasks by small businesses. The utilization of these services for autonomous cars and robotaxis is expected to be one of the key attractions for consumers to accept their services. For instance, Nuro, Inc. is one of the companies offering autonomous vehicles which can be used for the delivery of goods. The company has also received approval from NHTSA. Amazon used such autonomous vehicles for its deliveries as it acquired the autonomous vehicle company, Zoox in June 2020. In May 2022, following a partnership announced in late 2021, Motional, Inc. began end-to-end food deliveries for Uber Eats in Southern California using its autonomous IONIQ 5 robotaxi EVs. The pilot program marks the first autonomous deliveries for Motional’s robotaxis and the first autonomous vehicles used on the Uber Eats network.
Challenge: Gaining public and individual trust
Public safety is a major issue for fully autonomous vehicles. Some accidents while testing robotaxis have raised questions regarding their efficacy. In September 2022, General Motors’ autonomous vehicle unit Cruise recalled and updated software in 80 self-driving robotaxis after a June crash in San Francisco that resulted in minor injuries. In November 2022, a Zoox fully autonomous vehicle was involved in a crash with a tractor-trailer on Harmon Avenue east of Las Vegas Boulevard.
In 2021, a Tesla vehicle, while in its autopilot feature, crashed into a stationary police vehicle, resulting in an investigation by the NHTSA. Tesla cars have been involved in such incidents wherein cars have collided with stationary vehicles. The company has announced plans to convert approximately a million cars into robotaxis. Such incidents might discourage people from adopting autonomous driving technology.
Robotaxi Market Ecosystem
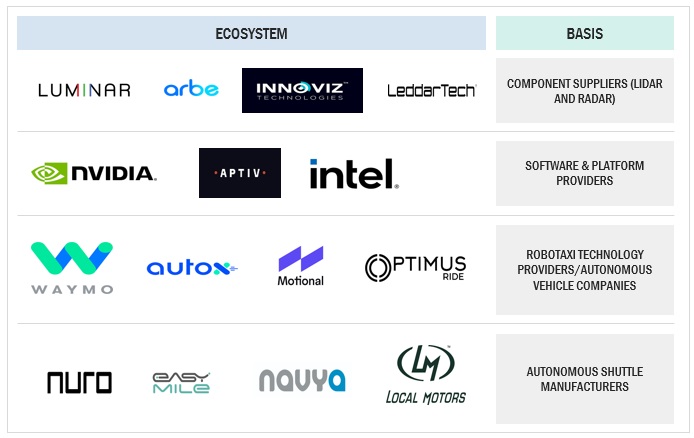
Prominent companies in this market include well-established, financially stable manufacturers of robotaxi. These companies have been operating in the market for several years and possess a diversified product portfolio, state-of-the-art technologies, and strong global sales and marketing networks. Prominent robotaxi companies include Waymo LLC (US), Baidu, Inc. (China), Beijing Didi Chuxing Technology Co., Ltd. (China), Cruise LLC (US), and EasyMile (France).
By vehicle type, Cars segment is estimated to account for the largest and the fastest market during the forecast period
Autonomous vehicle manufacturers and operators are investing heavily for the deployment and testing of self-driving vehicles. At present, developments and testing are seen in vans, shuttles, and cars. But as per the industry experts, due to the rise in ride-sharing services, the autonomous car market will dominate the overall market. Companies are working in partnerships to bring robotaxis into existence. For example, Hyundai (Japan) and Motional, Inc. (US) plan to begin transporting public passengers in the Ioniq 5 robotaxi in 2023, starting in Las Vegas and expanding to major cities in US. On February 1st, 2022, Cruise LLC, a division of General Motors specializing in autonomous vehicles, made level 4 robotaxis available in San Francisco.
Key players are adding new products to their portfolios. In July 2022, Baidu, Inc. unveiled its 6th generation robotaxi vehicle, Apollo RT6. It is the first steering wheel-free, all electric model designed for fully driverless autonomous driving. Such developments will create demand for robotaxi cars during the forecast period.
By Propulsion type, Electric propulsion segment is projected to account for the largest market size during the forecast period
Rising emission concerns has led to the demand for fuel efficient vehicles. Robotaxis would not just offer robotic assistance but usher in an era of fuel efficiency and carbon-free emissions. In July 2022, Baidu, Inc. unveiled their 6th generation robotaxi vehicle Apollo RT6. It is the first steering wheel-free, all electric model designed for fully driverless autonomous driving. In addition, government regulations and improvements in public charging infrastructure in China, France, and Norway are fueling market growth for electric robotaxis. In August 2022, Chinese officials published a set of draft rules that will allow self-driving companies to offer rides and charge fees for fully autonomous vehicles (AVs). Low running and maintenance costs are the key factors driving the market growth for electric robotaxis.
“Europe is anticipated to witness significant growth during the forecast period.”
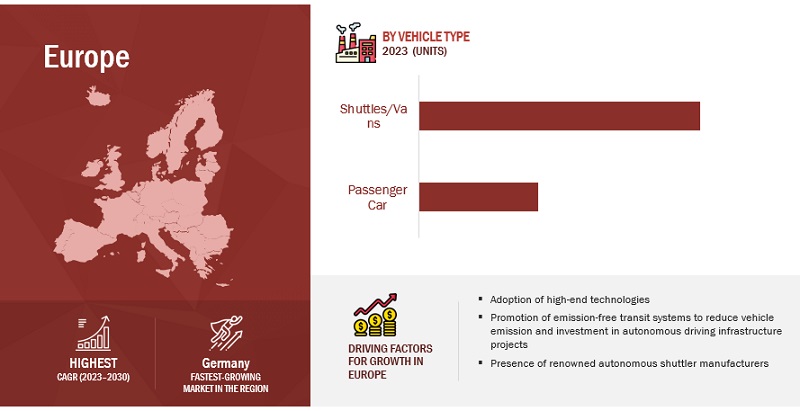
The European region is estimated to be dominated by countries such as Germany, France, Norway, and the Switzerland. Technological advancements and developed & supportive infrastructure have helped the fleet operators to test and deploy easily in this region. The European Commission encourages global technology standardization and provides funds for R&D to increase the competitiveness of the EU automobile industry and maintain its position as a technological leader worldwide. Additionally, In July 2022, the EU passed the General Safety Regulation, the first legal framework to allow automated and fully driverless cars to become available on European roads. Member states anticipate its deployment will boost innovation and improve the competitiveness of the car industry. Furthermore, Growing technological trends for autonomous vehicles will greatly impact the market. This will boost the overall demand for self-driving taxis in the region. Several companies that offer self-driving shuttles around the world, like EasyMile, Navya, and 2getthere, are based in Europe.
Key Market Players
The robotaxi market is dominated by global players such as Waymo LLC (US), Baidu, Inc. (China), Beijing Didi Chuxing Technology Co., Ltd. (China), Cruise LLC (US), and EasyMile (France). These companies adopted new product launches, deals, and other strategies to gain traction in the robotaxi market size.
Scope of the Report
|
Report Metric |
Details |
|
Market size available for years |
2018–2030 |
|
Base year considered |
2022 |
|
Forecast period |
2023-2030 |
|
Forecast units |
Volume (Units) and Value (USD Million/Billion) |
|
Segments covered |
Application, Level of Autonomy, Vehicle Type, Propulsion, Component, Service Type, and Region. |
|
Geographies covered |
North America, Asia Pacific, Europe, and Rest of the World. |
|
Companies Covered |
Waymo LLC (US), Baidu, Inc. (China), Beijing Didi Chuxing Technology Co., Ltd. (China), Cruise LLC (US), and EasyMile (France) |
This research report categorizes the robotaxi market based on Application, Level of Autonomy, Vehicle, Propulsion, Component, Service Type, and Region.
Based on Application Type:
- Goods Transportation
- Passenger Transportation
Based on Level of Autonomy:
- Level 4
- Level 5
Based on Vehicle Type:
- Cars
- Shuttles/Vans
Based on Propulsion:
- Electric
- Fuel Cell
- Car Rental
- Station Based
Based on Component Type:
- Camera
- Radar
- LiDAR
- Ultrasonic Sensors
Based on the region:
-
Asia Pacific
- China
- India
- Japan
- South Korea
- Singapore
-
North America
- US
- Canada
- Mexico
-
Europe
- France
- Germany
- Norway
- Spain
- UK
- The Netherlands
- Sweden
- Switzerland
-
Rest of the World
- UAE
- Russia
Recent Developments
- In May 2023, Beijing Didi Chuxing Technology Co., Ltd. Partnered with GAC AION for mass production of fully self-driving electric robotaxi. The first mass-produced model is expected to be on its shared mobility network and integrated into a large-scale mixed dispatching system by 2025.
- In May 2023, Waymo LLC and Uber Technologies Inc. partnered to bring Waymo’s autonomous driving technology to the Uber platform.
- In January 2023, EasyMile and multinational public transport operator Keolis (France) has taken a further step in completely automated mobility by remotely supervising two fully driverless shuttles, without any human supervisor on board, at the National Sports Shooting Centre. The objective of this new phase is to verify the financial and operational models of autonomous shuttles.
- In January 2023, The German Federal Ministry of Economics and Climate Protection (BMWK) has awarded a consortium of German experts in the field of autonomous driving USD 9.6 million for the SAFESTREAM project. The project aims to accelerate autonomous driving to SAE Level 4 in public transport in Germany.
- In December 2022, Motional, Inc. began conducting autonomous rides for Uber passengers in Las Vegas as part of a 10-year commercial agreement between the companies. Starting in 2023, its ride-hail services with Lyft and Uber in Las Vegas will become fully driverless (with no vehicle operator behind the wheel) and will begin scaling to other major US cities.
- In October 2022, EasyMile provides a commercial fleet of autonomous shuttles for a fully driverless service worth USD 3.9 million at the Belgian tourist site Terhills. The shuttles run 7 days a week, for up to 10 years.
- In September 2022, Waymo LLC and Swiss Re, one of the top reinsurance companies in the world, have established a research partnership to develop new risk assessment methodology to analyze Autonomous Vehicle (AV) risk correctly.
- In July 2022, Navya partnered with Negma Group aims to strengthen its financial resources and support its medium-term development cycle as well as its technological and commercial projects, particularly in the Middle East.
Frequently Asked Questions (FAQ):
What is the current size of the global robotaxi market?
The global robotaxi market is estimated to be USD 0.4 Billion in 2023 and is projected to reach USD 45.7 Billion by 2030, at a CAGR of 91.8%.
Who are the winners in the global robotaxi market?
The global The robotaxi market is dominated by global players such as Waymo LLC (US), Baidu, Inc. (China), Beijing Didi Chuxing Technology Co., Ltd. (China), Cruise LLC (US), and EasyMile (France). These companies develop new products, adopt expansion strategies, and undertake collaborations, partnerships, and mergers & acquisitions to gain traction in the high-growth robotaxi market.
What are the driving factor impacting the growth of the robotaxi market?
Autonomous Vehicle Technology Advancements, Ride-Sharing and Mobility-as-a-Service (MaaS), Urbanization and Congestion and government support and investment are the driving factor impacting the growth of the robotaxi market.
What are the new market trends impacting the growth of the robotaxi market?
IoT and 5G network, 4D Lidar, Connected vehicles, AI and machine learning technology, cybersecurity and data privacy, etc. are some of the major trends affecting this market.
To speak to our analyst for a discussion on the above findings, click Speak to Analyst


- 5.1 INTRODUCTION
-
5.2 MARKET DYNAMICSDRIVERS- Robotaxis to reduce operating costs and increase profit margins for ridesharing companies- Need for enhanced road safety and traffic control- Ridesharing and Mobility-as-a-Service (MaaS)- Rise in urbanization and congestionRESTRAINTS- Disruption of traditional jobs- High R&D expenditure and complexity in adoption of robotaxis- Cybersecurity threatsOPPORTUNITIES- Government support- Robotic assistance in goods delivery- Increasing demand for autonomous vehicles- Increasing investments in LiDAR startupsCHALLENGES- Navigation in crowded spaces- Gaining public and individual trust- Lack of required infrastructure in emerging countries
- 5.3 FIVE ERAS OF VEHICLE SAFETY
- 5.4 SAE DEFINITION OF AUTONOMOUS VEHICLES
- 5.5 PRICING ANALYSIS
-
5.6 ROBOTAXI MARKET ECOSYSTEMCOMPONENT SUPPLIERSSOFTWARE AND PLATFORM PROVIDERSAUTONOMOUS VEHICLE TECHNOLOGY PROVIDERSAUTONOMOUS SHUTTLE MANUFACTURERS
-
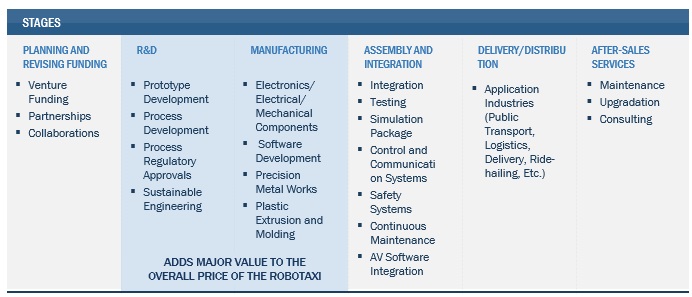
5.7 SUPPLY CHAIN ANALYSISPLANNING AND REVISING FUNDSR&DMANUFACTURINGASSEMBLY AND INTEGRATIONDELIVERY/DISTRIBUTIONAFTER-SALES SERVICES
- 5.8 AUTONOMOUS VEHICLE DEVELOPMENTS
-
5.9 CASE STUDYCASE STUDY 1: RIDEFLUX EXPANDED OPERATIONS AND INCREASED ODD COVERAGE BY 5XCASE STUDY 2: SIMULATION TO DRIVE TOYOTA’S AUTOMATED DRIVING SYSTEM
-
5.10 PATENT ANALYSIS
-
5.11 TECHNOLOGY ANALYSISIOT AND 5G IN ROBOTAXI MARKET- 4D LiDARSENSORS AND THEIR IMPORTANCE IN AUTONOMOUS VEHICLESCONNECTED VEHICLES FOR AUTONOMOUS DRIVINGARTIFICIAL INTELLIGENCE AND MACHINE LEARNING IN ROBOTAXI MARKETCYBERSECURITY AND DATA PRIVACYCELLULAR VEHICLE-TO-EVERYTHING (C-V2X)- LTE-V2X- 5G-V2X- Development of robotrucks
-
5.12 TARIFF REGULATORY OVERVIEWKEY REGULATORY BODIES, GOVERNMENT AGENCIES, AND OTHER ORGANIZATIONS- Enacted legislation and executive orders in US- Autonomous vehicle testing in China- Autonomous vehicle testing in Germany- Autonomous vehicle testing in Singapore
- 5.13 KEY CONFERENCES AND EVENTS IN 2023–2024
-
5.14 ROBOTAXI MARKET, SCENARIOS (2023–2030)MOST LIKELY SCENARIOOPTIMISTIC SCENARIOPESSIMISTIC SCENARIO
- 6.1 INTRODUCTION
-
6.2 CARSRISE IN DEVELOPMENT OF RIDESHARING MARKET TO INCREASE DEMAND
-
6.3 VANS/SHUTTLESINCREASING FOCUS ON PUBLIC TRANSPORT TO BOOST MARKET
- 7.1 INTRODUCTION
-
7.2 GOODS TRANSPORTATIONINCREASING E-COMMERCE SERVICES AND UTILIZATION OF TRANSPORT TO DRIVE SEGMENT
-
7.3 PASSENGER TRANSPORTATIONRISING URBANIZATION TO FUEL SEGMENT
- 8.1 INTRODUCTION
-
8.2 LEVEL 4LOWER RISK AND RAPID DEVELOPMENTS IN LEVEL 4 TO DRIVE MARKET
-
8.3 LEVEL 5TECHNICAL ADVANCEMENTS TO PROPEL SEGMENT GROWTH
- 9.1 INTRODUCTION
-
9.2 ELECTRICRISING DEMAND FOR ELECTRIC CARS TO BOOST MARKET
-
9.3 FUEL CELLFOCUS ON CURBING EMISSIONS EXPECTED TO RAISE MARKET SHARE
- 10.1 INTRODUCTION
-
10.2 CAR RENTALINCREASE IN TRAFFIC CONGESTION TO DRIVE MARKET
-
10.3 STATION-BASEDFOCUS ON PUBLIC SAFETY EXPECTED TO BOOST MARKET
- 11.1 INTRODUCTION
- 11.2 CAMERAS
- 11.3 LIDAR
- 11.4 RADARS
- 11.5 ULTRASONIC SENSORS
- 12.1 INTRODUCTION
-
12.2 ASIA PACIFICASIA PACIFIC: RECESSION IMPACTCHINA- Technological advancements in autonomous driving to boost marketINDIA- Government policies and infrastructure development expected to lead market growthJAPAN- Development of advanced EV technologies for reducing carbon footprint to drive marketSOUTH KOREA- Rise in government initiatives toward adoption of EVs to propel marketSINGAPORE- Government push toward adoption of smarter transportation to drive market
-
12.3 EUROPEEUROPE: RECESSION IMPACTFRANCE- Growing adoption of electric vehicles to drive demand for robotaxisGERMANY- Innovations by German automakers to propel market growthNORWAY- Government initiatives for zero-emissions in public transport to boost marketSPAIN- Rising tourism industry to encourage market growthSWEDEN- Rise in R&D activities for autonomous vehicles to support market growthNETHERLANDS- Urban mobility challenges to strengthen demand for robotaxisUK- EV infrastructure to fuel market growthAUSTRIA- Infrastructure development and government initiative to boost market growth
-
12.4 NORTH AMERICANORTH AMERICA: RECESSION IMPACTCANADA- Rising cost of owning and operating cars to create demand for robotaxisMEXICO- Rising investment in autonomous vehicles to drive marketUS- Availability of infrastructure, regulations, and large-scale testing to boost market
-
12.5 REST OF THE WORLD (ROW)RUSSIA- Advancements in autonomous driving technology to boost marketUAE- Improving infrastructure for EV technology to push market growth

- 13.1 OVERVIEW
-
13.2 MARKET RANKING ANALYSISWAYMO LLCBAIDU, INC.BEIJING DIDI CHUXING TECHNOLOGY CO., LTD.CRUISE LLCEASYMILE
- 13.3 KEY PLAYER STRATEGIES
- 13.4 REVENUE ANALYSIS OF LISTED PLAYERS
-
13.5 COMPETITIVE SCENARIOSPRODUCT LAUNCHESDEALSEXPANSIONS
-
13.6 COMPANY EVALUATION MATRIXSTARSEMERGING LEADERSPERVASIVE PLAYERSPARTICIPANTSCOMPANY FOOTPRINT
-
13.7 STARTUP/SME EVALUATION MATRIXPROGRESSIVE COMPANIESRESPONSIVE COMPANIESDYNAMIC COMPANIESSTARTING BLOCKSCOMPETITIVE BENCHMARKING
-
14.1 KEY PLAYERSWAYMO LLC- Business overview- Recent developments- MnM viewBAIDU, INC.- Business overview- Recent developments- MnM viewBEIJING DIDI CHUXING TECHNOLOGY CO., LTD.- Business overview- Recent developments- MnM viewCRUISE LLC- Business overview- Recent developments- MnM viewEASYMILE- Business overview- Recent developments- MnM viewAUTOX, INC.- Business overview- Recent developmentsZOOX, INC.- Business overviewNAVYA- Business overview- Recent developmentsMOTIONAL, INC.- Business overview- Recent developments2GETTHERE- Business overview- Recent developmentsPONY.AI- Business overview- Recent developmentsTESLA- Business overview- Recent developments
-
14.2 OTHER KEY PLAYERSNISSANMOBILEYENVIDIA CORPORATIONWOVEN PLANET (LYFT)APTIV PLCZF FRIEDRICHSHAFENMAY MOBILITYOPTIMUS RIDEYANDEXAURORA INNOVATIONQUALCOMM TECHNOLOGIES, INC.LUMINAR TECHNOLOGIES, INC.LEDDARTECH INC.ARBE ROBOTICSNURO, INC.WERIDEROBOSENSEINNOVIZ TECHNOLOGIES LTD.OCULIIARGO AIUBER TECHNOLOGIES INC.LYFT, INC.
- 15.1 ASIA PACIFIC TO BE KEY MARKET DURING FORECAST PERIOD
- 15.2 GOODS TRANSPORT: KEY FOCUS AREA
- 15.3 RISING DEMAND FOR ROBOTAXI BY RIDESHARING AND RIDE-HAILING SERVICE PROVIDERS
- 15.4 CONCLUSION
- 16.1 KEY INSIGHTS FROM INDUSTRY EXPERTS
- 16.2 DISCUSSION GUIDE
- 16.3 KNOWLEDGESTORE: MARKETSANDMARKETS’ SUBSCRIPTION PORTAL
- 16.4 CUSTOMIZATION OPTIONS
- 16.5 RELATED REPORTS
- 16.6 AUTHOR DETAILS
- TABLE 1 ROBOTAXI MARKET DEFINITION, BY VEHICLE TYPE
- TABLE 2 MARKET DEFINITION, BY SERVICE TYPE
- TABLE 3 MARKET DEFINITION, BY LEVEL OF AUTONOMY
- TABLE 4 MARKET DEFINITION, BY APPLICATION TYPE
- TABLE 5 INCLUSIONS AND EXCLUSIONS FOR MARKET
- TABLE 6 CURRENCY EXCHANGE RATES
- TABLE 7 MARKET: IMPACT OF MARKET DYNAMICS
- TABLE 8 NUMBER OF DRIVERS EMPLOYED BY LEADING RIDE-HAILING SERVICE PROVIDERS
- TABLE 9 AVERAGE SELLING PRICE TREND OF KEY PLAYERS, BY VEHICLE TYPE, 2022
- TABLE 10 ROLE OF COMPANIES IN ROBOTAXI ECOSYSTEM
- TABLE 11 IMPORTANT PATENT REGISTRATIONS RELATED TO MARKET
- TABLE 12 CUMULATIVE GAIN WHILE USING 5G NR (NEW RADIO) C-V2X
- TABLE 13 MARKET: DETAILED LIST OF CONFERENCES AND EVENTS
- TABLE 14 MOST LIKELY SCENARIO: MARKET, BY REGION, 2023–2030 (USD MILLION)
- TABLE 15 OPTIMISTIC SCENARIO: MARKET, BY REGION, 2023–2030 (USD MILLION)
- TABLE 16 PESSIMISTIC SCENARIO: MARKET, BY REGION, 2023–2030 (USD MILLION)
- TABLE 17 MARKET, BY VEHICLE TYPE, 2018–2022 (UNITS)
- TABLE 18 MARKET, BY VEHICLE TYPE, 2023–2030 (UNITS)
- TABLE 19 MARKET, BY VEHICLE TYPE, 2018–2022 (USD MILLION)
- TABLE 20 MARKET, BY VEHICLE TYPE, 2023–2030 (USD MILLION)
- TABLE 21 POPULAR AUTONOMOUS SHUTTLES FROM COMPANIES WORLDWIDE
- TABLE 22 CARS: MARKET, BY REGION, 2018–2022 (UNITS)
- TABLE 23 CARS: MARKET, BY REGION, 2023–2030 (UNITS)
- TABLE 24 CARS: MARKET, BY REGION, 2018–2022 (USD MILLION)
- TABLE 25 CARS: MARKET, BY REGION, 2023–2030 (USD MILLION)
- TABLE 26 VANS/SHUTTLES: MARKET, BY REGION, 2018–2022 (UNITS)
- TABLE 27 VANS/SHUTTLES: MARKET, BY REGION, 2023–2030 (UNITS)
- TABLE 28 VANS/SHUTTLES: MARKET, BY REGION, 2018–2022 (USD MILLION)
- TABLE 29 VANS/SHUTTLES: MARKET, BY REGION, 2023–2030 (USD MILLION)
- TABLE 30 ROBOTAXI MARKET, BY APPLICATION TYPE, 2018–2022 (UNITS)
- TABLE 31 MARKET, BY APPLICATION TYPE, 2023–2030 (UNITS)
- TABLE 32 POPULAR ROBOTAXIS USED FOR PASSENGER TRANSPORTATION WORLDWIDE
- TABLE 33 GOODS TRANSPORTATION: MARKET, BY REGION, 2018–2022 (UNITS)
- TABLE 34 GOODS TRANSPORTATION: MARKET, BY REGION, 2023–2030 (UNITS)
- TABLE 35 PASSENGER TRANSPORTATION: MARKET, BY REGION, 2018–2022 (UNITS)
- TABLE 36 PASSENGER TRANSPORTATION: MARKET, BY REGION, 2023–2030 (UNITS)
- TABLE 37 MARKET, BY LEVEL OF AUTONOMY, 2018–2022 (UNITS)
- TABLE 38 MARKET, BY LEVEL OF AUTONOMY, 2023–2030 (UNITS)
- TABLE 39 LEVEL 4: MARKET, BY REGION, 2018–2022 (UNITS)
- TABLE 40 LEVEL 4: MARKET, BY REGION, 2023–2030 (UNITS)
- TABLE 41 LEVEL 5: MARKET, BY REGION, 2023–2030 (UNITS)
- TABLE 42 ROBOTAXI MARKET, BY PROPULSION TYPE, 2018–2022 (UNITS)
- TABLE 43 MARKET, BY PROPULSION TYPE, 2023–2030 (UNITS)
- TABLE 44 FEW POPULAR ELECTRIC AUTONOMOUS SHUTTLES OFFERED BY COMPANIES WORLDWIDE
- TABLE 45 SUMMARY OF FCEV ATTRIBUTES COMPARED TO ADVANCED ELECTRIC VEHICLES FOR 200 MILES AND 300 MILES
- TABLE 46 ELECTRIC: MARKET, BY REGION, 2018–2022 (UNITS)
- TABLE 47 ELECTRIC: MARKET, BY REGION, 2023–2030 (UNITS)
- TABLE 48 ZERO-EMISSION LIGHT-DUTY VEHICLES REFERENCE COMPARISON: BEV CHARGING VS. FCEV HYDROGEN FUELING
- TABLE 49 FUEL CELL: MARKET, BY REGION, 2023–2030 (UNITS)
- TABLE 50 MARKET, BY SERVICE TYPE, 2018–2022 (UNITS)
- TABLE 51 MARKET, BY SERVICE TYPE, 2023–2030 (UNITS)
- TABLE 52 CAR RENTAL AND STATION-BASED AUTONOMOUS VEHICLE/ROBOTAXI PROVIDERS
- TABLE 53 CAR RENTAL: MARKET, BY REGION, 2018–2022 (UNITS)
- TABLE 54 CAR RENTAL: MARKET, BY REGION, 2023–2030 (UNITS)
- TABLE 55 STATION-BASED: MARKET, BY REGION, 2018–2022 (UNITS)
- TABLE 56 STATION-BASED: MARKET, BY REGION, 2023–2030 (UNITS)
- TABLE 57 MARKET, BY REGION, 2018–2022 (UNITS)
- TABLE 58 MARKET, BY REGION, 2023–2030 (UNITS)
- TABLE 59 MARKET, BY REGION, 2018–2022 (USD MILLION)
- TABLE 60 MARKET, BY REGION, 2023–2030 (USD MILLION)
- TABLE 61 ASIA PACIFIC: MARKET, BY COUNTRY, 2018–2022 (UNITS)
- TABLE 62 ASIA PACIFIC: MARKET, BY COUNTRY, 2023–2030 (UNITS)
- TABLE 63 CHINA: MARKET, BY VEHICLE TYPE, 2018–2022 (UNITS)
- TABLE 64 CHINA: MARKET, BY VEHICLE TYPE, 2023–2030 (UNITS)
- TABLE 65 INDIA: MARKET, BY VEHICLE TYPE, 2023–2030 (UNITS)
- TABLE 66 JAPAN: MARKET, BY VEHICLE TYPE, 2018–2022 (UNITS)
- TABLE 67 JAPAN: MARKET, BY VEHICLE TYPE, 2023–2030 (UNITS)
- TABLE 68 SOUTH KOREA: MARKET, BY VEHICLE TYPE, 2018–2022 (UNITS)
- TABLE 69 SOUTH KOREA: MARKET, BY VEHICLE TYPE, 2023–2030 (UNITS)
- TABLE 70 SINGAPORE: ROBOTAXI MARKET, BY VEHICLE TYPE, 2018–2022 (UNITS)
- TABLE 71 SINGAPORE: MARKET, BY VEHICLE TYPE, 2023–2030 (UNITS)
- TABLE 72 EUROPE: MARKET, BY COUNTRY, 2018–2022 (UNITS)
- TABLE 73 EUROPE: MARKET, BY COUNTRY, 2023–2030 (UNITS)
- TABLE 74 FRANCE: MARKET, BY VEHICLE TYPE, 2018–2022 (UNITS)
- TABLE 75 FRANCE: MARKET, BY VEHICLE TYPE, 2023–2030 (UNITS)
- TABLE 76 GERMANY: MARKET, BY VEHICLE TYPE, 2018–2022 (UNITS)
- TABLE 77 GERMANY: MARKET, BY VEHICLE TYPE, 2023–2030 (UNITS)
- TABLE 78 NORWAY: MARKET, BY VEHICLE TYPE, 2018–2022 (UNITS)
- TABLE 79 NORWAY: MARKET, BY VEHICLE TYPE, 2023–2030 (UNITS)
- TABLE 80 SPAIN: MARKET, BY VEHICLE TYPE, 2023–2030 (UNITS)
- TABLE 81 SWEDEN: MARKET, BY VEHICLE TYPE, 2023–2030 (UNITS)
- TABLE 82 NETHERLANDS: MARKET, BY VEHICLE TYPE, 2018–2022 (UNITS)
- TABLE 83 NETHERLANDS: MARKET, BY VEHICLE TYPE, 2023–2030 (UNITS)
- TABLE 84 UK: MARKET, BY VEHICLE TYPE, 2018–2022 (UNITS)
- TABLE 85 UK: MARKET, BY VEHICLE TYPE, 2023–2030 (UNITS)
- TABLE 86 AUSTRIA: MARKET, BY VEHICLE TYPE, 2023–2030 (UNITS)
- TABLE 87 NORTH AMERICA: MARKET, BY COUNTRY, 2018–2022 (UNITS)
- TABLE 88 NORTH AMERICA: MARKET, BY COUNTRY, 2023–2030 (UNITS)
- TABLE 89 CANADA: MARKET, BY VEHICLE TYPE, 2023–2030 (UNITS)
- TABLE 90 MEXICO: MARKET, BY VEHICLE TYPE, 2023–2030 (UNITS)
- TABLE 91 US: MARKET, BY VEHICLE TYPE, 2018–2022 (UNITS)
- TABLE 92 US: MARKET, BY VEHICLE TYPE, 2023–2030 (UNITS)
- TABLE 93 REST OF THE WORLD: ROBOTAXI MARKET, BY COUNTRY, 2023–2030 (UNITS)
- TABLE 94 RUSSIA: MARKET, BY VEHICLE TYPE, 2023–2030 (UNITS)
- TABLE 95 UAE: MARKET, BY VEHICLE TYPE, 2023–2030 (UNITS)
- TABLE 96 OVERVIEW OF STRATEGIES ADOPTED BY KEY PLAYERS IN MARKET
- TABLE 97 MARKET: PRODUCT LAUNCHES, JANUARY 2021– MARCH 2023
- TABLE 98 MARKET: DEALS, MARCH 2021– MAY 2023
- TABLE 99 MARKET: OTHER DEVELOPMENTS, MARCH 2021–JANUARY 2023
- TABLE 100 MARKET: EXPANSIONS, FEBRUARY 2021–DECEMBER 2022
- TABLE 101 MARKET: COMPANY FOOTPRINT, BY APPLICATION, 2022
- TABLE 102 MARKET: COMPANY FOOTPRINT, BY REGION, 2022
- TABLE 103 MARKET: COMPANY FOOTPRINT, 2022
- TABLE 104 MARKET: COMPETITIVE BENCHMARKING, BY REGION
- TABLE 105 WAYMO LLC: COMPANY OVERVIEW
- TABLE 106 WAYMO LLC: PRODUCTS OFFERED
- TABLE 107 WAYMO LLC: PRODUCT DEVELOPMENTS
- TABLE 108 WAYMO LLC: DEALS
- TABLE 109 WAYMO LLC: OTHERS
- TABLE 110 BAIDU, INC.: COMPANY OVERVIEW
- TABLE 111 BAIDU, INC.: PRODUCTS OFFERED
- TABLE 112 BAIDU, INC.: PRODUCT DEVELOPMENTS
- TABLE 113 BAIDU, INC.: DEALS
- TABLE 114 BAIDU, INC.: OTHERS
- TABLE 115 BEIJING DIDI CHUXING TECHNOLOGY CO., LTD.: COMPANY OVERVIEW
- TABLE 116 BEIJING DIDI CHUXING TECHNOLOGY CO., LTD.: PRODUCTS OFFERED
- TABLE 117 BEIJING DIDI CHUXING TECHNOLOGY CO., LTD.: PRODUCT DEVELOPMENTS
- TABLE 118 BEIJING DIDI CHUXING TECHNOLOGY CO., LTD.: DEALS
- TABLE 119 CRUISE LLC: COMPANY OVERVIEW
- TABLE 120 CRUISE LLC: PRODUCTS OFFERED
- TABLE 121 CRUISE LLC: PRODUCT DEVELOPMENTS
- TABLE 122 CRUISE LLC: DEALS
- TABLE 123 EASYMILE: COMPANY OVERVIEW
- TABLE 124 EASYMILE: PRODUCTS OFFERED
- TABLE 125 EASYMILE: PRODUCT DEVELOPMENTS
- TABLE 126 EASYMILE: DEALS
- TABLE 127 EASYMILE: OTHERS
- TABLE 128 AUTOX, INC.: COMPANY OVERVIEW
- TABLE 129 AUTOX, INC.: PRODUCTS OFFERED
- TABLE 130 AUTOX, INC.: NEW PRODUCT DEVELOPMENTS
- TABLE 131 AUTOX, INC.: DEALS
- TABLE 132 AUTOX, INC.: OTHERS
- TABLE 133 ZOOX, INC.: COMPANY OVERVIEW
- TABLE 134 ZOOX, INC.: PRODUCTS OFFERED
- TABLE 135 ZOOX, INC.: DEALS
- TABLE 136 NAVYA: COMPANY OVERVIEW
- TABLE 137 NAVYA: PRODUCTS OFFERED
- TABLE 138 NAVYA: DEALS
- TABLE 139 NAVYA: OTHERS
- TABLE 140 MOTIONAL, INC.: COMPANY OVERVIEW
- TABLE 141 MOTIONAL, INC.: PRODUCTS OFFERED
- TABLE 142 MOTIONAL, INC.: DEALS
- TABLE 143 2GETTHERE: COMPANY OVERVIEW
- TABLE 144 2GETTHERE: PRODUCTS OFFERED
- TABLE 145 2GETTHERE: DEALS
- TABLE 146 PONY.AI: COMPANY OVERVIEW
- TABLE 147 PONY.AI: PRODUCTS OFFERED
- TABLE 148 PONY.AI: PRODUCT DEVELOPMENTS
- TABLE 149 PONY.AI: DEALS
- TABLE 150 TESLA: COMPANY OVERVIEW
- TABLE 151 TESLA: PRODUCTS OFFERED
- TABLE 152 TESLA: PRODUCT DEVELOPMENTS
- TABLE 153 TESLA: DEALS
- TABLE 154 TESLA: OTHERS
- TABLE 155 NISSAN: COMPANY OVERVIEW
- TABLE 156 MOBILEYE: COMPANY OVERVIEW
- TABLE 157 NVIDIA CORPORATION: COMPANY OVERVIEW
- TABLE 158 WOVEN PLANET: COMPANY OVERVIEW
- TABLE 159 APTIV PLC: COMPANY OVERVIEW
- TABLE 160 ZF FRIEDRICHSHAFEN: COMPANY OVERVIEW
- TABLE 161 MAY MOBILITY: COMPANY OVERVIEW
- TABLE 162 OPTIMUS RIDE: COMPANY OVERVIEW
- TABLE 163 YANDEX: COMPANY OVERVIEW
- TABLE 164 AURORA INNOVATION: COMPANY OVERVIEW
- TABLE 165 QUALCOMM TECHNOLOGIES, INC.: COMPANY OVERVIEW
- TABLE 166 LUMINAR TECHNOLOGIES, INC.: COMPANY OVERVIEW
- TABLE 167 LEDDARTECH INC.: COMPANY OVERVIEW
- TABLE 168 ARBE ROBOTICS: COMPANY OVERVIEW
- TABLE 169 NURO, INC.: COMPANY OVERVIEW
- TABLE 170 WERIDE: COMPANY OVERVIEW
- TABLE 171 ROBOSENSE: COMPANY OVERVIEW
- TABLE 172 INNOVIZ TECHNOLOGIES LTD.: COMPANY OVERVIEW
- TABLE 173 OCULII: COMPANY OVERVIEW
- TABLE 174 ARGO AI: COMPANY OVERVIEW
- TABLE 175 UBER TECHNOLOGIES INC.: COMPANY OVERVIEW
- TABLE 176 LYFT, INC.: COMPANY OVERVIEW
- FIGURE 1 MARKET SEGMENTATION
- FIGURE 2 RESEARCH DESIGN
- FIGURE 3 RESEARCH METHODOLOGY MODEL
- FIGURE 4 BREAKDOWN OF PRIMARY INTERVIEWS: BY COMPANY TYPE, DESIGNATION, AND REGION
- FIGURE 5 RESEARCH METHODOLOGY: HYPOTHESIS BUILDING
- FIGURE 6 GLOBAL MARKET: BOTTOM-UP APPROACH
- FIGURE 7 MARKET SIZE ESTIMATION METHODOLOGY FOR MARKET: TOP-DOWN APPROACH
- FIGURE 8 MARKET: MARKET ESTIMATION NOTES
- FIGURE 9 MARKET: RESEARCH DESIGN AND METHODOLOGY – DEMAND SIDE
- FIGURE 10 RESEARCH APPROACH: MARKET
- FIGURE 11 DATA TRIANGULATION
- FIGURE 12 MARKET: MARKET OVERVIEW
- FIGURE 13 MARKET, BY REGION, 2023–2030
- FIGURE 14 CARS SEGMENT ESTIMATED TO LEAD MARKET IN 2023
- FIGURE 15 GROWTH OF RIDE-HAILING SERVICES AND INCREASING FOCUS ON ROAD SAFETY TO BOOST MARKET
- FIGURE 16 ASIA PACIFIC TO ACCOUNT FOR LARGEST MARKET SHARE IN 2023
- FIGURE 17 CARS SEGMENT TO LEAD MARKET DURING FORECAST PERIOD
- FIGURE 18 LEVEL 4 SEGMENT TO DOMINATE MARKET DURING FORECAST PERIOD
- FIGURE 19 ELECTRIC SEGMENT TO HAVE HIGHER MARKET SHARE (2023–2030)
- FIGURE 20 AR RENTAL SEGMENT TO REGISTER HIGHEST MARKET SHARE (2023–2030)
- FIGURE 21 PASSENGER TRANSPORT SEGMENT TO ACCOUNT FOR LARGEST MARKET SHARE
- FIGURE 22 ROBOTAXI MARKET: MARKET DYNAMICS
- FIGURE 23 PRELIMINARY NUMBER OF ROAD FATALITIES PER MILLION INHABITANTS, BY COUNTRY, 2022
- FIGURE 24 MAAS MARKET BY CAR SHARING, 2021–2027
- FIGURE 25 URBAN POPULATION WORLDWIDE, 2022
- FIGURE 26 DATA FROM AUTONOMOUS VEHICLE
- FIGURE 27 VISION SYSTEM OF FULLY AUTONOMOUS VEHICLE
- FIGURE 28 FIVE ERAS OF VEHICLE SAFETY
- FIGURE 29 SOCIETY OF AUTOMOTIVE ENGINEERS AUTOMATION LEVELS
- FIGURE 30 AVERAGE SELLING PRICE TREND, BY VEHICLE TYPE
- FIGURE 31 MARKET: ECOSYSTEM ANALYSIS
- FIGURE 32 MAJOR VALUE ADDED TO DELIVERY SYSTEM DURING R&D AND MANUFACTURING PHASES
- FIGURE 33 INVESTMENTS AND PARTNERSHIPS IN AUTONOMOUS CARS AND RIDESHARING COMPANIES
- FIGURE 34 IOT DEVICES IN AUTONOMOUS VEHICLES
- FIGURE 35 SENSORS AND THEIR IMPORTANCE IN AUTONOMOUS VEHICLES
- FIGURE 36 VISION SYSTEM OF FULLY AUTONOMOUS VEHICLE
- FIGURE 37 CONNECTED VEHICLES FOR AUTONOMOUS DRIVING
- FIGURE 38 AI APPLICATIONS IN AUTOMOTIVE INDUSTRY
- FIGURE 39 ENACTED LEGISLATION AND EXECUTIVE ORDERS IN US
- FIGURE 40 AUTONOMOUS VEHICLE REGULATION ACROSS US
- FIGURE 41 AUTONOMOUS VEHICLE TESTING IN CHINA
- FIGURE 42 AUTONOMOUS VEHICLE TESTING IN GERMANY
- FIGURE 43 AUTONOMOUS VEHICLE TESTING AREA IN SINGAPORE
- FIGURE 44 KEY FEATURES OF ROBOTAXIS
- FIGURE 45 CARS TO HOLD LARGER MARKET SHARE IN VEHICLE TYPE SEGMENT DURING FORECAST PERIOD
- FIGURE 46 KEY PRIMARY INSIGHTS
- FIGURE 47 PASSENGER TRANSPORTATION SEGMENT TO HOLD LARGEST MARKET SHARE DURING FORECAST PERIOD
- FIGURE 48 KEY PRIMARY INSIGHTS
- FIGURE 49 LEVEL 4 SEGMENT TO GROW AT HIGHER RATE DURING FORECAST PERIOD
- FIGURE 50 KEY PRIMARY INSIGHTS
- FIGURE 51 ELECTRIC SEGMENT TO HOLD PROMINENT MARKET SHARE DUE TO RAPID ADVANCEMENTS IN ELECTRIC VEHICLES
- FIGURE 52 COMPARISON OF NATURAL GAS REQUIRED TO PROPEL ELECTRIC VEHICLE TO 300 MILES AGAINST FCEV TRAVELING 300 MILES
- FIGURE 53 INITIAL INVESTMENT FOR VARIOUS FUEL INFRASTRUCTURE, 2022
- FIGURE 54 COMPARISON OF BEV AND FCEV
- FIGURE 55 KEY PRIMARY INSIGHTS
- FIGURE 56 CAR RENTAL SEGMENT TO HOLD PROMINENT MARKET SHARE DURING FORECAST PERIOD
- FIGURE 57 KEY PRIMARY INSIGHTS
- FIGURE 58 AUTONOMOUS VEHICLES TO TRAVEL ABOUT 66% OF TOTAL PASSENGER KILOMETERS IN 2040
- FIGURE 59 ASIA PACIFIC TO HOLD LARGE MARKET SHARE DUE TO RAPID TECHNOLOGICAL DEVELOPMENTS IN AUTOMOTIVE INDUSTRY
- FIGURE 60 ASIA PACIFIC: MARKET SNAPSHOT
- FIGURE 61 MASS ADOPTION OF HIGHLY AUTONOMOUS VEHICLES IN CHINA TO COMMENCE BY 2027
- FIGURE 62 AUTONOMOUS VEHICLE COMMERCIALIZATION TIMELINE IN SOUTH KOREA
- FIGURE 63 EUROPE: MARKET SNAPSHOT
- FIGURE 64 US TO HOLD PROMINENT MARKET SHARE IN NORTH AMERICA
- FIGURE 65 US STATES WITH AUTONOMOUS VEHICLES ENACTED LEGISLATION AND EXECUTIVE ORDERS
- FIGURE 66 RUSSIA TO ACCOUNT FOR LARGEST MARKET SHARE IN REST OF THE WORLD
- FIGURE 67 MARKET RANKING ANALYSIS
- FIGURE 68 LISTED PLAYERS DOMINATING MARKET DURING LAST 3 YEARS
- FIGURE 69 MARKET: COMPANY EVALUATION MATRIX, 2022
- FIGURE 70 MARKET: STARTUP/SME EVALUATION MATRIX, 2022
- FIGURE 71 WAYMO DRIVER’S COLLISION AVOIDANCE PERFORMANCE IN SIMULATED TESTS
- FIGURE 72 BAIDU, INC.: COMPANY SNAPSHOT
- FIGURE 73 BEIJING DIDI CHUXING TECHNOLOGY CO., LTD.: SERVICE OFFERING
- FIGURE 74 BEIJING DIDI CHUXING TECHNOLOGY CO., LTD.: COMPANY SNAPSHOT
- FIGURE 75 EASYMILE: COMPANY SNAPSHOT
- FIGURE 76 EZ10 SPECIFICATIONS
- FIGURE 77 AUTOX, INC. FOOTPRINT
- FIGURE 78 NAVYA: COMPANY SNAPSHOT
- FIGURE 79 TESLA: COMPANY SNAPSHOT
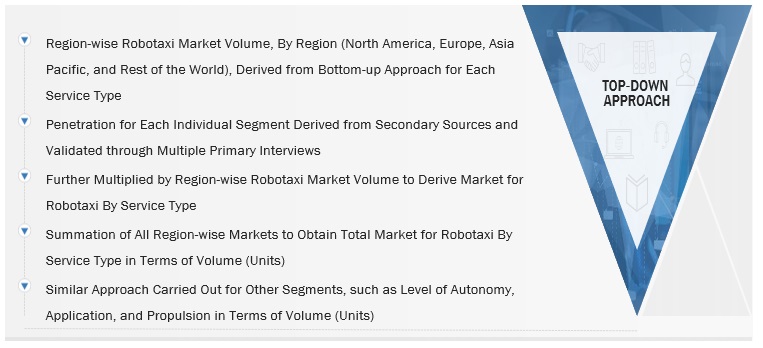
The study involved 4 major activities in estimating the current size of the robotaxi market. Exhaustive secondary research was done to collect information on the market, the peer market, and the parent market. The next step was to validate these findings, assumptions, and sizing with the industry experts across value chains through primary research. The top-down approach was employed to estimate the complete market size. Thereafter, market breakdown and data triangulation were used in estimating the market size of segments and subsegments.
Secondary Research
In the secondary research process, various secondary sources such as company annual reports/presentations, press releases, industry association publications [for example, publications of automobile OEMs, American Automobile Association (AAA), country-level automotive associations and European Alternative Fuels Observatory (EAFO)], automobile magazines, articles, directories, technical handbooks, World Economic Outlook, trade websites, technical articles, and databases (for example, Marklines, and Factiva) have been used to identify and collect information useful for an extensive commercial study of the global robotaxi market.
Primary Research
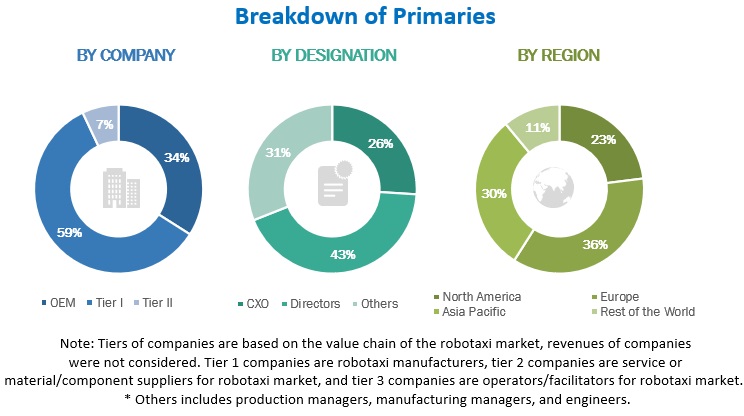
Extensive primary research has been conducted after acquiring an understanding of the Robotaxi market scenario through secondary research. Several primary interviews have been conducted with market experts from both the demand-side [robotaxi operators (in terms of services, country-level government associations, and trade associations)] and supply-side (OEMs and component manufacturers) across 4 major regions, namely, North America, Europe, Asia Pacific, and the Rest of the World. Approximately 14% and 86% of primary interviews have been conducted from the demand- and supply-side, respectively. Primary data has been collected through questionnaires, emails, and telephonic interviews. In the canvassing of primaries, we have strived to cover various departments within organizations, such as sales, operations, and administration, to provide a holistic viewpoint in our report.
After interacting with industry experts, we have also conducted brief sessions with highly experienced independent consultants to reinforce the findings from our primaries. This, along with the in-house subject-matter experts’ opinions, has led us to the findings as described in the remainder of this report. Following is the breakdown of primary respondents—
To know about the assumptions considered for the study, download the pdf brochure
Market Size Estimation
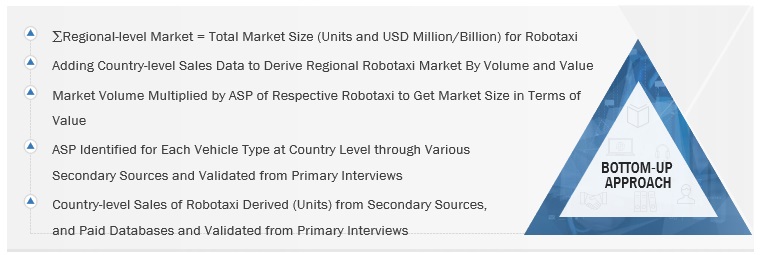
The bottom-up approach was used to estimate and validate the total size of the robotaxi market. These methods were also used extensively to estimate the size of various subsegments in the market. The research methodology used to estimate the market size includes the following:
- The key players in the industry and markets have been identified through extensive secondary research.
- The industry’s supply chain and market size, in terms of volume, have been determined through primary and secondary research processes.
- All percentage shares, splits, and breakdowns have been determined using secondary sources and verified through primary sources.
To know about the assumptions considered for the study, Request for Free Sample Report
Bottom- up Approach
Top- down Approach
Data Triangulation
After arriving at the overall market size—using the market size estimation processes as explained above—the market was split into several segments and subsegments. To complete the overall market engineering process and arrive at the exact statistics of each market segment and subsegment, data triangulation, and market breakdown procedures were employed, wherever applicable. The data was triangulated by studying various factors and trends from both the demand and supply sides.
Market Definition
A robotaxi combines the benefits of autonomous vehicles and e-cab-hailing services by operating without drivers and focusing on Mobility as a Service (MaaS). It is expected to reduce the cost of ownership and improve fleet management. A robotaxi is expected to offer a safe, convenient, and economical mode of transportation. OEMs have partnered with autonomous driving system providers and fleet managers to launch robotaxi services. As major developments are being undertaken in electric vehicles, the robotaxi market is expected to introduce electrically-propelled vehicles initially.
Key Stakeholders
- Automobile Original Equipment Manufacturers (OEMs)
- Automotive Electronic System Traders, Distributors, and Suppliers
- Automotive Insurance Providers
- ADAS Integrators
- https://www.marketsandmarkets.com/Market-Reports/driver-assistance-systems-market-1201.htmlADAS/Occupant Safety Solution Suppliers
- Automotive Camera Manufacturers
- Automotive Radar and Ultrasonic Sensor Manufacturers
- Automotive SoC and ECU Manufacturers
- Automotive Software and Platform Providers
- Autonomous Driving Platform Providers
- Cybersecurity Providers for Robotaxi Vehicles
- Country-specific Automotive Associations
- E-hailing Operators
- European Automobile Manufacturer Association (ACEA)
- EV and EV Component Manufacturers
- Government & Research Organizations
- Legal and Regulatory Authorities
- LiDAR Manufacturers
- National Highway Traffic Safety Administration (NHTSA)
- Raw Material Suppliers for Robotaxi Vehicles
- Regional Automobile Associations
- Robotaxi Vehicle Component Manufacturers
- Robotaxi Vehicle Manufacturers
- Sensor Manufacturers
- Software Providers for Robotaxi Vehicles
- State, Country, and Regional-level Government Institutions
- The Automobile Industry as an End-use Industry
- Transport Operators
- Transportation Research Authorities
- Transportation Technology Solution Providers
- Vehicle Safety Regulatory Bodies
Report Objectives
- To segment and forecast the size of the global robotaxi market, in terms of volume (units) and value (USD million) (only global level)
- To define, describe, and forecast the market on the basis of component type, application type, propulsion type, service type, level of autonomy, vehicle type, and region.
-
To analyze the regional markets for growth trends, prospects, and their contribution to the overall market.
- To segment and forecast the market based on application into passenger transportation and goods transportation.
- To segment and forecast the market based on service type into car rental and station-based.
- To segment and forecast the market based on propulsion type into electric and fuel cell.
- To provide qualitative insights on the market based on component type into cameras, LiDAR, radars, and ultrasonic sensors.
- To segment and forecast the market based on level of autonomy into level 4 and level 5
- To segment and forecast the market based on vehicle type into cars and vans/shuttles.
- To forecast the market with respect to the key regions, namely, North America, Europe, Asia Pacific, and Rest of the World.
- To provide detailed information regarding the major factors influencing market growth (drivers, restraints, opportunities, and challenges)
- To strategically analyze markets with respect to individual growth trends, future prospects, and contribution to the total market.
- To analyze the opportunities for stakeholders and details of the competitive landscape for market leaders.
- To strategically profile key players and comprehensively analyze their market share and core competencies.
- To track and analyze competitive developments such as deals (joint ventures, mergers & acquisitions, partnerships, collaborations), new product developments, and other activities carried out by key industry participants.
Available Customizations
With the given market data, MarketsandMarkets offers customizations in accordance to the company’s specific needs.
- Robotaxi Market, by vehicle at country level (for countries not covered in the report)
- Robotaxi Market, by application at country level (for countries not covered in the report)
Company Information
- Profiling of Additional Market Players (Up to 5)


 Generating Response ...


Growth opportunities and latent adjacency in Robotaxi Market
What are Robotaxi Market newer business models like sustainable and profitable revenue streams in the future?