The study involved four major activities in estimating the current size of the Satellite Data Services Market. Exhaustive secondary research was done to collect information on the Satellite Data Services market, its adjacent markets, and its parent market. The next step was to validate these findings, assumptions, and sizing with industry experts across the value chain through primary research. Demand-side analyses were carried out to estimate the overall size of the market. After that, market breakdown and data triangulation procedures were used to estimate the sizes of different segments and subsegments of the Satellite Data Services market.
Secondary Research
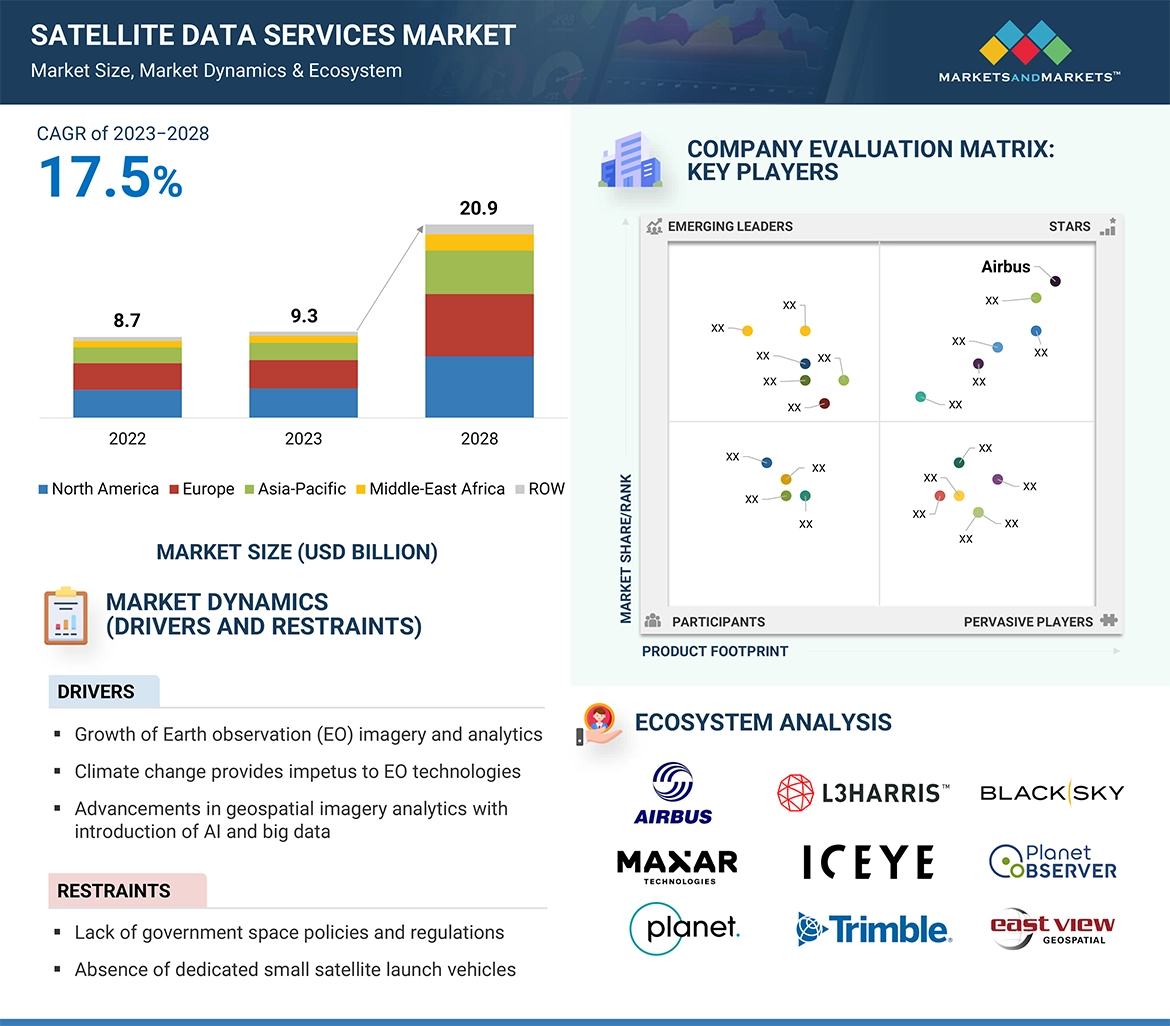
The market ranking of satellite data services companies was determined using secondary data made available through paid and unpaid sources and by analyzing the product portfolios of major companies. These companies perform on the basis of the performance and quality of their products. These data points were further validated by primary sources.
Secondary sources referred to for this research study included financial statements of companies offering satellite data services and information from various trade, business, and professional associations. The secondary data was collected and analyzed to arrive at the overall size of the satellite data services market, which was validated by primary respondents.
Primary Research
Extensive primary research was conducted after acquiring information regarding the satellite data services market scenario through secondary research. Several primary interviews were conducted with market experts from both the demand and supply sides across major countries of North America, Europe, Asia Pacific, the Middle East and ROW which includes Africa, and Latin America. Primary data was collected through questionnaires, emails, and telephonic interviews.

To know about the assumptions considered for the study, download the pdf brochure
Market Size Estimation
The market sizing of the market was undertaken from the demand side. The market was upsized at a regional level based on procurements and launches planned by the country. Such procurements provide information on each application demand aspects of satellite data services. For each application, all possible end users in the satellite data services market were identified.
Note: An analysis of technological, military funding, year-on-year launches, and operational costs was carried out to arrive at the CAGR and understand the market dynamics of all countries in the report. The market share for all vertical, end-use, service, deployment and region was based on the recent and upcoming launches of satellite data services in every country from 2023 to 2028.
Satellite Data ServicesMarket Size: Bottom-up Approach

Satellite Data Services Market Size: Top-Down Approach

Data Triangulation
After arriving at the overall size of the market, the total market was split into several segments and subsegments. The data triangulation and market breakdown procedures explained below were implemented wherever applicable, to complete the overall market engineering process and arrive at the exact statistics for various market segments and subsegments. The data was triangulated by studying various factors and trends from both, the demand and supply sides. Along with this, the market size was validated using both, the top-down and bottom-up approaches.
Country-wise deliveries of vehicles in different platforms from 2023 to 2028 were considered for base data. Data was taken from the OEM manufacturers and various governing bodies of each country.
The following figure indicates the market breakdown structure and the data triangulation procedure implemented in the market engineering process used to develop this report.
Market Definition
Satellite data services refer to the acquisition, processing, and delivery of critical information such as imagery, measurements, and signals collected by satellites orbiting Earth. These services cater to various industries and applications, offering valuable insights for agriculture, environmental monitoring, defense, infrastructure management, disaster response, navigation, and telecommunications. Key features of satellite data services include global coverage, real-time or near-real-time data acquisition, and the ability to monitor large areas consistently.
Market Stakeholders
-
Remote Sensing Service Providers
-
Ministries of Defense
-
Scientific Research Centers
-
Satellite Imagery Service Providers
-
Satellite Data Analytics Solution Providers
-
Satellite Operators
Report Objectives
-
To define, describe, and forecast the size of the satellite data services market based on vertical, end-use, service, deployment, and region from 2023 to 2028.
-
To forecast the size of various segments of the market with respect to major regions, namely, North America, Europe, Asia Pacific, Middle East and the Rest of the World (RoW), which comprises Latin America and Africa
-
To identify and analyze key drivers, restraints, opportunities, and challenges influencing the growth of the satellite data services market across the globe.
-
To strategically analyze micromarkets1 with respect to individual growth trends, prospects, and their contribution to the satellite data services market.
-
To analyze opportunities for stakeholders in the market by identifying key market trends
-
To analyze competitive developments such as contracts, acquisitions and expansions, agreements, joint ventures and partnerships, new product launches, and Research & Development (R&D) activities in the satellite data services market.
-
To provide a detailed competitive landscape of the -market, in addition to an analysis of business and corporate strategies adopted by leading market players.
-
To strategically profile key market players and comprehensively analyze their core competencies2.
Available Customizations
MarketsandMarkets offers the following customizations for this market report:
-
Additional country-level analysis of the Satellite Data Services Market
-
Profiling of other market players (up to 5)
Product Analysis
-
Product matrix, which provides a detailed comparison of the product portfolio of each company in the Satellite Data Services Market.


Alvin
Mar, 2019
I want to know about satellite services (navigation, positioning, and timing services) in Africa, Central Asia, and LATAM. .