Service Robotics Market Size, Share and Trends

Report Code SE 2714
Published in Dec, 2024, By MarketsandMarkets™
Download PDF

Choose License Type

Buy Report Now Inquire Before Buying

Service Robotics Market by Environment (Ground (AGVs, Cleaning, Surgical, Humanoid), Marine, Aerial), Component (Airframe, Sensor, Camera, Actuator, Power Supply, Control System, Navigation System, Propulsion System and Software) - Global Forecast to 2029


Service Robotics Market Size, Share & Trends

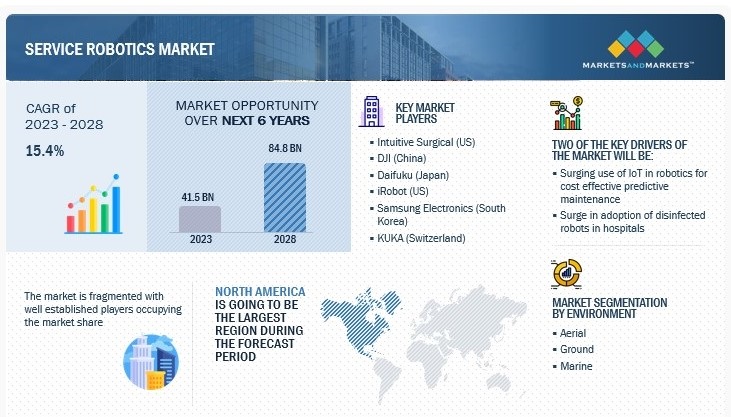
The service robotics market is projected to grow from USD 47.10 billion in 2024 to reach USD 98.65 billion by 2029; it is expected to grow at a CAGR of 15.9% from 2024 to 2029.

Increasing applications of service robots across several industries is one of the key drivers of the service robotics market. These robots are used in the healthcare industry to help with surgery, administer medication, and entertain senior citizens. Order picking, packing, and delivery are among the tasks in logistics and warehousing that are automated. Robots are used in the hospitality sector to manage room service and food delivery, improving the guest experience. Service robots are also used in construction for repetitive and heavy-lifting jobs and in agriculture for duties like harvesting and crop monitoring. The market for service robotics is developing as a result of the increasing use of these robots in a variety of industries.

Service robots are being increasingly utilized for personal and professional purposes. Personal service robots are designed to perform tasks in the home, provide education and entertainment, and assist individuals with special needs, such as the elderly. Professional service robots, however, are more complex and expensive and are commonly used in hazardous environments, factories, hospitals, and public buildings.

Drones, automated guided vehicles (AGVs), agricultural robots, inspection robots, humanoid robots, exoskeletons, construction robots, and more are types of service robots used in professional applications. AGVs are often utilized for material handling and transport in warehouses. In 2022, Amazon introduced a robotic arm, an autonomous floor system, and two fully autonomous warehouse robots called Proteus and Cardinal.

Service Robotics Market

Attractive Opportunities in the Service Robotics Market

ASIA PACIFIC

The increasing growth opportunities for the service robotics market in Asia Pacific is due to the rising adoption of robots for personal and professional applications in China and Japan.

Growing adoption of robots for several applications to achieve high returns on investment (RoI) is expected to drive the market.

The integration of the Internet of Things (IoT) into robots for effective predictive maintenance is expected to boost the growth of the service robotics market.

Ground-based robots to gain traction during the forecast period due to their advantages such as high accessibility, low cost, and high productivity.

The adoption of service robotics in the aerospace & defense, automotive, and manufacturing industries is projected to drive the market.

Global Functional Safety Market Dynamics

DRIVER: Mounting adoption of robots to achieve high returns on investment

Robots are increasingly being adopted in various applications such as enhanced productivity, streamlined processes, and improved workplace safety. The main reason for using service robots is the high return on investment (Rol), and a reduction in operational costs. Recently, companies such as Starship Technologies, Amazon Robotics, and Ford Smart Mobility have deployed service robots for delivery applications in e-commerce.

A 2017 study by the co-founders of Robby (US) indicated that, for conventional product delivery methods, labor costs account for about 75% of the entire cost of delivery, with vehicle and fuel costs accounting for the remaining 25%. By using autonomous delivery robots, labor costs related to product delivery could be reduced to 20% to 25% of the total delivery cost.

Vehicle expenses including fuel and tires, as well as equipment maintenance, account for the majority of last-mile delivery operating costs. The desire for increased efficiency is driving the growing demand for automation in sectors like e-commerce, healthcare, automotive, and food and beverage.

Service robots are advancing in the food and beverage industry. In March 2024, the autonomous robot Jeeves was introduced at Munich Airport, offering a variety of chilled drinks and snacks through a touchscreen interface. Customers can pay using cashless methods like Apple Pay, Google Pay, and major credit cards.

RESTRAINTS: Concerns regarding data privacy and regulations

There are ethical issues related to data ownership, particularly with the rise of software services for robotics. The data collected by ground robots can differ significantly from that gathered by drones. With the increasing use of domestic robots for household chores, education, and entertainment, individuals' private information is often stored in the cloud. This data is frequently available for purchase by third parties. Other ethical considerations regarding robots include liability frameworks and the potential reuse of data collected by robots for research or studies, which governments worldwide need to address. The lack of standardization in the technologies used for robotics, including Al and machine vision, complicates system integration as most manufacturers develop their proprietary interface protocols for communication. The repercussions of a data breach can be severe, especially in sensitive sectors such as healthcare, military, and defense, requiring regulations that do not hinder the advancement of robotics technologies.

China is formulating new guidelines regarding the operations of unmanned vehicles on public streets. If heavily loaded (load capacity of JDX is up to 300 kg) vehicles crash, they can injure pedestrians and cause damage to public property. Hence, China's transport program plans to reduce the load-carrying capacity of delivery robots as it might be a safe option. Such stringent regulations are restraining the service robotics market.

Government regulations are stifling the healthcare sector. The regulatory procedures are slow and are not updated with the latest technology, inhibiting the growth of robotics in the healthcare sector. The FDA must approve robotic devices for use on humans, a process that requires long and costly testing periods.


OPPORTUNITY: Growing focus on improving the endurance and capability of robots

Robots are advanced but despite certain advancements current robots do not yet match the human capabilities. There is always an opportunity to enhance NLP and user interfaces to improve the interactive communication abilities of humanoid robots. Additionally, drones are limited to areas with Wi-Fi access. Some companies provide Wi-Fi or communication network-related products and services. Partnering with such companies could extend the operational range of drones. Solar technology is integrated into robots, drones, and autonomous surface vehicles to enhance their endurance. Cloud technology, big data analytics, and machine learning are increasingly incorporated into robotic technologies to improve functionality and increase automation. There is also considerable potential for advancements in the robot vacuum market. For instance, robot vacuums such as the iRobot Roomba function only on flat surfaces. They cannot clean stairs and often struggle with thick carpets. Additionally, battery replacements for devices such as the Roomba can be expensive.

In telepresence robotics, the quality of audio/video could be improved, and the robot could be made compatible with doors, stairs, and lifts. Other drawbacks of telepresence robotics include high prices, less battery life, vulnerability to topple, and performance dependency on Wi-Fi connectivity. Therefore, there is an opportunity to improve various aspects such as battery life, Wi-Fi connectivity, and cross-platform connectivity in service robots to increase their range of operation.

CHALLENGE: Technical issues of robots

Robots do several vital tasks, like providing medical care, disposing of bombs, and supporting and safeguarding the elderly. However, robots cannot be trained to manage every scenario. For instance, during medical procedures, every human body poses different difficulties that robots would find difficult to precisely handle. Additionally, technical issues like software viruses or interrupted Internet access may occur during important procedures. It is essential that programming be enhanced to support various scenarios and ensure backup systems for power and Internet access.

Defective electronics and batteries can also result in accidents. It may be exceedingly difficult for drones to increase precision to prevent accidents while moving objects that change direction often. For example, larger birds, such as eagles, can attack or capture drones in midair, capturing important images or videos. Drones must be able to accurately identify these obstacles from a distance in order to prevent accidents. Weather and strong winds can also significantly affect drone accuracy. Lithium polymer batteries used in drones are also susceptible to moisture damage. For example, water droplets may collect on the drone due to fog, which could lead to failures. The accuracy of a robot can be reduced by a malfunction in any one of the several components that influence its operation.

Global Service Robotics Market Ecosystem Analysis

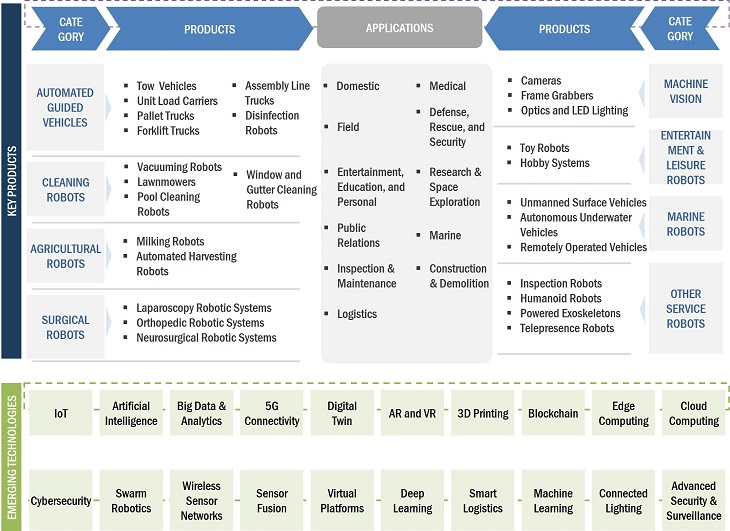
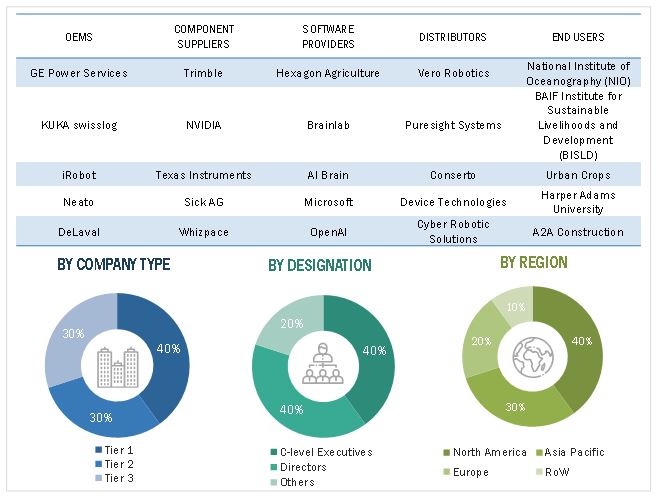
The service robotics market ecosystem consists of a diverse range of participants, including manufacturers, component suppliers, system integrators, and end-users. Manufacturers create and produce service robots for various applications, while component suppliers provide essential hardware and software. System integrators customize and deploy robotic solutions to meet specific customer needs. End-users across industries such as healthcare, logistics, and hospitality adopt service robots to improve efficiency, reduce costs, and enhance customer experiences. Collaboration among these stakeholders is vital for fostering innovation and accelerating the growth of the service robots market.

Top Companies in Service Robotics Market
 

The service robotics market for professional ground robots in Asia Pacific is expected to grow at the highest CAGR during the forecast period

The service robotic market for professional ground robots in Asia Pacific is expected to grow at the highest CAGR during the forecast period. In 2023, Japan held the largest share of the market for professional ground robots in Asia Pacific. Japan's e-commerce industry has witnessed significant growth in recent years. The sudden surge in online shopping has reflected the country's acute shortage of warehousing facilities.

Due to the lack of proper warehousing facilities, the gap between demand and supply has created the need to set up new fulfillment centers in Japan. Ambitious Japanese firms are investing heavily in R&D activities and launching the latest and advanced AGVs for material handling. After the US, Japan is the second-largest market for medical devices and robotic- assisted surgeries.

Earlier, in Japan, da Vinci was approved only for prostatectomy and nephrectomy procedures. However, it has been approved for colorectal, gynecological, thoracic, gastrectomy, bladder cystectomies, esophagostomies, and mitral valvuloplasty.

Japan is a technologically advanced country with a high farm mechanization ratio. Organizations such as the Hokuriku National Agricultural Experimental Station, Hokkaido University, Kyoto University, Tokyo University of Agriculture & Technology, and Ministry of Agriculture, Forestry, and Fishery are engaged in agricultural research. These organizations are crucial in developing technologies related to agricultural robots.

AUVs accounts for the second-largest market share in the marine environment segment during forecast period

Autonomous underwater vehicles (AUVs) accounts for the second-largest market share in the marine environment segment of the service robotics market as it exhibits huge potential in underwater operations. These programmable autonomous robots are used for underwater survey missions to detect and map submerged wrecks, rocks, and obstructions. Because AUVs are outfitted with extremely sophisticated payloads, they may function in locations that are challenging to reach and deliver precise data. Due to higher spending on the acquisition and development of AUVs for military use, the US is regarded as a promising market for AUVs. In February 2024, the US Department of Defense awarded Oceaneering International Inc. (US) a contract for the development and testing of its Freedom AUV. The US Navy's Program Office for Advanced Undersea Systems will evaluate the Freedom AUV as a possible large displacement unmanned undersea vehicle (LDUUV) prototype. The market is expanding because to the growing need for AUVs from security and defense organizations.

Asia Pacific Segment to Record Highest CAGR During Forecast Period

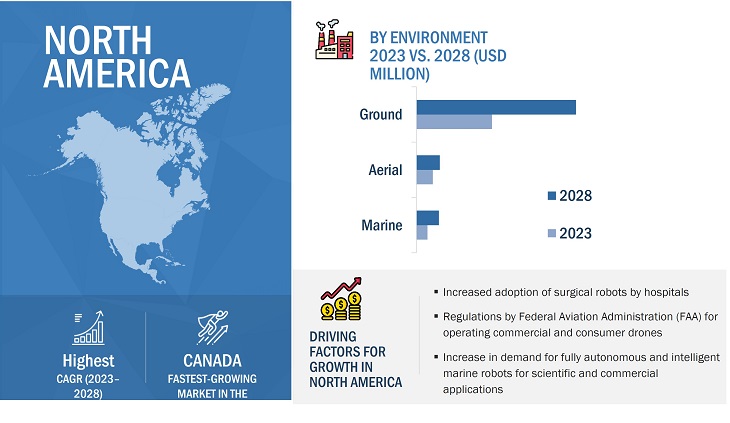
The service robotics market in Asia Pacific is expected to grow at the highest CAGR during the forecast period. The Asia Pacific market is segmented into China, South Korea, Japan, India, and the rest. Japan and South Korea are technologically advanced nations with high robot densities. Asia Pacific also includes developing countries such as India and Thailand, which have good potential for service robots. China and Japan offer significant opportunities for assistive and elderly care robots due to the aging population. There is a high adoption rate of field robots and drones for agricultural applications in Australia and New Zealand. The rise in disposable income due to the rapid industrialization in developing countries such as India and the Philippines is expected to increase the demand for service robots. The oil & gas industry in Asia Pacific has witnessed significant growth in the past 2-3 years, which is leading to high demand for autonomous underwater vehicles (AUVs) and remotely operated vehicles (ROVs). There is an increasing trend of automation and globalization in India, Australia, and China, further boosting the service robots market growth in Asia Pacific.

LARGEST MARKET SHARE IN 2024-2029
CHINA FASTER-GROWING MARKET IN REGION
Service Robotics Market Size and Share

Recent Developments of Service Robotics Market

  • In May 2024, DJI (China) launched the AGRAS T50 and T25 drones internationally, further expanding their popular AGRAS line. The T50 is tailored for large-scale farming efficiency, while the T25 offers portability for smaller operations. Both models integrate seamlessly with the newly improved SmartFarm app, enhancing the management of aerial crop applications.
  • In January 2024, DeLaval (Sweden) launched a new VMS Batch Milking system, representing a significant advancement in robotic milking technology. This method is designed to reduce labor and increase efficiency. It involves dividing herds into groups and bringing them to the milking center, similar to a traditional parlor or rotary system.
  • In October 2023, Pudu Technology Inc. (Pudu Robotics) (China), one of the global leaders in commercial service robotics, announced a strategic partnership with SoftBank Robotics Group (Japan). This collaboration aims to elevate the commercial service robotics industry, combining SoftBank Robotic’s expertise in the Japanese market with Pudu’s product and technology advantages in delivery and cleaning robots.
  • In August 2022, Amazon.com, Inc. (US) and iRobot Corporation (US) announced a definitive merger agreement under which Amazon will acquire iRobot Corporation under its expansion plan with a USD 1.7 billion offer. The acquisition will bolster Amazon’s line of smart home products and add to the retail giant’s vast consumer data store.
  • In February 2021, Daifuku Co., Ltd. (Japan) and AFT Industries (Germany) announced their business partnership to open channels, attract investments from automotive manufacturers toward material handling systems, and satiate their growing global demands.

Key Market Players

Want to explore hidden markets that can drive new revenue in Service Robotics Market?

Scope of the Report

Report Attribute Details
Market size available for years 2020–2029
Base year considered 2023
Forecast period 2024–2029
Forecast units USD Million/Billion
Segments Covered Component, Environment, Type, Application, and Region
Regions covered North America, Asia Pacific, Europe, and RoW

Key Questions Addressed by the Report

What key strategies are key companies adopting in the service robotics market?
Product launches, acquisitions, and collaborations have been and continue to be some of the significant strategies adopted by the key players to grow in the service robotics market.
What region will have the most significant service robotics market share?
The North America region will have the most significant service robotics market share.
What application segment dominates the service robotics market?
Medical application segment dominates the service robotics market, respectively
Which component segment dominates the service robotics market?
The Hardware component segment dominates the service robotics market.
Who are the major companies in the service robotics market?
Intuitive Surgical Operations, Inc. (US), DJI (China), Daifuku Co., Ltd. (Japan), JD.com, Inc. (China), and iRobot Corporation (US).


Personalize This Research

  • Triangulate with your Own Data
  • Get Data as per your Format and Definition
  • Gain a Deeper Dive on a Specific Application, Geography, Customer or Competitor
  • Any level of Personalization
Request A Free Customisation

Let Us Help You

  • What are the Known and Unknown Adjacencies Impacting the Service Robotics Market
  • What will your New Revenue Sources be?
  • Who will be your Top Customer; what will make them switch?
  • Defend your Market Share or Win Competitors
  • Get a Scorecard for Target Partners
Customized Workshop Request

Table of Contents

Exclusive indicates content/data unique to MarketsandMarkets and not available with any competitors.

TITLE
PAGE NO
INTRODUCTION
30
RESEARCH METHODOLOGY
36
EXECUTIVE SUMMARY
49
PREMIUM INSIGHTS
54
MARKET OVERVIEW
57
  • 5.1 INTRODUCTION
  • 5.2 MARKET DYNAMICS
    DRIVERS
    - Mounting adoption of robots to achieve high returns on investment
    - Rising deployment of Internet of Things to enable cost-effective predictive maintenance
    - Growing emphasis on reducing hospital-acquired infections
    - Increasing interest in robotics research
    - Rising insurance coverage for medical exoskeletons and robotic surgeries
    RESTRAINTS
    - Concerns regarding data privacy and regulations
    OPPORTUNITIES
    - Increasing reliance on robots to assist handicapped and geriatric population
    - Growing focus on improving the endurance and capability of robots
    - Adoption of swarm intelligence technology to enable robots to perform complex tasks
    CHALLENGES
    - Technical issues of robots
  • 5.3 TRENDS/DISRUPTIONS IMPACTING CUSTOMER BUSINESS
  • 5.4 PRICING ANALYSIS
    INDICATIVE PRICING OF SERVICE ROBOTS, BY TYPE, 2023
    INDICATIVE PRICING OF SERVICE ROBOTS, BY REGION, 2023
  • 5.5 VALUE CHAIN ANALYSIS
  • 5.6 ECOSYSTEM ANALYSIS
  • 5.7 INVESTMENT AND FUNDING SCENARIO
  • 5.8 TECHNOLOGY ANALYSIS
    KEY TECHNOLOGIES
    - Artificial Intelligence (AI)
    - Standard OS
    - Telepresence robots and humanoids
    - Robot as a service (RaaS)
    COMPLEMENTARY TECHNOLOGIES
    - Vision guidance
  • 5.9 IMPACT OF GEN AI/AI ON SERVICE ROBOTICS MARKET
  • 5.10 CASE STUDY ANALYSIS
    RICE FARMERS IN BRAZIL INCORPORATE DJI’S AGRAS T40 DRONES TO CONTROL PESTS AND ENHANCE FARMING EFFICIENCY
    PAL ROBOTICS TAKES PART IN SANDRO PROJECT TO INTRODUCE INNOVATIVE ROBOTS TO ASSIST ELDERLY POPULATION
    NIPPON DINING USES SOFTBANK ROBOTICS GROUP’S KEENBOT ROBOT TO ENSURE COST SAVINGS
  • 5.11 PATENT ANALYSIS
  • 5.12 TRADE ANALYSIS
    IMPORT SCENARIO (HS CODE 850860)
    EXPORT SCENARIO (HS CODE 850860)
  • 5.13 TARIFF AND REGULATORY LANDSCAPE
    TARIFF ANALYSIS (HS CODE 850860)
    REGULATORY BODIES, GOVERNMENT AGENCIES, AND OTHER ORGANIZATIONS
  • 5.14 KEY CONFERENCES AND EVENTS, 2024–2025
  • 5.15 PORTER’S FIVE FORCES ANALYSIS
    INTENSITY OF COMPETITIVE RIVALRY
    BARGAINING POWER OF SUPPLIERS
    BARGAINING POWER OF BUYERS
    THREAT OF SUBSTITUTES
    THREAT OF NEW ENTRANTS
  • 5.16 KEY STAKEHOLDERS AND BUYING CRITERIA
    KEY STAKEHOLDERS IN BUYING PROCESS
    BUYING CRITERIA
SERVICE ROBOTICS MARKET, BY ENVIRONMENT
95
  • 6.1 INTRODUCTION
  • 6.2 AERIAL
    COMMERCIAL DRONES
    - Increasing use in aerial photography, inspection, and other applications to fuel segmental growth
    CONSUMER DRONES
    - Rising adoption in entertainment and commercial applications to augment segmental growth
  • 6.3 GROUND
    AUTOMATED GUIDED VEHICLES
    - Tow vehicles
    - Unit load carriers
    - Pallet trucks
    - Forklift trucks
    - Assembly line vehicles
    - Disinfection robots
    - Other AGVs
    CLEANING ROBOTS
    - Increasing population and number of nuclear families to contribute to segmental growth
    - Vacuuming robots
    - Lawnmowers
    - Pool-cleaning robots
    - Window- and gutter-cleaning robots
    AGRICULTURAL ROBOTS
    - Milking robots
    - Automated harvesting systems
    SURGICAL ROBOTS
    - Growing preference for laparoscopic surgeries to foster segmental growth
    - Laparoscopy robotic systems
    - Orthopedic robotic systems
    - Neurosurgical robotic systems
    ENTERTAINMENT & LEISURE ROBOTS
    - Toy robots
    - Hobby systems
    INSPECTION ROBOTS
    - Increased adoption in hazardous environments to boost segmental growth
    HUMANOID ROBOTS
    - Rising introduction of advanced features to contribute to segmental growth
    POWERED EXOSKELETONS
    - Increasing use in industrial, medical, military, and construction verticals to bolster segmental growth
    TELEPRESENCE ROBOTS
    - Mounting adoption in healthcare and corporate sectors to expedite segmental growth
    OTHER GROUND ROBOTS
  • 6.4 MARINE
    UNMANNED SURFACE VEHICLES (USVS)
    - Rising use in defense, oceanography, surveillance, and search and rescue operations to drive market
    AUTONOMOUS UNDERWATER VEHICLES (AUVS)
    - Increasing deployment to collect oceanographic and geologic information to foster segmental growth
    REMOTELY OPERATED VEHICLES (ROVS)
    - Growing adoption in oil and gas explorations, pipeline inspections, and vessel hull inspections to fuel segmental growth
SERVICE ROBOTICS MARKET, BY TYPE
150
  • 7.1 INTRODUCTION
  • 7.2 PROFESSIONAL
    RISING EMPHASIS ON IMPROVING WAREHOUSE OPERATIONS AND REDUCING LABOR COSTS TO AUGMENT SEGMENTAL GROWTH
  • 7.3 PERSONAL & DOMESTIC
    INCREASING FOCUS ON PERSONAL ASSISTANCE AND ELDERLY CARE ROBOTS TO FOSTER SEGMENTAL GROWTH
SERVICE ROBOTICS MARKET, BY COMPONENT
155
  • 8.1 INTRODUCTION
  • 8.2 HARDWARE
    AIRFRAMES
    - Growing focus on reducing weight and increasing payload capacity of drones to fuel segmental growth
    - Alloy
    - Plastic
    - Composite
    SENSORS
    - Increasing need to enhance operational capabilities of robots to contribute to segmental growth
    - Motion
    - Light
    - Proximity
    - Temperature
    - Position
    - Other sensors
    CAMERAS
    - Rising adoption for precise 3D mapping and distance measurement to expedite segmental growth
    - Multispectral
    - Thermal
    - Infrared
    - LiDAR
    - High-resolution
    ACTUATORS
    - Rising deployment for high-speed and repetitive tasks to contribute to segmental growth
    - Rotational
    - Linear
    POWER SUPPLY SYSTEMS
    - Mounting demand for batteries capable of communicating with robots to accelerate segmental growth
    CONTROL SYSTEMS
    - Rising use to control and coordinate functions of service robots to foster segmental growth
    NAVIGATION SYSTEMS
    - Increasing reliance on autonomous and semi-autonomous operations to expedite segmental growth
    - GPS/GNSS & GLONASS
    - Inertial
    - Safety
    - Compass
    PROPULSION SYSTEMS
    - Rising adoption to manage and ensure precise motion control to augment segmental growth
    OTHER HARDWARE
  • 8.3 SOFTWARE
    INCREASING SOPHISTICATION OF ROBOTS TO CONTRIBUTE TO SEGMENTAL GROWTH
SERVICE ROBOTICS MARKET, BY APPLICATION
172
  • 9.1 INTRODUCTION
  • 9.2 DOMESTIC
    BURGEONING DEMAND FOR DISINFECTING ROBOTS TO CONTRIBUTE TO SEGMENTAL GROWTH
    FLOOR CLEANING
    LAWN MOWING
    POOL CLEANING
    OTHER DOMESTIC APPLICATIONS
  • 9.3 MEDICAL
    INCREASING AGING POPULATION TO ACCELERATE SEGMENTAL GROWTH
    SURGERY ASSISTANCE
    HANDICAP ASSISTANCE
    OTHER MEDICAL APPLICATIONS
  • 9.4 FIELD
    RISING EMPHASIS ON PRECISION IRRIGATION AND FERTILIZATION TO CONTRIBUTE TO SEGMENTAL GROWTH
    HARVEST MANAGEMENT
    FARMING
    - Crop monitoring
    - Plant scouting
    - Crop scouting
    DAIRY & LIVESTOCK MANAGEMENT
    OTHER FIELD APPLICATIONS
  • 9.5 DEFENSE, RESCUE & SECURITY
    GROWING RELIANCE ON ROBOTS TO IDENTIFY RISK-PRONE AREAS FROM REMOTE LOCATIONS AND TRACK ILLEGAL ACTIVITIES TO DRIVE MARKET
    DEMINING
    FIREFIGHTING & BOMB DISPOSAL
    BORDER SECURITY & SURVEILLANCE
    OTHER DEFENSE, RESCUE & SECURITY APPLICATIONS
  • 9.6 ENTERTAINMENT, EDUCATION & PERSONAL
    MOUNTING DEMAND FOR EDUCATIONAL AND TRAINING ROBOTS TO FOSTER SEGMENTAL GROWTH
    ENTERTAINMENT
    EDUCATION
    COMPANIONSHIP & ELDERLY ASSISTANCE
  • 9.7 PUBLIC RELATION
    ESCALATING ADOPTION OF ROBOTS FOR ROOM SERVICE, SECURITY, LAW ENFORCEMENT, AND MOBILE GUIDANCE TO FUEL SEGMENTAL GROWTH
  • 9.8 INSPECTION & MAINTENANCE
    INCREASING USE OF DRONES TO INSPECT POWER PLANTS AND OTHER LARGE STRUCTURES TO BOLSTER SEGMENTAL GROWTH
    PIPE/PIPELINE INSPECTION
    POWER PLANT INSPECTION
    ENERGIZED TRANSMISSION LINE INSPECTION
    OTHER INSPECTION & MAINTENANCE APPLICATIONS
  • 9.9 LOGISTICS
    RISING DEPLOYMENT OF COST-EFFECTIVE DELIVERY ROBOTS TO REDUCE OVERALL COSTS TO FUEL SEGMENTAL GROWTH
    WAREHOUSE AUTOMATION
    LAST-MILE DELIVERY
  • 9.10 CONSTRUCTION & DEMOLITION
    INCREASING USE OF ROBOTS TO REDUCE LABOR COSTS AND ENSURE HIGH RETURNS ON INVESTMENT TO DRIVE MARKET
  • 9.11 MARITIME
    RISING DEEP SEA EXPLORATION TO CONTRIBUTE TO SEGMENTAL GROWTH
    OCEANOGRAPHY
    ENVIRONMENTAL PROTECTION & MONITORING
    ARCHAEOLOGICAL EXPLORATION
    OTHER MARITIME APPLICATIONS
  • 9.12 RESEARCH & SPACE EXPLORATION
    MOUNTING DEMAND FOR SPACE EXPLORATION ROBOTS TO BOOST SEGMENTAL GROWTH
    SERVICE ROBOTICS MARKET, BY REGION
SERVICE ROBOTICS MARKET, BY REGION
198
  • 10.1 INTRODUCTION
  • 10.2 NORTH AMERICA
    MACROECONOMIC OUTLOOK FOR NORTH AMERICA
    US
    - Increasing aging population and high disposable income to boost market growth
    CANADA
    - Rising wages and labor shortages to contribute to market growth
    MEXICO
    - Escalating adoption of commercial drones in agricultural applications to drive market
  • 10.3 ASIA PACIFIC
    MACROECONOMIC OUTLOOK FOR ASIA PACIFIC
    CHINA
    - Mounting demand for personal and domestic robots to bolster market growth
    SOUTH KOREA
    - Increasing deployment of advanced technologies to contribute to market growth
    JAPAN
    - Rising exploration of technologies for disaster relief and elderly assistance applications to drive market
    INDIA
    - Growing emphasis on reducing costs of automation solutions to boost market growth
    AUSTRALIA
    - Increasing adoption of robots in logistics and warehousing applications to augment market growth
    REST OF ASIA PACIFIC
  • 10.4 EUROPE
    MACROECONOMIC OUTLOOK FOR EUROPE
    GERMANY
    - Thriving food & beverages, retail, and postal industries to bolster market growth
    FRANCE
    - Burgeoning demand for assistive and surgical robots to accelerate market growth
    UK
    - Rising per capita income and government-led funding for robots to expedite market growth
    ITALY
    - Rapid technological advances and demand for automation solutions to augment market growth
    SPAIN
    - Rising emphasis on improving efficiency and productivity of industrial sectors to drive market
    REST OF EUROPE
  • 10.5 ROW
    MACROECONOMIC OUTLOOK FOR ROW
    SOUTH AMERICA
    - Growing emphasis on public and specialized education to foster market growth
    MIDDLE EAST & AFRICA
    - Mounting demand for healthcare robots to fuel market growth
    - GCC countries
    - Africa & Rest of Middle East
COMPETITIVE LANDSCAPE
233
  • 11.1 OVERVIEW
  • 11.2 KEY PLAYER STRATEGIES/ RIGHT TO WIN, 2021–2024
  • 11.3 REVENUE ANALYSIS, 2021–2023
  • 11.4 MARKET SHARE ANALYSIS, 2023
  • 11.5 COMPANY VALUATION AND FINANCIAL METRICS, 2024
  • 11.6 PRODUCT COMPARISON
  • 11.7 COMPANY EVALUATION MATRIX: KEY PLAYERS, 2023
    STARS
    EMERGING LEADERS
    PERVASIVE PLAYERS
    PARTICIPANTS
    COMPANY FOOTPRINT: KEY PLAYERS, 2023
    - Company footprint
    - Region footprint
    - Environment footprint
    - Type footprint
    - Application footprint
  • 11.8 COMPANY EVALUATION MATRIX: STARTUPS/SMES, 2023
    PROGRESSIVE COMPANIES
    RESPONSIVE COMPANIES
    DYNAMIC COMPANIES
    STARTING BLOCKS
    COMPETITIVE BENCHMARKING: STARTUPS/SMES, 2023
    - Detailed list of key startups/SMEs
    - Competitive benchmarking of key startups/SMEs
  • 11.9 COMPETITIVE SCENARIO
    PRODUCT LAUNCHES
    DEALS
    EXPANSIONS
COMPANY PROFILES
255
  • 12.1 KEY PLAYERS
    INTUITIVE SURGICAL OPERATIONS, INC.
    - Business overview
    - Products/Services/Solutions offered
    - Recent developments
    - MnM view
    DJI
    - Business overview
    - Products/Services/Solutions offered
    - Recent developments
    - MnM view
    DAIFUKU CO., LTD.
    - Business overview
    - Products/Services/Solutions offered
    - Recent developments
    - MnM view
    JD.COM, INC.
    - Business overview
    - Products/Services/Solutions offered
    - Recent developments
    - MnM view
    IROBOT CORPORATION
    - Business overview
    - Products/Services/Solutions offered
    - Recent developments
    - MnM view
    SAMSUNG ELECTRONICS CO., LTD.
    - Business overview
    - Products/Services/Solutions offered
    - Recent developments
    KONGSBERG
    - Business overview
    - Products/Services/Solutions offered
    - Recent developments
    NORTHROP GRUMMAN
    - Business overview
    - Products/Services/Solutions offered
    SOFTBANK ROBOTICS GROUP
    - Business overview
    - Products/Services/Solutions offered
    - Recent developments
    DELAVAL
    - Business overview
    - Products/Services/Solutions offered
    - Recent developments
  • 12.2 OTHER PLAYERS
    KUKA AG
    STRYKER
    NEATO ROBOTICS, INC.
    GENERAL ELECTRIC COMPANY
    LG ELECTRONICS
    HARVEST CROO ROBOTICS LLC
    STARSHIP TECHNOLOGIES
    3DR, INC.
    LELY
    DILIGENT ROBOTICS INC.
    AMP ROBOTICS
    BLUE OCEAN ROBOTICS
    XAG CO., LTD.
    EXYN TECHNOLOGIES
    ROBOTIS CO., LTD.
APPENDIX
300
  • 13.1 INSIGHTS FROM INDUSTRY EXPERTS
  • 13.2 DISCUSSION GUIDE
  • 13.3 KNOWLEDGESTORE: MARKETSANDMARKETS’ SUBSCRIPTION PORTAL
  • 13.4 CUSTOMIZATION OPTIONS
  • 13.5 RELATED REPORTS
  • 13.6 AUTHOR DETAILS
LIST OF TABLES
 
  • TABLE 1 SERVICE ROBOTICS MARKET: RESEARCH ASSUMPTIONS
  • TABLE 2 SERVICE ROBOTICS MARKET: RISK ANALYSIS
  • TABLE 3 INDICATIVE PRICING OF SERVICE ROBOTS OFFERED BY THREE KEY PLAYERS, BY TYPE, 2023
  • TABLE 4 INDICATIVE PRICING OF SERVICE ROBOTS, BY REGION, 2023
  • TABLE 5 MAPPING OF ROBOT TYPES AND OEMS
  • TABLE 6 MAPPING OF ROBOT TYPES AND STARTUPS
  • TABLE 7 ROLE OF COMPANIES IN SERVICE ROBOTICS ECOSYSTEM
  • TABLE 8 LIST OF MAJOR PATENTS, 2021–2024
  • TABLE 9 IMPORT DATA FOR HS CODE 850860-COMPLIANT PRODUCTS, BY COUNTRY, 2019–2023 (USD THOUSAND)
  • TABLE 10 EXPORT DATA FOR HS CODE 850860-COMPLIANT PRODUCTS, BY COUNTRY, 2019–2023 (USD THOUSAND)
  • TABLE 11 MFN TARIFFS FOR HS CODE 850860-CODE COMPLIANT PRODUCTS EXPORTED BY US, 2023
  • TABLE 12 MFN TARIFFS FOR HS CODE 850860-CODE COMPLIANT PRODUCTS EXPORTED BY BELGIUM, 2023
  • TABLE 13 MFN TARIFFS FOR HS CODE 850860-CODE COMPLIANT PRODUCTS EXPORTED BY INDIA, 2023
  • TABLE 14 MFN TARIFFS FOR HS CODE 850860-CODE COMPLIANT PRODUCTS EXPORTED BY UK, 2023
  • TABLE 15 MFN TARIFFS FOR HS CODE 850860-CODE COMPLIANT PRODUCTS EXPORTED BY FRANCE, 2023
  • TABLE 16 NORTH AMERICA: REGULATORY BODIES, GOVERNMENT AGENCIES, AND OTHER ORGANIZATIONS
  • TABLE 17 EUROPE: REGULATORY BODIES, GOVERNMENT AGENCIES, AND OTHER ORGANIZATIONS
  • TABLE 18 ASIA PACIFIC: REGULATORY BODIES, GOVERNMENT AGENCIES, AND OTHER ORGANIZATIONS
  • TABLE 19 ROW: REGULATORY BODIES, GOVERNMENT AGENCIES, AND OTHER ORGANIZATIONS
  • TABLE 20 LIST OF KEY CONFERENCES AND EVENTS, 2024–2025
  • TABLE 21 PORTER’S FIVE FORCES ANALYSIS
  • TABLE 22 INFLUENCE OF STAKEHOLDERS ON BUYING PROCESS FOR TOP THREE APPLICATIONS
  • TABLE 23 KEY BUYING CRITERIA FOR TOP THREE APPLICATIONS
  • TABLE 24 SERVICE ROBOTICS MARKET, BY ENVIRONMENT, 2020–2023 (USD MILLION)
  • TABLE 25 MARKET, BY ENVIRONMENT, 2024–2029 (USD MILLION)
  • TABLE 26 LIST OF COMPANIES OFFERING DRONES
  • TABLE 27 AERIAL: SERVICE ROBOTICS MARKET, BY TYPE, 2020–2023 (USD MILLION)
  • TABLE 28 AERIAL: MARKET, BY TYPE, 2024–2029 (USD MILLION)
  • TABLE 29 AERIAL: MARKET, BY COMPONENT, 2020–2023 (USD MILLION)
  • TABLE 30 AERIAL: MARKET, BY COMPONENT, 2024–2029 (USD MILLION)
  • TABLE 31 AERIAL: MARKET FOR HARDWARE, BY COMPONENT TYPE, 2020–2023 (USD MILLION)
  • TABLE 32 AERIAL: MARKET FOR HARDWARE, BY COMPONENT TYPE, 2024–2029 (USD MILLION)
  • TABLE 33 AERIAL: MARKET, BY APPLICATION TYPE, 2020–2023 (USD MILLION)
  • TABLE 34 AERIAL: MARKET, BY APPLICATION TYPE, 2024–2029 (USD MILLION)
  • TABLE 35 PROFESSIONAL AERIAL ROBOTS: SERVICE ROBOTICS MARKET, BY REGION, 2020–2023 (USD MILLION)
  • TABLE 36 PROFESSIONAL AERIAL ROBOTS: MARKET, BY REGION, 2024–2029 (USD MILLION)
  • TABLE 37 PROFESSIONAL AERIAL ROBOTS: MARKET IN NORTH AMERICA, BY COUNTRY, 2020–2023 (USD MILLION)
  • TABLE 38 PROFESSIONAL AERIAL ROBOTS: MARKET IN NORTH AMERICA, BY COUNTRY, 2024–2029 (USD MILLION)
  • TABLE 39 PROFESSIONAL AERIAL ROBOTS: MARKET IN EUROPE, BY COUNTRY, 2020–2023 (USD MILLION)
  • TABLE 40 PROFESSIONAL AERIAL ROBOTS: SERVICE ROBOTICS MARKET IN EUROPE, BY COUNTRY, 2024–2029 (USD MILLION)
  • TABLE 41 PROFESSIONAL AERIAL ROBOTS: MARKET IN ASIA PACIFIC, BY COUNTRY, 2020–2023 (USD MILLION)
  • TABLE 42 PROFESSIONAL AERIAL ROBOTS: MARKET IN ASIA PACIFIC, BY COUNTRY, 2024–2029 (USD MILLION)
  • TABLE 43 PROFESSIONAL AERIAL ROBOTS: MARKET IN ROW, BY REGION, 2020–2023 (USD MILLION)
  • TABLE 44 PROFESSIONAL AERIAL ROBOTS: MARKET IN ROW, BY REGION, 2024–2029 (USD MILLION)
  • TABLE 45 PROFESSIONAL AERIAL ROBOTS: MARKET IN MIDDLE EAST & AFRICA, BY COUNTRY, 2020–2023 (USD MILLION)
  • TABLE 46 PROFESSIONAL AERIAL ROBOTS: MARKET IN MIDDLE EAST & AFRICA, BY COUNTRY, 2024–2029 (USD MILLION)
  • TABLE 47 PERSONAL & DOMESTIC AERIAL ROBOTS: SERVICE ROBOTICS MARKET, BY REGION, 2020–2023 (USD MILLION)
  • TABLE 48 PERSONAL & DOMESTIC AERIAL ROBOTS: MARKET, BY REGION, 2024–2029 (USD MILLION)
  • TABLE 49 PERSONAL & DOMESTIC AERIAL ROBOTS: ARKET IN NORTH AMERICA, BY COUNTRY, 2020–2023 (USD MILLION)
  • TABLE 50 PERSONAL & DOMESTIC AERIAL ROBOTS: MARKET IN NORTH AMERICA, BY COUNTRY, 2024–2029 (USD MILLION)
  • TABLE 51 PERSONAL & DOMESTIC AERIAL ROBOTS: MARKET IN EUROPE, BY COUNTRY, 2020–2023 (USD MILLION)
  • TABLE 52 PERSONAL & DOMESTIC AERIAL ROBOTS: SERVICE ROBOTICS MARKET IN EUROPE, BY COUNTRY, 2024–2029 (USD MILLION)
  • TABLE 53 PERSONAL & DOMESTIC AERIAL ROBOTS: MARKET IN ASIA PACIFIC, BY COUNTRY, 2020–2023 (USD MILLION)
  • TABLE 54 PERSONAL & DOMESTIC AERIAL ROBOTS: MARKET IN ASIA PACIFIC, BY COUNTRY, 2024–2029 (USD MILLION)
  • TABLE 55 PERSONAL & DOMESTIC AERIAL ROBOTS: MARKET IN ROW, BY REGION, 2020–2023 (USD MILLION)
  • TABLE 56 PERSONAL & DOMESTIC AERIAL ROBOTS: MARKET IN ROW, BY REGION, 2024–2029 (USD MILLION)
  • TABLE 57 PERSONAL & DOMESTIC AERIAL ROBOTS: MARKET IN MIDDLE EAST & AFRICA, BY COUNTRY, 2020–2023 (USD MILLION)
  • TABLE 58 PERSONAL & DOMESTIC AERIAL ROBOTS: MARKET IN MIDDLE EAST & AFRICA, BY COUNTRY, 2024–2029 (USD MILLION)
  • TABLE 59 GROUND: SERVICE ROBOTICS MARKET, BY TYPE, 2020–2023 (USD MILLION)
  • TABLE 60 GROUND: MARKET, BY TYPE, 2024–2029 (USD MILLION)
  • TABLE 61 GROUND: MARKET, BY COMPONENT, 2020–2023 (USD MILLION)
  • TABLE 62 GROUND: MARKET, BY COMPONENT, 2024–2029 (USD MILLION)
  • TABLE 63 GROUND: SERVICE ROBOTICS MARKET FOR HARDWARE, BY COMPONENT TYPE, 2020–2023 (USD MILLION)
  • TABLE 64 GROUND: MARKET FOR HARDWARE, BY COMPONENT TYPE, 2024–2029 (USD MILLION)
  • TABLE 65 GROUND: MARKET, BY ROBOT TYPE, 2020–2023 (USD MILLION)
  • TABLE 66 GROUND: MARKET, BY ROBOT TYPE, 2024–2029 (USD MILLION)
  • TABLE 67 GROUND: MARKET FOR PROFESSIONAL, BY REGION, 2020–2023 (USD MILLION)
  • TABLE 68 GROUND: MARKET FOR PROFESSIONAL, BY REGION, 2024–2029 (USD MILLION)
  • TABLE 69 GROUND: SERVICE ROBOTICS MARKET IN NORTH AMERICA FOR PROFESSIONAL, BY COUNTRY, 2020–2023 (USD MILLION)
  • TABLE 70 GROUND: MARKET IN NORTH AMERICA FOR PROFESSIONAL, BY COUNTRY, 2024–2029 (USD MILLION)
  • TABLE 71 GROUND: MARKET IN EUROPE FOR PROFESSIONAL, 2020–2023 (USD MILLION)
  • TABLE 72 GROUND: MARKET IN EUROPE FOR PROFESSIONAL, BY COUNTRY, 2024–2029 (USD MILLION)
  • TABLE 73 GROUND: MARKET IN ASIA PACIFIC FOR PROFESSIONAL, BY COUNTRY, 2020–2023 (USD MILLION)
  • TABLE 74 GROUND: SERVICE ROBOTICS MARKET IN ASIA PACIFIC FOR PROFESSIONAL, BY COUNTRY, 2024–2029 (USD MILLION)
  • TABLE 75 GROUND: MARKET IN ROW FOR PROFESSIONAL, BY REGION, 2020–2023 (USD MILLION)
  • TABLE 76 GROUND: MARKET IN ROW FOR PROFESSIONAL, BY REGION, 2024–2029 (USD MILLION)
  • TABLE 77 GROUND: MARKET IN MIDDLE EAST & AFRICA FOR PROFESSIONAL, BY COUNTRY, 2020–2023 (USD MILLION)
  • TABLE 78 GROUND: MARKET IN MIDDLE EAST & AFRICA FOR PROFESSIONAL, BY COUNTRY, 2024–2029 (USD MILLION)
  • TABLE 79 GROUND: SERVICE ROBOTICS MARKET FOR PERSONAL & DOMESTIC, BY REGION, 2020–2023 (USD MILLION)
  • TABLE 80 GROUND: MARKET FOR PERSONAL & DOMESTIC, BY REGION, 2024–2029 (USD MILLION)
  • TABLE 81 GROUND: MARKET IN NORTH AMERICA FOR PERSONAL & DOMESTIC, BY COUNTRY, 2020–2023 (USD MILLION)
  • TABLE 82 GROUND: MARKET IN NORTH AMERICA FOR PERSONAL & DOMESTIC, BY COUNTRY, 2024–2029 (USD MILLION)
  • TABLE 83 GROUND: MARKET IN EUROPE FOR PERSONAL & DOMESTIC, BY COUNTRY, 2020–2023 (USD MILLION)
  • TABLE 84 GROUND: MARKET IN EUROPE FOR PERSONAL & DOMESTIC, BY COUNTRY, 2024–2029 (USD MILLION)
  • TABLE 85 GROUND: MARKET IN ASIA PACIFIC FOR PERSONAL & DOMESTIC, BY COUNTRY, 2020–2023 (USD MILLION)
  • TABLE 86 GROUND: MARKET IN ASIA PACIFIC FOR PERSONAL & DOMESTIC, BY COUNTRY, 2024–2029 (USD MILLION)
  • TABLE 87 GROUND: MARKET IN ROW FOR PERSONAL & DOMESTIC, BY REGION, 2020–2023 (USD MILLION)
  • TABLE 88 GROUND: MARKET IN ROW FOR PERSONAL & DOMESTIC, BY REGION, 2024–2029 (USD MILLION)
  • TABLE 89 GROUND: MARKET IN MIDDLE EAST & AFRICA FOR PERSONAL & DOMESTIC, BY COUNTRY, 2020–2023 (USD MILLION)
  • TABLE 90 GROUND: MARKET IN MIDDLE EAST & AFRICA FOR PERSONAL & DOMESTIC, BY COUNTRY, 2024–2029 (USD MILLION)
  • TABLE 91 LIST OF COMPANIES PROVIDING AGVS
  • TABLE 92 AUTOMATED GUIDED VEHICLES: SERVICE ROBOTICS MARKET, BY VEHICLE TYPE, 2020–2023 (USD MILLION)
  • TABLE 93 AUTOMATED GUIDED VEHICLES: MARKET, BY VEHICLE TYPE, 2024–2029 (USD MILLION)
  • TABLE 94 CLEANING ROBOTS: SERVICE ROBOTICS MARKET, BY ROBOT TYPE, 2020–2023 (USD MILLION)
  • TABLE 95 CLEANING ROBOTS: MARKET, BY ROBOT TYPE, 2024–2029 (USD MILLION)
  • TABLE 96 LIST OF COMPANIES OFFERING VACUUMING ROBOTS
  • TABLE 97 LIST OF COMPANIES OFFERING LAWNMOWERS
  • TABLE 98 LIST OF COMPANIES OFFERING POOL-CLEANING ROBOTS
  • TABLE 99 LIST OF COMPANIES OFFERING WINDOW- AND GUTTER-CLEANING ROBOTS
  • TABLE 100 LIST OF COMPANIES OFFERING AGRICULTURAL ROBOTS
  • TABLE 101 AGRICULTURAL ROBOTS: SERVICE ROBOTICS MARKET, BY ROBOT TYPE, 2020–2023 (USD MILLION)
  • TABLE 102 AGRICULTURAL ROBOTS: MARKET, BY ROBOT TYPE, 2024–2029 (USD MILLION)
  • TABLE 103 LIST OF COMPANIES OFFERING SURGICAL ROBOTS
  • TABLE 104 LIST OF COMPANIES OFFERING ENTERTAINMENT & LEISURE ROBOTS
  • TABLE 105 ENTERTAINMENT & LEISURE ROBOTS: SERVICE ROBOTICS MARKET, BY ROBOT TYPE, 2020–2023 (USD MILLION)
  • TABLE 106 ENTERTAINMENT & LEISURE ROBOTS: MARKET, BY ROBOT TYPE, 2024–2029 (USD MILLION)
  • TABLE 107 LIST OF COMPANIES OFFERING INSPECTION ROBOTS
  • TABLE 108 LIST OF COMPANIES OFFERING HUMANOID ROBOTS
  • TABLE 109 HUMANOID ROBOTS: SERVICE ROBOTICS MARKET, BY TYPE, 2020–2023 (USD MILLION)
  • TABLE 110 HUMANOID ROBOTS: MARKET, BY TYPE, 2024–2029 (USD MILLION)
  • TABLE 111 LIST OF COMPANIES OFFERING POWERED EXOSKELETONS
  • TABLE 112 LIST OF COMPANIES OFFERING TELEPRESENCE ROBOTS
  • TABLE 113 TELEPRESENCE ROBOTS: SERVICE ROBOTICS MARKET, BY TYPE, 2020–2023 (USD MILLION)
  • TABLE 114 TELEPRESENCE ROBOTS: MARKET, BY TYPE, 2024–2029 (USD MILLION)
  • TABLE 115 MARINE: SERVICE ROBOTICS MARKET, BY ROBOT TYPE, 2020–2023 (USD MILLION)
  • TABLE 116 MARINE: MARKET, BY ROBOT TYPE, 2024–2029 (USD MILLION)
  • TABLE 117 MARINE: MARKET, BY TYPE, 2020–2023 (USD MILLION)
  • TABLE 118 MARINE: MARKET, BY TYPE, 2024–2029 (USD MILLION)
  • TABLE 119 MARINE: MARKET, BY COMPONENT, 2020–2023 (USD MILLION)
  • TABLE 120 MARINE: MARKET, BY COMPONENT, 2024–2029 (USD MILLION)
  • TABLE 121 MARINE: SERVICE ROBOTICS MARKET FOR HARDWARE, BY COMPONENT TYPE, 2020–2023 (USD MILLION)
  • TABLE 122 MARINE: MARKET FOR HARDWARE, BY COMPONENT TYPE, 2024–2029 (USD MILLION)
  • TABLE 123 MARINE: MARKET, BY REGION, 2020–2023 (USD MILLION)
  • TABLE 124 MARINE: MARKET, BY REGION, 2024–2029 (USD MILLION)
  • TABLE 125 MARINE: MARKET IN NORTH AMERICA, BY COUNTRY, 2020–2023 (USD MILLION)
  • TABLE 126 MARINE: SERVICE ROBOTICS MARKET IN NORTH AMERICA, BY COUNTRY, 2024–2029 (USD MILLION)
  • TABLE 127 MARINE: MARKET IN EUROPE, BY COUNTRY, 2020–2023 (USD MILLION)
  • TABLE 128 MARINE: MARKET IN EUROPE, BY COUNTRY, 2024–2029 (USD MILLION)
  • TABLE 129 MARINE: MARKET IN ASIA PACIFIC, BY COUNTRY, 2020–2023 (USD MILLION)
  • TABLE 130 MARINE: MARKET IN ASIA PACIFIC, BY COUNTRY, 2024–2029 (USD MILLION)
  • TABLE 131 MARINE: MARKET IN ROW, BY REGION, 2020–2023 (USD MILLION)
  • TABLE 132 MARINE: MARKET IN ROW, BY REGION, 2024–2029 (USD MILLION)
  • TABLE 133 MARINE: MARKET IN MIDDLE EAST & AFRICA, BY COUNTRY, 2020–2023 (USD MILLION)
  • TABLE 134 MARINE: MARKET IN MIDDLE EAST & AFRICA, BY COUNTRY, 2024–2029 (USD MILLION)
  • TABLE 135 UNMANNED SURFACE VEHICLES (USVS): SERVICE ROBOTICS MARKET, BY APPLICATION, 2020–2023 (USD MILLION)
  • TABLE 136 UNMANNED SURFACE VEHICLES (USVS): MARKET, BY APPLICATION, 2024–2029 (USD MILLION)
  • TABLE 137 LIST OF COMPANIES OFFERING USVS
  • TABLE 138 AUTONOMOUS UNDERWATER VEHICLES (AUVS): SERVICE ROBOTICS MARKET, BY APPLICATION, 2020–2023 (USD MILLION)
  • TABLE 139 AUTONOMOUS UNDERWATER VEHICLES (AUVS): MARKET, BY APPLICATION, 2024–2029 (USD MILLION)
  • TABLE 140 LIST OF COMPANIES OFFERING AUVS
  • TABLE 141 REMOTELY OPERATED VEHICLES (ROVS): SERVICE ROBOTICS MARKET, BY APPLICATION, 2020–2023 (USD MILLION)
  • TABLE 142 REMOTELY OPERATED VEHICLES (ROVS): MARKET, BY APPLICATION, 2024–2029 (USD MILLION)
  • TABLE 143 LIST OF COMPANIES OFFERING ROVS
  • TABLE 144 SERVICE ROBOTICS MARKET, BY TYPE, 2020–2023 (USD MILLION)
  • TABLE 145 MARKET, BY TYPE, 2024–2029 (USD MILLION)
  • TABLE 146 MARKET, BY TYPE, 2020–2023 (THOUSAND UNITS)
  • TABLE 147 MARKET, BY TYPE, 2024–2029 (THOUSAND UNITS)
  • TABLE 148 PROFESSIONAL: SERVICE ROBOTICS MARKET, BY ENVIRONMENT, 2020–2023 (USD MILLION)
  • TABLE 149 PROFESSIONAL: MARKET, BY ENVIRONMENT, 2024–2029 (USD MILLION)
  • TABLE 150 PERSONAL & DOMESTIC: MARKET, BY ENVIRONMENT, 2020–2023 (USD MILLION)
  • TABLE 151 PERSONAL & DOMESTIC: MARKET, BY ENVIRONMENT, 2024–2029 (USD MILLION)
  • TABLE 152 SERVICE ROBOTICS MARKET, BY COMPONENT, 2020–2023 (USD MILLION)
  • TABLE 153 MARKET, BY COMPONENT, 2024–2029 (USD MILLION)
  • TABLE 154 HARDWARE: SERVICE ROBOTICS MARKET, BY COMPONENT TYPE, 2020–2023 (USD MILLION)
  • TABLE 155 HARDWARE: MARKET, BY COMPONENT TYPE, 2024–2029 (USD MILLION)
  • TABLE 156 HARDWARE: MARKET, BY ENVIRONMENT, 2020–2023 (USD MILLION)
  • TABLE 157 HARDWARE: MARKET, BY ENVIRONMENT, 2024–2029 (USD MILLION)
  • TABLE 158 SOFTWARE: MARKET, BY ENVIRONMENT, 2020–2023 (USD MILLION)
  • TABLE 159 SOFTWARE: MARKET, BY ENVIRONMENT, 2024–2029 (USD MILLION)
  • TABLE 160 SERVICE ROBOTICS MARKET, BY APPLICATION, 2020–2023 (USD MILLION)
  • TABLE 161 MARKET, BY APPLICATION, 2024–2029 (USD MILLION)
  • TABLE 162 DOMESTIC: SERVICE ROBOTICS MARKET, BY ENVIRONMENT, 2020–2023 (USD MILLION)
  • TABLE 163 DOMESTIC: MARKET, BY ENVIRONMENT, 2024–2029 (USD MILLION)
  • TABLE 164 MEDICAL: MARKET, BY ENVIRONMENT, 2020–2023 (USD MILLION)
  • TABLE 165 MEDICAL: MARKET, BY ENVIRONMENT, 2024–2029 (USD MILLION)
  • TABLE 166 FIELD: MARKET, BY ENVIRONMENT, 2020–2023 (USD MILLION)
  • TABLE 167 FIELD: MARKET, BY ENVIRONMENT, 2024–2029 (USD MILLION)
  • TABLE 168 DEFENSE, RESCUE & SECURITY: SERVICE ROBOTICS MARKET, BY ENVIRONMENT, 2020–2023 (USD MILLION)
  • TABLE 169 DEFENSE, RESCUE & SECURITY: MARKET, BY ENVIRONMENT, 2024–2029 (USD MILLION)
  • TABLE 170 ENTERTAINMENT, EDUCATION & PERSONAL: SERVICE ROBOTICS MARKET, BY ENVIRONMENT, 2020–2023 (USD MILLION)
  • TABLE 171 ENTERTAINMENT, EDUCATION & PERSONAL: MARKET, BY ENVIRONMENT, 2024–2029 (USD MILLION)
  • TABLE 172 PUBLIC RELATION: SERVICE ROBOTICS MARKET, BY ENVIRONMENT, 2020–2023 (USD MILLION)
  • TABLE 173 PUBLIC RELATION: MARKET, BY ENVIRONMENT, 2024–2029 (USD MILLION)
  • TABLE 174 INSPECTION & MAINTENANCE: SERVICE ROBOTICS MARKET, BY ENVIRONMENT, 2020–2023 (USD MILLION)
  • TABLE 175 INSPECTION & MAINTENANCE: MARKET, BY ENVIRONMENT, 2024–2029 (USD MILLION)
  • TABLE 176 LOGISTICS: SERVICE ROBOTICS MARKET, BY ENVIRONMENT, 2020–2023 (USD MILLION)
  • TABLE 177 LOGISTICS: MARKET, BY ENVIRONMENT, 2024–2029 (USD MILLION)
  • TABLE 178 CONSTRUCTION & DEMOLITION: MARKET, BY ENVIRONMENT, 2020–2023 (USD MILLION)
  • TABLE 179 CONSTRUCTION & DEMOLITION: MARKET, BY ENVIRONMENT, 2024–2029 (USD MILLION)
  • TABLE 180 MARITIME: SERVICE ROBOTICS MARKET, BY ENVIRONMENT, 2020–2023 (USD MILLION)
  • TABLE 181 MARITIME: MARKET, BY ENVIRONMENT, 2024–2029 (USD MILLION)
  • TABLE 182 RESEARCH & SPACE EXPLORATION: SERVICE ROBOTICS MARKET, BY ENVIRONMENT, 2020–2023 (USD MILLION)
  • TABLE 183 RESEARCH & SPACE EXPLORATION: MARKET, BY ENVIRONMENT, 2024–2029 (USD MILLION)
  • TABLE 184 SERVICE ROBOTICS MARKET, BY REGION, 2020–2023 (USD MILLION)
  • TABLE 185  MARKET, BY REGION, 2024–2029 (USD MILLION)
  • TABLE 186 LIST OF SERVICE ROBOTICS COMPANIES IN NORTH AMERICA
  • TABLE 187 NORTH AMERICA: SERVICE ROBOTICS MARKET, BY COUNTRY, 2020–2023 (USD MILLION)
  • TABLE 188 NORTH AMERICA: MARKET, BY COUNTRY, 2024–2029 (USD MILLION)
  • TABLE 189 NORTH AMERICA: MARKET, BY ENVIRONMENT, 2020–2023 (USD MILLION)
  • TABLE 190 NORTH AMERICA: MARKET, BY ENVIRONMENT, 2024–2029 (USD MILLION)
  • TABLE 191 NORTH AMERICA: MARKET, BY TYPE, 2020–2023 (USD MILLION)
  • TABLE 192 NORTH AMERICA: MARKET, BY TYPE, 2024–2029 (USD MILLION)
  • TABLE 193 US: SERVICE ROBOTICS MARKET, BY ENVIRONMENT, 2020–2023 (USD MILLION)
  • TABLE 194 US: MARKET, BY ENVIRONMENT, 2024–2029 (USD MILLION)
  • TABLE 195 CANADA: MARKET, BY ENVIRONMENT, 2020–2023 (USD MILLION)
  • TABLE 196 CANADA: MARKET, BY ENVIRONMENT, 2024–2029 (USD MILLION)
  • TABLE 197 MEXICO: MARKET, BY ENVIRONMENT, 2020–2023 (USD MILLION)
  • TABLE 198 MEXICO: MARKET, BY ENVIRONMENT, 2024–2029 (USD MILLION)
  • TABLE 199 LIST OF SERVICE ROBOTICS COMPANIES IN ASIA PACIFIC
  • TABLE 200 ASIA PACIFIC: SERVICE ROBOTICS MARKET, BY ENVIRONMENT, 2020–2023 (USD MILLION)
  • TABLE 201 ASIA PACIFIC: MARKET, BY ENVIRONMENT, 2024–2029 (USD MILLION)
  • TABLE 202 ASIA PACIFIC: MARKET, BY TYPE, 2020–2023 (USD MILLION)
  • TABLE 203 ASIA PACIFIC: MARKET, BY TYPE, 2024–2029 (USD MILLION)
  • TABLE 204 ASIA PACIFIC: MARKET, BY COUNTRY, 2020–2023 (USD MILLION)
  • TABLE 205 ASIA PACIFIC: MARKET, BY COUNTRY, 2024–2029 (USD MILLION)
  • TABLE 206 CHINA: SERVICE ROBOTICS MARKET, BY ENVIRONMENT, 2020–2023 (USD MILLION)
  • TABLE 207 CHINA: MARKET, BY ENVIRONMENT, 2024–2029 (USD MILLION)
  • TABLE 208 SOUTH KOREA: MARKET, BY ENVIRONMENT, 2020–2023 (USD MILLION)
  • TABLE 209 SOUTH KOREA: MARKET, BY ENVIRONMENT, 2024–2029 (USD MILLION)
  • TABLE 210 JAPAN: MARKET, BY ENVIRONMENT, 2020–2023 (USD MILLION)
  • TABLE 211 JAPAN: MARKET, BY ENVIRONMENT, 2024–2029 (USD MILLION)
  • TABLE 212 INDIA: MARKET, BY ENVIRONMENT, 2020–2023 (USD MILLION)
  • TABLE 213 INDIA: MARKET, BY ENVIRONMENT, 2024–2029 (USD MILLION)
  • TABLE 214 AUSTRALIA: SERVICE ROBOTICS MARKET, BY ENVIRONMENT, 2020–2023 (USD MILLION)
  • TABLE 215 AUSTRALIA: MARKET, BY ENVIRONMENT, 2024–2029 (USD MILLION)
  • TABLE 216 REST OF ASIA PACIFIC: MARKET, BY ENVIRONMENT, 2020–2023 (USD MILLION)
  • TABLE 217 REST OF ASIA PACIFIC: MARKET, BY ENVIRONMENT, 2024–2029 (USD MILLION)
  • TABLE 218 LIST OF SERVICE ROBOTICS COMPANIES IN EUROPE
  • TABLE 219 EUROPE: SERVICE ROBOTICS MARKET, BY COUNTRY, 2020–2023 (USD MILLION)
  • TABLE 220 EUROPE: MARKET, BY COUNTRY, 2024–2029 (USD MILLION)
  • TABLE 221 EUROPE: MARKET, BY ENVIRONMENT, 2020–2023 (USD MILLION)
  • TABLE 222 EUROPE: MARKET, BY ENVIRONMENT, 2024–2029 (USD MILLION)
  • TABLE 223 EUROPE: MARKET, BY TYPE, 2020–2023 (USD MILLION)
  • TABLE 224 EUROPE: MARKET, BY TYPE, 2024–2029 (USD MILLION)
  • TABLE 225 UK: MARKET, BY ENVIRONMENT, 2020–2023 (USD MILLION)
  • TABLE 226 UK: MARKET, BY ENVIRONMENT, 2024–2029 (USD MILLION)
  • TABLE 227 GERMANY: SERVICE ROBOTICS MARKET, BY ENVIRONMENT, 2020–2023 (USD MILLION)
  • TABLE 228 GERMANY: MARKET, BY ENVIRONMENT, 2024–2029 (USD MILLION)
  • TABLE 229 FRANCE: MARKET, BY ENVIRONMENT, 2020–2023 (USD MILLION)
  • TABLE 230 FRANCE: MARKET, BY ENVIRONMENT, 2024–2029 (USD MILLION)
  • TABLE 231 ITALY: MARKET, BY ENVIRONMENT, 2020–2023 (USD MILLION)
  • TABLE 232 ITALY: MARKET, BY ENVIRONMENT, 2024–2029 (USD MILLION)
  • TABLE 233 SPAIN: MARKET, BY ENVIRONMENT, 2020–2023 (USD MILLION)
  • TABLE 234 SPAIN: MARKET, BY ENVIRONMENT, 2024–2029 (USD MILLION)
  • TABLE 235 REST OF EUROPE: MARKET, BY ENVIRONMENT, 2020–2023 (USD MILLION)
  • TABLE 236 REST OF EUROPE: MARKET, BY ENVIRONMENT, 2024–2029 (USD MILLION)
  • TABLE 237 LIST OF SERVICE ROBOTICS COMPANIES IN ROW
  • TABLE 238 ROW: SERVICE ROBOTICS MARKET, BY ENVIRONMENT, 2020–2023 (USD MILLION)
  • TABLE 239 ROW: MARKET, BY ENVIRONMENT, 2024–2029 (USD MILLION)
  • TABLE 240 ROW: MARKET, BY TYPE, 2020–2023 (USD MILLION)
  • TABLE 241 ROW: MARKET, BY TYPE, 2024–2029 (USD MILLION)
  • TABLE 242 ROW: MARKET, BY REGION, 2020–2023 (USD MILLION)
  • TABLE 243 ROW: MARKET, BY REGION, 2024–2029 (USD MILLION)
  • TABLE 244 MIDDLE EAST & AFRICA: SERVICE ROBOTICS MARKET, BY COUNTRY, 2020–2023 (USD MILLION)
  • TABLE 245 MIDDLE EAST & AFRICA: MARKET, BY COUNTRY, 2024–2029 (USD MILLION)
  • TABLE 246 SOUTH AMERICA: MARKET, BY ENVIRONMENT, 2020–2023 (USD MILLION)
  • TABLE 247 SOUTH AMERICA: MARKET, BY ENVIRONMENT, 2024–2029 (USD MILLION)
  • TABLE 248 GCC COUNTRIES: MARKET, BY ENVIRONMENT, 2020–2023 (USD MILLION)
  • TABLE 249 GCC COUNTRIES: MARKET, BY ENVIRONMENT, 2024–2029 (USD MILLION)
  • TABLE 250 AFRICA & REST OF MIDDLE EAST: MARKET, BY ENVIRONMENT, 2020–2023 (USD MILLION)
  • TABLE 251 AFRICA & REST OF MIDDLE EAST: MARKET, BY ENVIRONMENT, 2024–2029 (USD MILLION)
  • TABLE 252 SERVICE ROBOTICS MARKET: OVERVIEW OF STRATEGIES ADOPTED BY KEY PLAYERS, 2021–2024
  • TABLE 253 MARKET: DEGREE OF COMPETITION, 2023
  • TABLE 254 MARKET: REGION FOOTPRINT
  • TABLE 255 MARKET: ENVIRONMENT FOOTPRINT
  • TABLE 256 MARKET: TYPE FOOTPRINT
  • TABLE 257 MARKET: APPLICATION FOOTPRINT
  • TABLE 258 MARKET: DETAILED LIST OF KEY STARTUPS/SMES
  • TABLE 259 MARKET: COMPETITIVE BENCHMARKING OF KEY STARTUPS/SMES
  • TABLE 260 MARKET: PRODUCT LAUNCHES, JANUARY 2021–JULY 2024
  • TABLE 261 MARKET: DEALS, JANUARY 2021–JULY 2024
  • TABLE 262 MARKET: EXPANSIONS, JANUARY 2021–JULY 2024
  • TABLE 263 INTUITIVE SURGICAL OPERATIONS, INC.: COMPANY OVERVIEW
  • TABLE 264 INTUITIVE SURGICAL OPERATIONS, INC.: PRODUCTS/SERVICES/ SOLUTIONS OFFERED
  • TABLE 265 INTUITIVE SURGICAL OPERATIONS, INC.: DEALS
  • TABLE 266 INTUITIVE SURGICAL OPERATIONS, INC.: OTHER DEVELOPMENTS
  • TABLE 267 DJI: COMPANY OVERVIEW
  • TABLE 268 DJI: PRODUCTS/SERVICES/SOLUTIONS OFFERED
  • TABLE 269 DJI: PRODUCT LAUNCHES
  • TABLE 270 DAIFUKU CO., LTD.: COMPANY OVERVIEW
  • TABLE 271 DAIFUKU CO., LTD.: PRODUCTS/SERVICES/SOLUTIONS OFFERED
  • TABLE 272 DAIFUKU CO., LTD.: DEALS
  • TABLE 273 DAIFUKU CO., LTD.: EXPANSIONS
  • TABLE 274 JD.COM, INC.: COMPANY OVERVIEW
  • TABLE 275 JD.COM, INC.: PRODUCTS/SERVICES/SOLUTIONS OFFERED
  • TABLE 276 JD.COM, INC.: PRODUCT LAUNCHES
  • TABLE 277 IROBOT CORPORATION: COMPANY OVERVIEW
  • TABLE 278 IROBOT CORPORATION: PRODUCTS/SERVICES/SOLUTIONS OFFERED
  • TABLE 279 IROBOT CORPORATION: PRODUCT LAUNCHES
  • TABLE 280 IROBOT CORPORATION: DEALS
  • TABLE 281 SAMSUNG ELECTRONICS CO., LTD.: COMPANY OVERVIEW
  • TABLE 282 SAMSUNG ELECTRONICS CO., LTD.: PRODUCTS/SERVICES/SOLUTIONS OFFERED
  • TABLE 283 SAMSUNG ELECTRONICS CO., LTD.: PRODUCT LAUNCHES
  • TABLE 284 SAMSUNG ELECTRONICS CO., LTD.: DEALS
  • TABLE 285 KONGSBERG: COMPANY OVERVIEW
  • TABLE 286 KONGSBERG: PRODUCTS/SERVICES/SOLUTIONS OFFERED
  • TABLE 287 KONGSBERG: PRODUCT LAUNCHES
  • TABLE 288 KONGSBERG: DEALS
  • TABLE 289 KONGSBERG: OTHER DEVELOPMENTS
  • TABLE 290 NORTHROP GRUMMAN: COMPANY OVERVIEW
  • TABLE 291 NORTHROP GRUMMAN: PRODUCTS/SERVICES/SOLUTIONS OFFERED
  • TABLE 292 SOFTBANK ROBOTICS GROUP: COMPANY OVERVIEW
  • TABLE 293 SOFTBANK ROBOTICS GROUP: PRODUCTS/SERVICES/SOLUTIONS OFFERED
  • TABLE 294 SOFTBANK ROBOTICS GROUP: DEALS
  • TABLE 295 DELAVAL: COMPANY OVERVIEW
  • TABLE 296 DELAVAL: PRODUCTS/SERVICES/SOLUTIONS OFFERED
  • TABLE 297 DELAVAL: PRODUCT LAUNCHES
  • TABLE 298 KUKA AG: COMPANY OVERVIEW
  • TABLE 299 STRYKER: COMPANY OVERVIEW
  • TABLE 300 NEATO ROBOTICS, INC.: COMPANY OVERVIEW
  • TABLE 301 GENERAL ELECTRIC COMPANY: COMPANY OVERVIEW
  • TABLE 302 LG ELECTRONICS: COMPANY OVERVIEW
  • TABLE 303 HARVEST CROO ROBOTICS LLC: COMPANY OVERVIEW
  • TABLE 304 STARSHIP TECHNOLOGIES: COMPANY OVERVIEW
  • TABLE 305 3DR, INC.: COMPANY OVERVIEW
  • TABLE 306 LELY: COMPANY OVERVIEW
  • TABLE 307 DILIGENT ROBOTICS INC.: COMPANY OVERVIEW
  • TABLE 308 AMP ROBOTICS: COMPANY OVERVIEW
  • TABLE 309 BLUE OCEAN ROBOTICS: COMPANY OVERVIEW
  • TABLE 310 XAG CO., LTD.: COMPANY OVERVIEW
  • TABLE 311 EXYN TECHNOLOGIES: COMPANY OVERVIEW
  • TABLE 312 ROBOTIS CO., LTD.: COMPANY OVERVIEW
LIST OF FIGURES
 
  • FIGURE 1 SERVICE ROBOTICS MARKET SEGMENTATION
  • FIGURE 2 MARKET: RESEARCH DESIGN
  • FIGURE 3 MARKET: RESEARCH FLOW
  • FIGURE 4 MARKET: BOTTOM-UP APPROACH
  • FIGURE 5 MARKET SIZE ESTIMATION METHODOLOGY (SUPPLY SIDE)
  • FIGURE 6 MARKET: TOP-DOWN APPROACH
  • FIGURE 7 MARKET: DATA TRIANGULATION
  • FIGURE 8 GROUND SEGMENT TO DOMINATE SERVICE ROBOTICS MARKET DURING FORECAST PERIOD
  • FIGURE 9 PERSONAL & DOMESTIC SEGMENT TO REGISTER HIGHER CAGR IN MARKET FROM 2024 TO 2029
  • FIGURE 10 SOFTWARE SEGMENT TO EXHIBIT HIGHER CAGR IN MARKET BETWEEN 2024 AND 2029
  • FIGURE 11 MEDICAL SEGMENT TO CAPTURE LARGEST SHARE OF MARKET IN 2024
  • FIGURE 12 NORTH AMERICA ACCOUNTED FOR LARGEST MARKET SHARE IN 2023
  • FIGURE 13 INCREASING GOVERNMENT-LED FUNDING FOR RESEARCH ON ROBOTS TO DRIVE MARKET
  • FIGURE 14 GROUND SEGMENT TO HOLD LARGEST SHARE OF SERVICE ROBOTICS MARKET IN 2029
  • FIGURE 15 GROUND SEGMENT AND US TO CAPTURE LARGEST SHARES OF MARKET IN NORTH AMERICA IN 2024
  • FIGURE 16 MEDICAL SEGMENT TO HOLD LARGEST SHARE OF MARKET IN 2024
  • FIGURE 17 CANADA TO RECORD HIGHEST CAGR IN GLOBAL MARKET FROM 2024 TO 2029
  • FIGURE 18 DRIVERS, RESTRAINTS, OPPORTUNITIES, AND CHALLENGES
  • FIGURE 19 IMPACT ANALYSIS: DRIVERS
  • FIGURE 20 IMPACT ANALYSIS: RESTRAINTS
  • FIGURE 21 IMPACT ANALYSIS: OPPORTUNITIES
  • FIGURE 22 IMPACT ANALYSIS: CHALLENGES
  • FIGURE 23 TRENDS/DISRUPTIONS IMPACTING CUSTOMER BUSINESS
  • FIGURE 24 VALUE CHAIN ANALYSIS
  • FIGURE 25 SERVICE ROBOTICS ECOSYSTEM
  • FIGURE 26 INVESTMENT AND FUNDING SCENARIO, 2020–2023
  • FIGURE 27 IMPACT OF GEN AI/AI ON SERVICE ROBOTICS MARKET
  • FIGURE 28 PATENTS APPLIED AND GRANTED, 2014–2023
  • FIGURE 29 IMPORT DATA FOR HS CODE 850860-COMPLIANT PRODUCTS FOR TOP 5 COUNTRIES, 2019–2023
  • FIGURE 30 EXPORT DATA FOR HS CODE 850860-COMPLIANT PRODUCTS FOR TOP 5 COUNTRIES, 2019–2023
  • FIGURE 31 PORTER’S FIVE FORCES ANALYSIS
  • FIGURE 32 INFLUENCE OF STAKEHOLDERS ON BUYING PROCESS FOR TOP THREE APPLICATIONS
  • FIGURE 33 KEY BUYING CRITERIA FOR TOP THREE APPLICATIONS
  • FIGURE 34 GROUND SEGMENT TO REGISTER HIGHEST CAGR DURING FORECAST PERIOD
  • FIGURE 35 PERSONAL & DOMESTIC SEGMENT TO EXHIBIT HIGHER CAGR BETWEEN 2024 AND 2029
  • FIGURE 36 SOFTWARE SEGMENT TO EXHIBIT HIGHER CAGR FROM 2024 TO 2029
  • FIGURE 37 MEDICAL SEGMENT TO DOMINATE SERVICE ROBOTICS MARKET DURING FORECAST PERIOD
  • FIGURE 38 ASIA PACIFIC TO RECORD HIGHEST CAGR IN MARKET BETWEEN 2024 AND 2029
  • FIGURE 39 NORTH AMERICA: SERVICE ROBOTICS MARKET SNAPSHOT
  • FIGURE 40 ASIA PACIFIC: MARKET SNAPSHOT
  • FIGURE 41 EUROPE: MARKET SNAPSHOT
  • FIGURE 42 MARKET: REVENUE ANALYSIS OF FOUR KEY PLAYERS, 2021–2023
  • FIGURE 43 MARKET SHARE ANALYSIS OF COMPANIES OFFERING SERVICE ROBOTICS, 2023
  • FIGURE 44 COMPANY VALUATION, 2024
  • FIGURE 45 FINANCIAL METRICS (EV/EBITDA), 2024
  • FIGURE 46 SERVICE ROBOTICS MARKET: PRODUCT COMPARISON
  • FIGURE 47 MARKET: COMPANY EVALUATION MATRIX (KEY PLAYERS), 2023
  • FIGURE 48 MARKET: COMPANY FOOTPRINT
  • FIGURE 49 MARKET: COMPANY EVALUATION MATRIX (STARTUPS/SMES), 2023
  • FIGURE 50 INTUITIVE SURGICAL OPERATIONS, INC.: COMPANY SNAPSHOT
  • FIGURE 51 DAIFUKU CO., LTD.: COMPANY SNAPSHOT
  • FIGURE 52 JD.COM, INC.: COMPANY SNAPSHOT
  • FIGURE 53 IROBOT CORPORATION: COMPANY SNAPSHOT
  • FIGURE 54 SAMSUNG ELECTRONICS CO., LTD.: COMPANY SNAPSHOT
  • FIGURE 55 KONGSBERG: COMPANY SNAPSHOT
  • FIGURE 56 NORTHROP GRUMMAN: COMPANY SNAPSHOT


The study involved four major activities in estimating the current size of the service robotics market —exhaustive secondary research collected information on the market and its peer and parent markets. The next step was to validate these findings, assumptions, and sizing with industry experts across the value chain through primary research. Both top-down and bottom-up approaches were employed to estimate the total market size. After that, market breakdown and data triangulation were used to estimate the market size of segments and subsegments.

Secondary Research

Various secondary sources have been referred to in the secondary research process for identifying and collecting information important for this study. These secondary sources include service robotics technology journals and magazines, annual reports, press releases, investor presentations of companies, white papers, certified publications and articles from recognized authors, and directories and databases such as Factiva, Hoovers, and OneSource.

Primary Research

Various primary sources from both supply and demand sides have been interviewed in the primary research process to obtain qualitative and quantitative information important for this report. The primary sources from the supply side included industry experts such as CEOs, VPs, marketing directors, technology and innovation directors, and related executives from key companies and organizations operating in the service robotics market. After complete market engineering (including calculations regarding market statistics, market breakdown, market size estimations, market forecasting, and data triangulation), extensive primary research was conducted to gather information as well as to verify and validate the critical numbers arrived at.

Service Robotics Market Size, and Share

Note: Other designations include sales, marketing, and product managers. Tier 1 = USD 1 billion, Tier 2 = USD 0.5–1.0 billion, and Tier 3 = USD 0.5 billion.

To know about the assumptions considered for the study, download the pdf brochure

Market Size Estimation

In the complete market engineering process, both top-down and bottom-up approaches have been implemented, along with several data triangulation methods, to estimate and validate the size of the service robotics market and other dependent submarkets listed in this report.

  • Extensive secondary research has identified key players in the industry and market.
  • In terms of value, the industry’s supply chain and market size have been determined through primary and secondary research processes.  
  • All percentage shares, splits, and breakdowns have been determined using secondary sources and verified through primary sources.

Service Robotics Market : Top-Down and Bottom-Up Approach

Service Robotics Market Top Down and Bottom Up Approach

Data Triangulation

After arriving at the overall market size from the estimation process explained above, the global market has been split into several segments and subsegments. Market breakdown and data triangulation procedures have been employed wherever applicable to complete the overall market engineering process and arrive at exact statistics for all segments and subsegments. The data has been triangulated by studying various factors and trends identified from both the demand and supply sides.

Market Definition

A service robot operates with partial assistance or full autonomy to perform services for the well-being of humans or equipment, excluding manufacturing operations. A service robot used for noncommercial tasks is called a personal/domestic robot. This includes robotic vacuum cleaners and elderly assistance robots. A service robot used for commercial tasks and usually operated by a properly trained operator is called a professional robot. This includes surgical robots and automated guided vehicles (AGVs). The scope of the report also includes drones (commercial and consumer) and marine robots [remotely operated vehicles (ROVs), autonomous underwater vehicles (AUVs), and unmanned surface vehicles (USVs)].

Key Stakeholders

  • Original equipment manufacturers (OEMs)
  • OEM technology solution providers
  • Research institutes
  • Market research and consulting firms
  • Forums, alliances, and associations
  • Technology investors
  • Governments and financial institutions
  • Analysts and strategic business planners
  • Existing and prospective end users

Report Objectives

The following are the primary objectives of the study.

  • To forecast the size of the service robotics market, by environment, type, component, application, and region, in terms of value
  • To define, describe, and forecast the service robotics market size, by type, in terms of volume
  • To describe and forecast the market for various segments across four main regions: North America, Asia Pacific, Europe, and the Rest of the World (RoW), in terms of value
  • To provide detailed information regarding the drivers, restraints, opportunities, and challenges influencing the growth of the service robotics market
  • To study the complete value chain and related industry segments and conduct a value chain analysis of the service robotics market landscape
  • To strategically analyze the ecosystem, regulatory landscape, patent landscape, Porter’s Five Forces, import and export scenarios, Gen AI/AI impact, macroeconomic outlook, and case studies pertaining to the market under study
  • To strategically analyze micromarkets1 with respect to individual growth trends, prospects, and their contributions to the overall market
  • To analyze opportunities for stakeholders by identifying high-growth segments in the market
  • To strategically profile the key players and provide a detailed competitive landscape of the service robotics market
  • To analyze strategic approaches adopted by leading players in the market, including product launches/developments, mergers, expansions, contracts, and acquisitions

Available Customizations

With the given market data, MarketsandMarkets offers customizations according to a company’s specific needs. The following customization options are available for the report:

Company Information:

  • Detailed analysis and profiling of additional market players (up to 5)
 

Previous Versions of this Report

Service Robotics Market by Environment (Aerial, Ground, Marine), Type (Professional, Personal & Domestic), Component, Application (Logistics, Inspection & Maintenance, Public Relations, Education) and Region - Global Forecast to 2028

Report Code SE 2714
Published in Mar, 2023, By MarketsandMarkets™

Service Robotics Market with COVID-19 Impact Analysis, by Environment, Type (Professional, Personal & Domestic), Component, Application (Logistics, Inspection & Maintenance, Public Relations, Education, Personal), and Geography - Global Forecast to 2026

Report Code SE 2714
Published in Aug, 2021, By MarketsandMarkets™

Service Robotics Market by Environment, Type (Professional and Personal & Domestic), Component, Application (Logistics, Inspection & Maintenance, Public Relations, Marine, Entertainment, Education, & Personal), and Geography - Global Forecast to 2025

Report Code SE 2714
Published in Mar, 2020, By MarketsandMarkets™

Service Robotics Market by Operating Environment (Aerial, Ground, Marine), Application (Professional, Personal), and Geography (North America, Europe, Asia-Pacific, and Row) - Global Forecast to 2022

Report Code SE 2714
Published in Dec, 2016, By MarketsandMarkets™

Service Robotics Market by Type (Ground, Aerial, Underwater), by Component (Software, Hardware), by Application (Professional, Personal) and by Geography (North America, Europe, Asia-Pacific, and RoW) - Analysis & Forecast to 2020

Report Code SE 2714
Published in Dec, 2015, By MarketsandMarkets™

Service Robotics Market (Professional and Personal), by Application (Defense, Agriculture, Medical, Domestic & Entertainment), & by Geography - Analysis Forecast (2014 - 2020)

Report Code SE 2714
Published in Sep, 2014, By MarketsandMarkets™

Service Robotics Market (Professional and Personal), by Application (Defense, Agriculture, Medical, Domestic & Entertainment), & by Geography - Analysis Forecast (2014 - 2020)

Report Code SE 2714
Published in Jul, 2012, By MarketsandMarkets™

Service Robotics Market (Professional and Personal), by Application (Defense, Agriculture, Medical, Domestic & Entertainment), & by Geography - Analysis Forecast (2014 - 2020)

Report Code SE 2714
Published in Apr, 2010, By MarketsandMarkets™

Custom Market Research Services

We Will Customise The Research For You, In Case The Report Listed Above Does Not Meet With Your Requirements

Get 10% Free Customisation

Growth opportunities and latent adjacency in Service Robotics Market

Renate

Oct, 2014

Interested in market size of defense service robots and also home service robots with information related to competitors and market projections..

Harrison

Jun, 2015

Interested in office and enterprise robotic applications, telepresence robots, trend toward robot vendors having SDKs..

Raphael

Jan, 2017

Hi, Is it possible to purchase only market for logistics? Do you have market reports on software, integration services, and operational services for logistics robots with, e.g., warehouse execution systems? .

Andrew

Sep, 2016

Please send me some sample info that I can use to get a client to buy the full report OR come back with a custom request. .

Harrison

Aug, 2016

In extrapolating the market growth, was the assumption that the market will be composed of unique robot hardware plus software applications? Or, did you consider a paradigm shift that would occur with a cloud-connected standard robot platform plus a robust 3rd party developer program based on an SDK and API by which software entrepreneurs can enter the market?.

Ruben

Aug, 2014

Interested on finding out how much semiconductor content, market potential per technology is present in the consumer or service robotics market..

Rory

Jul, 2015

I am specifically interested in the breakdown of the service robotics market by component and application..

Di

May, 2019

we want to understand the competitive landscape of the service robot market, and who are the leading players. Moreover, whether their products and techniques can be effectively used under the scenario of living community or workplace in china..

Yee

May, 2017

Hi, we are interested in the report and require additional information for existing report. We will communicate our requirements to you via email..

Show More
DMCA.com Protection Status