Specialty PACS Market by Type (Radiology, Orthopedics, Oncology, Pathology, Endoscopy, Women's Health), Deployment Model (On premise, Cloud), Component (Software, Service), End User (Hospital, Clinic, Diagnostic Centers, Research) - Global Forecasts to 2024


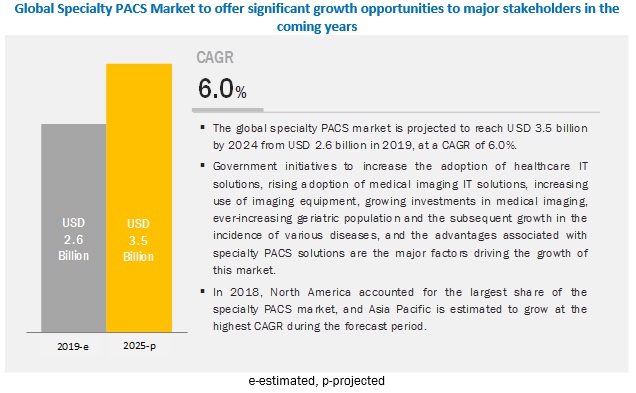
The global specialty PACS market size is projected to reach USD 3.5 billion in 2024, at a CAGR of 6.0%. The growth in this market is driven mainly by the increasing geriatric population and subsequent growth in the incidence of various diseases, advantages associated with specialty PACS, government initiatives to increase the adoption of healthcare IT solutions, growing investments in medical imaging, rising adoption of medical imaging IT solutions, and increasing use of imaging equipment. On the other hand, budgetary constraints are expected to limit market growth during the forecast period.
Helped a top global diagnostic imaging leader in identifying ~ USD 200 million worth of additional revenue opportunities by tapping into AI in healthcare & pathology, ophthalmology specialty/departmental PACS solutions.
Client�s Problem Statement
Our client, a top global diagnostic imaging leader, was keen to build a business from specialty/departmental PACS solutions globally and specific to Asia & North Africa. The senior management needed to decide on which specialty PACS to focus on, which countries in North Africa and globally to prioritize.
MnM Approach
MnM started by identifying key disruptive technology trends that were changing the revenue mix of our client�s clients in end-use industries such as hospitals, diagnostic labs. MnM also interviewed a host of potential customers in these end-use industries to understand their unmet needs, possible use cases, benefits from these medical image management technologies, and what they looked for in a technology partner.
GE Healthcare (manufacturer and distributor of diagnostic imaging products, solutions, and services) was looking to develop a commercialization strategy for departmental/specialty PACS solutions. They were looking to gain a significant market share in a USD 2.5 billion global specialty PACS solutions market. Based on in-depth due diligence and research, MnM recommended that there was insignificant potential for the technology as small and growing healthcare organizations are adopting departmental/specialty PACS.
Revenue Impact (RI)
Helped a top global diagnostic imaging leader in identifying ~ USD 200 million worth of additional revenue opportunities by tapping into AI in healthcare & pathology, ophthalmology specialty/departmental PACS solutions..
The ophthalmology PACS segment is expected to grow at the highest CAGR during the forecast period
Based on the type, the specialty PACS market is segmented into radiology PACS, cardiology PACS, pathology PACS, ophthalmology PACS, orthopedics PACS, oncology PACS, dermatology PACS, neurology PACS, endoscopy PACS, women�s health PACS, and other specialty PACS. The radiology PACS segment accounted for the largest share of the market in 2018; however, the ophthalmology PACS segment is expected to register the highest CAGR of during the forecast period. The increasing prevalence of eye diseases and disorders, the growing number of ophthalmic surgeries performed, and technological advancements in ophthalmology devices are some of the factors driving the growth of this segment.
The on-premise model segment accounted for the largest share of the specialty PACS market in 2018
Based on the deployment model, the market is segmented into on-premise and web/cloud-based specialty PACS. The on-premise segment is expected to account for the largest share of the market. This can be attributed to the easily customizable nature of on-premise solutions, as compared to web/cloud-based specialty PACS.
The hospital segment accounted for the largest share in 2018 and is expected to be the fastest-growing end-user of the specialty PACS market
Based on the end-user, the medical market is segmented into hospitals, ambulatory surgery centers (ASCs) & clinics, diagnostic imaging centers, and other end-users. The rising patient population, growing awareness about the benefits of early disease diagnosis, technological advancements in imaging modalities, increasing digitization of patient data, and rapid growth in EMR adoption are some significant factors responsible for the large share and fastest growth of this segment during the forecast period.
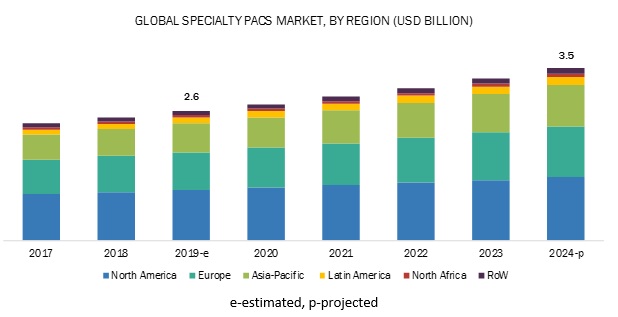
North America dominated the market in 2018
In 2018, North America commanded the largest share of the market due to factors such as increasing medical imaging volumes and several diagnostic imaging centers, growing geriatric population, and the fast adoption of technologically advanced imaging systems. However, Asia Pacific is expected to grow at the highest CAGR during the forecast period. Factors such the increasing incidence of chronic diseases, rising awareness on the benefits of early disease diagnosis, and growing adoption of imaging modalities are some of the factors driving the growth of market in this region.
Key Players in the Global Specialty PACS Market
IBM Corporation (Merge Healthcare Incorporated) (US), McKesson Corporation (US), Agfa Healthcare (Belgium), Carestream Health (a part of Onex Corporation) (Canada), Philips Healthcare (Netherlands), Sectra AB (Sweden), Siemens Healthineers (Germany), Novarad (US), INFINITT North America (US), Intelerad Medical Systems (Canada), Topcon Corporation (Japan), Sonomed Escalon (US), Canon USA, Inc. (US) (a subsidiary of Canon Inc.), Visbion (UK), and EyePACS, LLC (US).
IBM Corporation (Merge Healthcare Incorporated)
Merge Healthcare is one of the leading providers of innovative solutions for specialty PACS. The company�s leading position can be attributed to its robust product portfolio of technologically advanced and innovative software products, strong geographical presence, expertise in specialty PACS solutions, and continued focus on research & development activities. The strategy of effectively utilizing R&D activities and its global onshore-offshore engineering services has enabled the company to expand and accelerate the innovation of new products and enter new markets. The company regularly participates in relevant conferences, exhibitions, seminars, trade fairs, and other related events to strengthen and widen its brand recognition. The company also pursues the strategy of partnerships, collaborations, and acquisitions. Merge entered into a partnership with several medical providers and imaging technology companies in June 2016. This is a benchmark event for the company�s imaging technologies business.
Scope of the Report
|
Report Metric |
Details |
|
Market size available for years |
2017�2024 |
|
Base year considered |
2018 |
|
Forecast period |
2019�2024 |
|
Forecast units |
Value (USD) |
|
Segments covered |
Type, Component, Deployment Model, End-User, and Region |
|
Geographies covered |
North America (US and Canada), Europe (Germany, UK, France, and Rest of Europe), Asia Pacific (China, India, and Rest of Asia Pacific), Latin America, North Africa, and the Rest of the World (RoW) |
|
Companies covered |
IBM Corporation (Merge Healthcare Incorporated) (US), McKesson Corporation (US), Agfa Healthcare (Belgium), Carestream Health (a part of Onex Corporation) (Canada), Philips Healthcare (Netherlands), Sectra AB (Sweden), Siemens Healthineers (Germany), Novarad (US), INFINITT North America (US), Intelerad Medical Systems (Canada), Topcon Corporation (Japan), Sonomed Escalon (US), Canon USA, Inc. (US) (a subsidiary of Canon Inc.), Visbion (UK), and EyePACS, LLC (US). |
The research report categorizes the market into the following segments and subsegments:
By Type
- Radiology PACS
- Cardiology PACS
- Pathology PACS
- Ophthalmology PACS
- Orthopedics PACS
- Oncology PACS
- Dermatology PACS
- Neurology PACS
- Endoscopy PACS
- Women�s health PACS
- Other specialty PACS
By Component
- Hardware
- Software
- Services
By Deployment Model
- On-premise specialty PACS
- Web/Cloud-based specialty PACS
By End-User
- Hospitals
- Ambulatory Surgery Centers & Clinics
- Diagnostic Imaging Centers
- Other End Users
By Region
- North America
- US
- Canada
- Europe
- Germany
- France
- UK
- Rest of Europe (RoE)
- Asia Pacific
- China
- India
- Rest of Asia Pacific (ROAPAC)
- Latin America
- North Africa
- RoW
Recent Developments
- In April 2019, Sectra and Deventer Hospital (Netherlands) signed a contract to install Sectra�s PACS solutions across the radiology and nuclear medicine departments at the Deventer Hospital.
- In February 2019, Agfa HealthCare and Noordwest Ziekenhuisgroep (Netherlands) entered into a collaboration, to optimize patient care by implementing Agfa�s enterprise imaging solutions
- In February 2018, Change Healthcare signed a contract with the United States Defense Logistics Agency, to provide more than 3,000 installations of enterprise imaging solutions, including diagnostic imaging and workflow products, picture archiving and communication systems (PACS), radiology solutions, and cardiovascular imaging systems.
- In February 2017, the company expanded its capabilities for the Watson Platform for Health Cloud and a specialized Watson Health Consulting Services at the Healthcare Information and Management Systems Society (HIMSS) Annual Conference & Exhibition.
Key Questions Addressed by the Report
- Where will all these developments take the industry in the mid to long-term?
- What types of annual and multi-year partnerships are specialty PACS companies exploring?
- Which are the key players in the market and how intense is the competition?
- Which are the recent contracts and agreements key players have signed?
- What are the recent trends affecting specialty PACS solutions providers?
To speak to our analyst for a discussion on the above findings, click Speak to Analyst
 Exclusive indicates content/data unique to MarketsandMarkets and not available with any competitors.
Table of Contents
1 Introduction
1.1 Objectives of the Study
1.2 Market Definition
1.3 Market Scope
1.3.1 Markets Covered
1.3.2 Geographic Scope
1.3.3 Years Considered for the Study
1.4 Stakeholders
1.5 Market Study Scope
1.6 Limitations
2 Research Methodology
2.1 Research Data
2.1.1 Secondary Sources
2.1.1.1 Key Data From Secondary Sources
2.1.2 Primary Sources
2.1.2.1 Key Data From Primary Sources
2.2 Market Size Estimation
2.3 Market Breakdown and Data Triangulation
2.4 Market Share Estimation
2.5 Research Assumptions
3 Executive Summary
4 Premium Insights
4.1 Key Drivers in the Specialty PACS Market
4.2 Specialty PACS Market, By End User and Region, 2019
4.3 Specialty PACS Market, By Region
5 Market Overview
5.1 Introduction
5.2 Market Dynamics
5.2.1 Drivers
5.2.1.1 Growing Government Initiatives to Increase the Adoption of Healthcare It Solutions
5.2.1.2 Growing Investments in Medical Imaging
5.2.1.3 Growing Adoption of Medical Imaging It Solutions
5.2.1.4 Increasing Use of Imaging Equipment
5.2.1.5 Increasing Geriatric Population and the Subsequent Growth in the Incidence of Various Diseases
5.2.1.6 Advantages Associated With Specialty PACS
5.2.2 Restraints
5.2.2.1 Budgetary
5.2.3 Opportunities
5.2.3.1 Integration of Artificial Intelligence With Specialty PACS Solutions
5.2.3.2 Growth Opportunities Offered By Cloud-Based Specialty PACS Solutions
5.2.3.3 Integration of PACS With Emr
5.2.3.4 Blockchain for Medical Imaging
5.2.4 Industry Insights
6 Specialty PACS Market, By Type
6.1 Introduction
6.2 Radiology PACS
6.3 Cardiology PACS
6.4 Pathology PACS
6.5 Opthalmology PACS
6.6 Orthopedics PACS
6.7 Women�s Health PACS
6.8 Dermatology PACS
6.9 Neurology PACS
6.10 Endoscopy PACS
6.11 Oncology PACS
6.12 Other Specialty PACS
7 Specialty PACS Market, By Component
7.1 Introduction
7.2 Software
7.3 Services
7.4 Hardware
8 Specialty PACS Market, By Deployment Model
8.1 Introduction
8.2 On-Premise Specialty PACS
8.3 Web/Cloud-Based Specialty PACS
9 Specialty PACS Market, By End User
9.1 Introduction
9.2 Hospitals
9.3 Ambulatory Surgery Centers & Clinics
9.4 Diagnostic Imaging Centers
9.5 Other End Users
10 Specialty PACS Market, By Region
10.1 Introduction
10.2 North America
10.2.1 US
10.2.2 Canada
10.3 Europe
10.3.1 Germany
10.3.2 UK
10.3.3 France
10.3.4 RoE
10.4 Asia-Pacific
10.4.1 China
10.4.2 India
10.4.3 Rest of APAC
10.5 Latin America
10.6 North Africa
10.5 RoW
11 Competitive Landscape
11.1 Overview
11.2 Market Player Ranking
11.3 Competitive Scenario
11.4 Recent Developments
11.4.1 New Product Launches
11.4.2 Agreements, Partnerships, and Contracts
11.4.3 Expansions
11.4.4 Acquisitions
12 Company Profiles
(Business Overview, Products Offered, Recent Developments, MnM View)*
12.1 IBM Corporation (Merge Healthcare Incorporated)
12.2 Mckesson Corporation
12.3 Agfa Healthcare
12.4 Carestream Health
12.5 Philips Healthcare
12.6 Sectra AB
12.7 Siemens Healthineers
12.8 Novarad Corporation
12.9 Infinitt North America
12.10 Intelerad Medical Systems Incorporated
12.11 Topcon Corporation
12.12 Sonomed Escalon
12.13 Canon Usa, Inc.
12.14 Visbion
12.15 Eyepacs, LLC
*Business Overview, Products Offered, Recent Developments, MnM View Might Not Be Captured in Case of Unlisted Companies.
13 Appendix
13.1 Discussion Guide
13.2 Knowledge Store: Marketsandmarkets� Subscription Portal
13.3 Related Reports
List of Tables (148 Tables)
Table 1 Specialty PACS Market, By Type, 2017�2024 (USD Million)
Table 2 Radiology PACS Market, By Region, 2017�2024 (USD Million)
Table 3 North America: Radiology PACS Market, By Country, 2017�2024 (USD Million)
Table 4 Asia Pacific: Radiology PACS Market, By Country, 2017�2024 (USD Million)
Table 5 Europe: Radiology Specialty PACS Market, By Country, 2017�2024 (USD Million)
Table 6 Cardiology PACS Market, By Region, 2017�2024 (USD Million)
Table 7 North America: Cardiology PACS Market, By Country, 2017�2024 (USD Million)
Table 8 Asia Pacific: Cardiology PACS Market, By Country, 2017�2024 (USD Million)
Table 9 Europe: Cardiology Specialty PACS Market, By Country, 2017�2024 (USD Million)
Table 10 Pathology PACS Market, By Region, 2017�2024 (USD Million)
Table 11 North America: Pathology PACS Market, By Country, 2017�2024 (USD Million)
Table 12 Asia Pacific: Pathology PACS Market, By Country, 2017�2024 (USD Million)
Table 13 Europe: Pathology PACS Market, By Country, 2017�2024 (USD Million)
Table 14 Ophthalmology PACS Market, By Region, 2017�2024 (USD Million)
Table 15 North America: Ophthalmology PACS Market, By Country, 2017�2024 (USD Million)
Table 16 Asia Pacific: Ophthalmology PACS Market, By Country, 2017�2024 (USD Million)
Table 17 Europe: Ophthalmology PACS Market, By Country, 2017�2024 (USD Million)
Table 18 Orthopedics PACS Market, By Region, 2017�2024 (USD Million)
Table 19 North America: Orthopedics PACS Market, By Country, 2017�2024 (USD Million)
Table 20 Asia Pacific: Orthopedics PACS Market, By Country, 2017�2024 (USD Million)
Table 21 Europe: Orthopedics PACS Market, By Country, 2017�2024 (USD Million)
Table 22 Women�s Health PACS Market, By Region, 2017�2024 (USD Million)
Table 23 North America: Women�s Health PACS Market, By Country, 2017�2024 (USD Million)
Table 24 Asia Pacific: Women�s Health PACS Market, By Country, 2017�2024 (USD Million)
Table 25 Europe: Women�s Health PACS Market, By Country, 2017�2024 (USD Million)
Table 26 Dermatology PACS Market, By Region, 2017�2024 (USD Thousand)
Table 27 North America: Dermatology PACS Market, By Country, 2017�2024 (USD Million)
Table 28 Asia Pacific: Dermatology PACS Market, By Country, 2017�2024 (USD Thousand)
Table 29 Europe: Dermatology PACS Market, By Country, 2017�2024 (USD Thousand)
Table 30 Neurology PACS Market, By Region, 2017�2024 (USD Thousand)
Table 31 North America: Neurology PACS Market, By Country, 2017�2024 (USD Thousand)
Table 32 Asia Pacific: Neurology PACS Market, By Country, 2017�2024 (USD Thousand)
Table 33 Europe: Neurology PACS Market, By Country, 2017�2024 (USD Thousand)
Table 34 Endoscopy PACS Market, By Region, 2017�2024 (USD Thousand)
Table 35 North America: Endoscopy PACS Market, By Country, 2017�2024 (USD Thousand)
Table 36 Asia Pacific: Endoscopy PACS Market, By Country, 2017�2024 (USD Thousand)
Table 37 Europe: Endoscopy PACS Market, By Country, 2017�2024 (USD Thousand)
Table 38 Oncology PACS Market, By Region, 2017�2024 (USD Thousand)
Table 39 North America: Oncology PACS Market, By Country, 2017�2024 (USD Thousand)
Table 40 Asia Pacific: Oncology PACS Market, By Country, 2017�2024 (USD Thousand)
Table 41 Europe: Oncology PACS Market, By Country, 2017�2024 (USD Thousand)
Table 42 Other Specialty PACS Market, By Region, 2017�2024 (USD Thousand)
Table 43 North America: Other Specialty PACS Market, By Country, 2017�2024 (USD Thousand)
Table 44 Asia Pacific: Other Specialty PACS Market, By Country, 2017�2024 (USD Thousand)
Table 45 Europe: Other Specialty PACS Market, By Country, 2017�2024 (USD Thousand)
Table 46 Specialty PACS Market, By Component, 2017�2024 (USD Million)
Table 47 Specialty PACS Software Market, By Region, 2017�2024 (USD Million)
Table 48 North America: Specialty PACS Software Market, By Country, 2017�2024 (USD Million)
Table 49 Asia Pacific: Specialty PACS Software Market, By Country, 2017�2024 (USD Million)
Table 50 Europe: Specialty PACS Software Market, By Country, 2017�2024 (USD Million)
Table 51 Specialty PACS Services Market, By Region, 2017�2024 (USD Million)
Table 52 North America: Specialty PACS Services Market, By Country, 2017�2024 (USD Million)
Table 53 Asia Pacific: Specialty PACS Services Market, By Country, 2017�2024 (USD Million)
Table 54 Europe: Specialty PACS Services Market, By Country, 2017�2024 (USD Million)
Table 55 Specialty PACS Hardware Market, By Region, 2017�2024 (USD Million)
Table 56 North America: Specialty PACS Hardware Market, By Country, 2017�2024 (USD Million)
Table 57 Asia Pacific: Specialty PACS Hardware Market, By Country, 2017�2024 (USD Million)
Table 58 Europe: Specialty PACS Hardware Market, By Country, 2017�2024 (USD Million)
Table 59 Specialty PACS Market, By Deployment Model, 2017�2024 (USD Million)
Table 60 On-Premise Specialty PACS Market, By Region, 2017�2024 (USD Million)
Table 61 North America: On-Premise Specialty PACS Market, By Country, 2017�2024 (USD Million)
Table 62 Asia Pacific: On-Premise Specialty PACS Market, By Country, 2017�2024 (USD Million)
Table 63 Europe: On-Premise Specialty PACS Market, By Country, 2017�2024 (USD Million)
Table 64 Web/Cloud-Based Specialty PACS Market, By Region, 2017�2024 (USD Million)
Table 65 North America: Web/Cloud-Based Specialty PACS Market, By Country, 2017�2024 (USD Million)
Table 66 Asia Pacific: Web/Cloud-Based Specialty PACS Market, By Country, 2017�2024 (USD Million)
Table 67 Europe: On-Premise Specialty PACS Market, By Country, 2017�2024 (USD Million)
Table 68 Specialty PACS Market, By End User, 2017�2024 (USD Million)
Table 69 Specialty PACS Market for Hospitals, By Region, 2017�2024 (USD Million)
Table 70 North America: Specialty PACS Market for Hospitals, By Country, 2017�2024 (USD Million)
Table 71 Asia Pacific: Specialty PACS Market for Hospitals, By Country, 2017�2024 (USD Million)
Table 72 Europe: Specialty PACS Market for Hospitals, By Country, 2017�2024 (USD Million)
Table 73 Specialty PACS Market for Ascs & Clinics, By Region, 2017�2024 (USD Million)
Table 74 North America: Specialty PACS Market for Ascs & Clinics, By Country, 2017�2024 (USD Million)
Table 75 Asia Pacific: Specialty PACS Market for Ascs & Clinics, By Country, 2017�2024 (USD Million)
Table 76 Europe: Specialty PACS Market for Ascs & Clinics, By Country, 2017�2024 (USD Million)
Table 77 Specialty PACS Market for Diagnostic Imaging Centers, By Region, 2017�2024 (USD Million)
Table 78 North America: Specialty PACS Market for Diagnostic Imaging Centers, By Country, 2017�2024 (USD Million)
Table 79 Asia Pacific: Specialty PACS Market for Diagnostic Imaging Centers, By Country, 2017�2024 (USD Million)
Table 80 Europe: Specialty PACS Market for Diagnostic Imaging Centers, By Country, 2017�2024 (USD Million)
Table 81 Specialty PACS Market for Other End Users, By Region, 2017�2024 (USD Million)
Table 82 North America: Specialty PACS Market for Other End Users, By Country, 2017�2024 (USD Million)
Table 83 Asia Pacific: Specialty PACS Market for Other End Users, By Country, 2017�2024 (USD Million)
Table 84 Europe: Specialty PACS Market for Other End Users, By Country, 2017�2024 (USD Million)
Table 85 Specialty PACS Market, By Region, 2017�2024 (USD Million)
Table 86 North America: Specialty PACS Market, By Country, 2017�2024 (USD Million)
Table 87 North America: Specialty PACS Market, By Type, 2017�2024 (USD Million)
Table 88 North America: Specialty PACS Market, By Component, 2017�2024 (USD Million)
Table 89 North America: Specialty PACS Market, By Deployment Model, 2017�2024 (USD Million)
Table 90 North America: Specialty PACS Market, By End User, 2017�2024 (USD Million)
Table 91 US: Specialty PACS Market, By Type, 2017�2024 (USD Million)
Table 92 US: Specialty PACS Market, By Component, 2017�2024 (USD Million)
Table 93 US: Specialty PACS Market, By Deployment Model, 2017�2024 (USD Million)
Table 94 US: Specialty PACS Market, By End User, 2017�2024 (USD Million)
Table 95 Canada: Specialty PACS Market, By Type, 2017�2024 (USD Million)
Table 96 Canada: Specialty PACS Market, By Component, 2017�2024 (USD Million)
Table 97 Canada: Specialty PACS Market, By Deployment Model, 2017�2024 (USD Million)
Table 98 Canada: Specialty PACS Market, By End User, 2017�2024 (USD Million)
Table 99 Europe: Specialty PACS Market, By Country, 2017�2024 (USD Million)
Table 100 Europe: Specialty PACS Market, By Type, 2017�2024 (USD Million)
Table 101 Europe: Specialty PACS Market, By Component, 2017�2024 (USD Million)
Table 102 Europe: Specialty PACS Market, By Deployment Model, 2017�2024 (USD Million)
Table 103 Europe: Specialty PACS Market, By End User, 2017�2024 (USD Million)
Table 104 Germany: Specialty PACS Market, By Type, 2017�2024 (USD Million)
Table 105 Germany: Specialty PACS Market, By Component, 2017�2024 (USD Million)
Table 106 Germany: Specialty PACS Market, By Deployment Model, 2017�2024 (USD Million)
Table 107 Germany: Specialty PACS Market, By End User, 2017�2024 (USD Million)
Table 108 UK: Specialty PACS Market, By Type, 2017�2024 (USD Million)
Table 109 UK: Specialty PACS Market, By Component, 2017�2024 (USD Million)
Table 110 UK: Specialty PACS Market, By Deployment Model, 2017�2024 (USD Million)
Table 111 UK: Specialty PACS Market, By End User, 2017�2024 (USD Million)
Table 112 France: Specialty PACS Market, By Type, 2017�2024 (USD Million)
Table 113 France: Specialty PACS Market, By Component, 2017�2024 (USD Million)
Table 114 France: Specialty PACS Market, By End User, 2017�2024 (USD Million)
Table 115 France: Specialty PACS Market, By Deployment Model, 2017�2024 (USD Million)
Table 116 RoE: Specialty PACS Market, By Type, 2017�2024 (USD Million)
Table 117 RoE: Specialty PACS Market, By Component, 2017�2024 (USD Million)
Table 118 RoE: Specialty PACS Market, By Deployment Model, 2017�2024 (USD Million)
Table 119 RoE: Specialty PACS Market, By End User, 2017�2024 (USD Million)
Table 120 APAC: Specialty PACS Market, By Country, 2017�2024 (USD Million)
Table 121 APAC: Specialty PACS Market, By Type, 2017�2024 (USD Million)
Table 122 APAC: Specialty PACS Market, By Component, 2017�2024 (USD Million)
Table 123 APAC: Specialty PACS Market, By Deployment Model, 2017�2024 (USD Million)
Table 124 APAC: Specialty PACS Market, By End User, 2017�2024 (USD Million)
Table 125 China: Specialty PACS Market, By Type, 2017�2024 (USD Thousand)
Table 126 China: Specialty PACS Market, By Component, 2017�2024 (USD Million)
Table 127 China: Specialty PACS Market, By Deployment Model, 2017�2024 (USD Million)
Table 128 China: Specialty PACS Market, By End User, 2017�2024 (USD Million)
Table 129 India: Specialty PACS Market, By Type, 2017�2024 (USD Thousand)
Table 130 India: Specialty PACS Market, By Component, 2017�2024 (USD Million)
Table 131 India: Specialty PACS Market, By Deployment Model, 2017�2024 (USD Million)
Table 132 India: Specialty PACS Market, By End User, 2017�2024 (USD Million)
Table 133 RoAPAC: Specialty PACS Market, By Type, 2017�2024 (USD Thousand)
Table 134 RoAPAC: Specialty PACS Market, By Component, 2017�2024 (USD Million)
Table 135 RoAPAC: Specialty PACS Market, By Deployment Model, 2017�2024 (USD Million)
Table 136 RoAPAC: Specialty PACS Market, By End User, 2017�2024 (USD Million)
Table 137 Latin America: Specialty PACS Market, By Type, 2017�2024 (USD Thousand)
Table 138 Latin America: Specialty PACS Market, By Component, 2017�2024 (USD Million)
Table 139 Latin America: Specialty PACS Market, By Deployment Model, 2017�2024 (USD Million)
Table 140 Latin America: Specialty PACS Market, By End User, 2017�2024 (USD Million)
Table 141 North Africa: Specialty PACS Market, By Type, 2017�2024 (USD Thousand)
Table 142 North Africa: Specialty PACS Market, By Component, 2017�2024 (USD Million)
Table 143 North Africa: Specialty PACS Market, By Deployment Model, 2017�2024 (USD Million)
Table 144 North Africa: Specialty PACS Market, By End User, 2017�2024 (USD Million)
Table 145 RoW: Specialty PACS Market, By Type, 2017�2024 (USD Thousand)
Table 146 RoW: Specialty PACS Market, By Component, 2017�2024 (USD Million)
Table 147 RoW: Specialty PACS Market, By Deployment Model, 2017�2024 (USD Million)
Table 148 RoW: Specialty PACS Market, By End User, 2017�2024 (USD Million)
List of Figures (124 Figures)
Figure 1 Research Design
Figure 2 Breakdown of Primary Interviews
Figure 3 Bottom-Up Approach
Figure 4 Top-Down Approach
Figure 5 Specialty PACS Market, By Type, 2019 vs 2024 (USD Million)
Figure 6 Specialty PACS Market, By Type, 2019 vs 2024 (USD Million)
Figure 7 Specialty PACS Market, By Deployment Model, 2019 vs 2024 (USD Million)
Figure 8 Specialty PACS Market, By End User (2019 vs 2024)
Figure 9 Geographic Snapshot: Specialty PACS Market, By End User (2019�2024)
Figure 10 Global Specialty PACS Market to Offer Significant Growth Opportunities to Major Stakeholders in the Coming Years
Figure 11 Hospitals are Estimated to Be the Largest End Users of Specialty PACS in 2019
Figure 12 Countries in the Asia Pacific are Expected to Register the Highest Growth Rates During the Forecast Period
Figure 13 Population Aged 65 Years and Above (2017)
Figure 14 Specialty PACS Market, By Type, 2019 vs 2024 (USD Million)
Figure 15 Radiology PACS Market, By Region, 2019
Figure 16 Radiology PACS Market: Key Player Ranking, 2018
Figure 17 Cardiology PACS Market, By Region, 2019
Figure 18 Cardiology PACS Market: Key Player Ranking, 2018
Figure 19 Radiology PACS Market, By Region, 2019
Figure 20 Pathology PACS Market: Key Player Ranking, 2018
Figure 21 Ophthalmology PACS Market, By Region, 2019
Figure 22 Ophthalmology PACS Market: Key Player Ranking, 2018
Figure 23 Ophthalmology PACS Market, By Region, 2019
Figure 24 Orthopedics PACS Market: Key Player Ranking, 2018
Figure 25 Women�s Health PACS Market, By Region, 2019
Figure 26 Women�s Health PACS Market: Key Player Ranking, 2018
Figure 27 Dermatology PACS Market, By Region, 2019
Figure 28 Dermatology PACS Market: Key Player Ranking, 2018
Figure 29 Neurology PACS Market, By Region, 2019
Figure 30 Endoscopy PACS Market, By Region, 2019
Figure 31 Endoscopy PACS Market: Key Player Ranking, 2018
Figure 32 Oncology PACS Market, By Region, 2019
Figure 33 Oncology PACS Market: Key Player Ranking, 2018
Figure 34 Oncology PACS Market, By Region, 2019
Figure 35 Specialty PACS Market, By Component, 2019 vs 2024 (USD Million)
Figure 36 Specialty PACS Software Market Share, By Region (2019)
Figure 37 Specialty PACS Services Market Share, By Region (2019)
Figure 38 Specialty PACS Hardware Market Share, By Region (2019)
Figure 39 Specialty PACS Market, By Deployment Model, 2019 vs 2024 (USD Million)
Figure 40 On-Premise Specialty PACS Market Share, By Region (2019)
Figure 41 Web/Cloud-Based Specialty PACS Market Share, By Region (2019)
Figure 42 Specialty PACS Market Share, By End User, 2019 vs 2024, (USD Million)
Figure 43 Specialty PACS Market Share for Hospitals, By Region (2019)
Figure 44 Specialty PACS Market Share for Ascs & Clinics, By Region (2019)
Figure 45 Specialty PACS Market Share for Diagnostic Imaging Centers, By Region (2019)
Figure 46 Specialty PACS Market Share for Other End Users, By Region (2019)
Figure 47 Specialty PACS Market Share, By Region (2019)
Figure 48 North America: Specialty PACS Market Share, By Country (2019)
Figure 49 North America: Market Snapshot
Figure 50 North America: Specialty PACS Market Share, By Type (2019)
Figure 51 North America: Specialty PACS Market Share, By Component (2019)
Figure 52 North America: Specialty PACS Market Share, By Deployment Model (2019)
Figure 53 North America: Specialty PACS Market Share, By End User (2019)
Figure 54 US: Specialty PACS Market Share, By Type (2019)
Figure 55 US: Specialty PACS Market Share, By Component (2019)
Figure 56 US: Specialty PACS Market Share, By Deployment Model (2019)
Figure 57 US: Specialty PACS Market Share, By End User (2019)
Figure 58 Canada: Specialty PACS Market Share, By Type (2019)
Figure 59 Canada: Specialty PACS Market Share, By Component (2019)
Figure 60 Canada: Specialty PACS Market Share, By Deployment Model (2019)
Figure 61 Canada: Specialty PACS Market Share, By End User (2019)
Figure 62 Europe: Specialty PACS Market Share, By Country (2019)
Figure 63 Europe: Market Snapshot
Figure 64 Europe: Specialty PACS Market Share, By Type (2019)
Figure 65 Europe: Specialty PACS Market, By Component (2019)
Figure 66 Europe: Specialty PACS Market, By Deployment Model (2019)
Figure 67 Europe: Specialty PACS Market Share, By End User (2019)
Figure 68 Germany: Specialty PACS Market Share, By Type (2019)
Figure 69 Germany: Specialty PACS Market Share, By Component (2019)
Figure 70 Germany: Specialty PACS Market Share, By Deployment Model (2019)
Figure 71 Germany: Specialty PACS Market Share, By End User (2019)
Figure 72 UK: Specialty PACS Market Share, By Type (2019)
Figure 73 UK: Specialty PACS Market Share, By Component (2019)
Figure 74 UK: Specialty PACS Market Share, By Deployment Model (2019)
Figure 75 UK: Specialty PACS Market Share, By End User (2019)
Figure 76 France: Specialty PACS Market Share, By Type (2019)
Figure 77 France: Specialty PACS Market Share, By Component (2019)
Figure 78 France: Specialty PACS Market Share, By Deployment Model (2019)
Figure 79 France: Specialty PACS Market Share, By End User (2019)
Figure 80 RoE: Specialty PACS Market Share, By Type (2019)
Figure 81 RoE: Specialty PACS Market Share, By Component (2019)
Figure 82 RoE: Specialty PACS Market Share, By Deployment Model (2019)
Figure 83 RoE: Specialty PACS Market Share, By End User (2019)
Figure 84 APAC: Specialty PACS Market Share, By Country (2019)
Figure 85 APAC: Specialty PACS Market Share, By Type (2019)
Figure 86 APAC: Specialty PACS Market Share, By Component (2019)
Figure 87 APAC: Specialty PACS Market Share, By Deployment Model (2019)
Figure 88 APAC: Specialty PACS Market Share, By End User (2019)
Figure 89 China: Specialty PACS Market Share, By Type (2019)
Figure 90 China: Specialty PACS Market Share, By Component (2019)
Figure 91 China: Specialty PACS Market Share, By Deployment Model (2019)
Figure 92 China: Specialty PACS Market Share, By End User (2019)
Figure 93 India: Specialty PACS Market Share, By Type (2019)
Figure 94 India: Specialty PACS Market Share, By Component (2019)
Figure 95 India: Specialty PACS Market Share, By Deployment Model (2019)
Figure 96 India: Specialty PACS Market Share, By End User (2019)
Figure 97 RoAPAC: Specialty PACS Market Share, By Type (2019)
Figure 98 RoAPAC: Specialty PACS Market Share, By Component (2019)
Figure 99 RoAPAC: Specialty PACS Market Share, By Deployment Model (2019)
Figure 100 RoAPAC: Specialty PACS Market Share, By End User (2019)
Figure 101 Latin America: Specialty PACS Market Share, By Type (2019)
Figure 102 Latin America: Specialty PACS Market Share, By Component (2019)
Figure 103 Latin America: Specialty PACS Market Share, By Deployment Model (2019)
Figure 104 Latin America: Specialty PACS Market Share, By End User (2019)
Figure 105 North Africa: Specialty PACS Market Share, By Type (2019)
Figure 106 North Africa: Specialty PACS Market Share, By Component (2019)
Figure 107 North Africa: Specialty PACS Market Share, By Deployment Model (2019)
Figure 108 North Africa: Specialty PACS Market Share, By End User (2019)
Figure 109 RoW: Specialty PACS Market Share, By Type (2019)
Figure 110 RoW: Specialty PACS Market Share, By Component (2019)
Figure 111 RoW: Specialty PACS Market Share, By Deployment Model (2019)
Figure 112 RoW: Specialty PACS Market Share, By End User (2019)
Figure 113 New Product Launches are the Most Widely Adopted Growth Strategy
Figure 114 Specialty PACS Market Share, By Key Player (2018)
Figure 115 IBM: Company Snapshot (2018)
Figure 116 Mckesson Corporation: Company Snapshot (2018)
Figure 117 Agfa-Gevaert Nv: Company Snapshot (2017)
Figure 118 Onex Corporation: Company Snapshot (2018)
Figure 119 Philips Healthcare: Company Snapshot (2018)
Figure 120 Sectra AB: Company Snapshot (2018)
Figure 121 Siemens Healthineers: Company Snapshot (2017)
Figure 122 Topcon Corporation: Company Snapshot (2018)
Figure 123 Sonomed Escalon: Company Snapshot (2018)
Figure 124 Canon Inc.: Company Snapshot (2018)
The study involved four major activities in estimating the current size of the global specialty PACS market. Exhaustive secondary research was done to collect information on the market, its peer markets, and its parent market. The next step was to validate these findings, assumptions, and sizing values with industry experts across the value chain through primary research. Both top-down and bottom-up approaches were employed to estimate the complete market size. After that, market breakdown and data triangulation procedures were used to estimate the market size of segments and subsegments.
Secondary Research
Secondary research was mainly used to identify and collect information for the extensive, technical, market-oriented, and commercial study of the global specialty PACS market. Secondary sources include directories; databases such as Bloomberg Business, Factiva, and Wall Street Journal; white papers; and annual reports were also used to obtain key information about major players, market classification, and segmentation according to industry trends, regional/country-level markets, market developments, and technology perspectives.
Primary Research
In-depth interviews were conducted with various primary respondents, including key industry participants, subject-matter experts (SMEs), C-level executives of key market players, and industry consultants, among other experts, to obtain and verify the critical qualitative and quantitative information as well as assess prospects of the market. Various primary sources from both the supply and demand sides of the market were interviewed to obtain qualitative and quantitative information. The following is a breakdown of primary respondents:
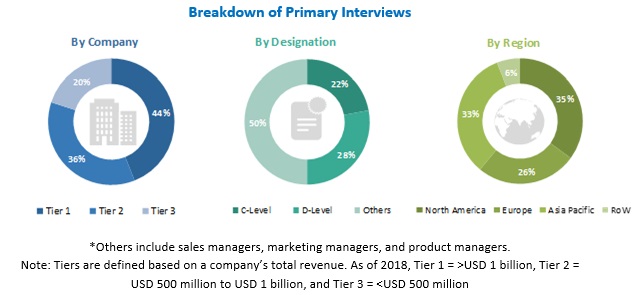
To know about the assumptions considered for the study, download the pdf brochure
Market Size Estimation
Both top-down and bottom-up approaches were used to estimate and validate the total size of the global specialty PACS market. These methods were also used extensively to estimate the size of various subsegments in the market. The research methodology used to estimate the market size includes the following:
- The key players in the industry and markets have been identified through extensive secondary research.
- The revenue generated from the sale of specialty PACS products by leading players has been determined through primary and secondary research.
- All percentage shares, splits, and breakdowns have been determined using secondary sources and verified through primary sources.
Data Triangulation
After arriving at the overall market size from the market size estimation process, the total market was split into several segments and subsegments. To complete the overall market engineering process and arrive at the exact statistics for all segments and subsegments, data triangulation and market breakdown procedures were employed, wherever applicable. The data was triangulated by studying various factors and trends from both the demand and supply sides.
Report Objectives
- To define, describe, and forecast the global specialty PACS market based on type, component, deployment model, end-user, and region
- To provide detailed information regarding the major factors influencing the growth of the market (drivers, restraints, and opportunities)
- To strategically analyze micromarkets with respect to the individual growth trends, future prospects, and contributions to the overall market
- To analyze the opportunities in the market for stakeholders and provide details of the competitive landscape for market leaders
- To forecast the size of the market segments with respect to six main regions, namely, North America, Europe, Asia Pacific, Latin America, North Africa, and the Rest of the World (RoW)
- To profile the key players and comprehensively analyze their product portfolios, market positions, and core competencies
- To track and analyze competitive developments such as agreements, contracts, & partnerships; product launches; acquisitions; and expansions in the specialty PACS market
Available Customizations
With the given market data, MarketsandMarkets offers customizations as per the company�s specific needs.
The following customization options are available for this report.
Company Information
- Detailed analysis and profiling of additional market players (up to 5)

 Generating Response ...


Growth opportunities and latent adjacency in Specialty PACS Market