This research involves the extensive use of secondary sources; directories; and databases (Bloomberg and Factiva) to identify and collect information useful for a technical, market-oriented, and commercial study of the Starch derivatives market. In-depth interviews were conducted with various primary respondents, such as key industry participants, Subject Matter Experts (SMEs), C-level executives of key market players, and industry consultants, to obtain and verify critical qualitative and quantitative information and to assess prospects.
Secondary Research
In the secondary research process, various sources, such as the Food and Agricultural Organization (FAO), United States Department of Agriculture (USDA), U.S. Food and Drug Administration (FDA) U.S. Food and Drug Administration (FDA), European Food Safety Authority (EFSA), World Health Organization (WHO), Consumer Healthcare Products Association (CHPA), European Federation of Associations of Health Product Manufacturers (EHPM), Canadian Health Food Association (CHFA), and Health Food Manufacturers' Association (HFMA), associations were referred to identify and collect information for this study. The secondary sources also include journals, press releases, investor presentations of companies, whitepapers, certified publications, articles by recognized authors and regulatory bodies, trade directories, and paid databases.
Primary Research
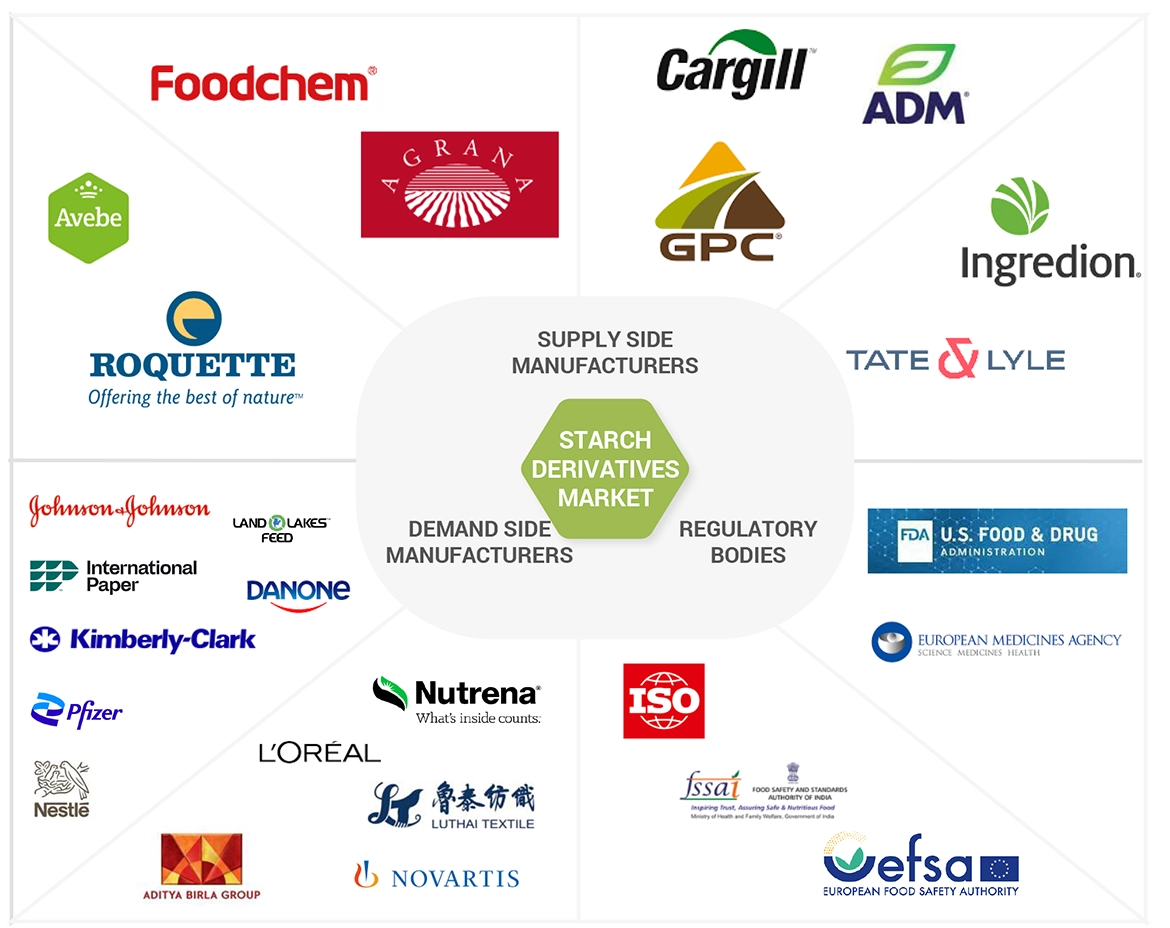
The Starch derivatives market encompasses various stakeholders involved in the supply chain, raw material manufacturers, raw material suppliers, regulatory organizations, and research institutions. To gather comprehensive information, primary sources from both the supply and demand sides were engaged. Primary interviewees from the supply side consisted of manufacturers, distributors, importers, and technology providers involved in the production and distribution of Precision fermentation. On the demand side, key opinion leaders, executives, and CEOs of companies in the Starch derivatives industry were approached through questionnaires, emails, and telephonic interviews. This approach ensured a comprehensive and well-rounded understanding of the Starch derivatives market from various perspectives.

To know about the assumptions considered for the study, download the pdf brochure
Market Size Estimation
The top-down and bottom-up approaches were used to estimate and validate the market’s and various dependent submarkets’ size. The research methodology used to estimate the market size includes extensive secondary research of key players, reports, reviews, and newsletters of top market players, along with extensive interviews from leaders, such as CEOs, directors, and marketing executives.
Global Starch Derivatives Market Size: Bottom-Up Approach

To know about the assumptions considered for the study, Request for Free Sample Report
Global Starch Derivatives Market Size: Top-Down Approach

Market Definition
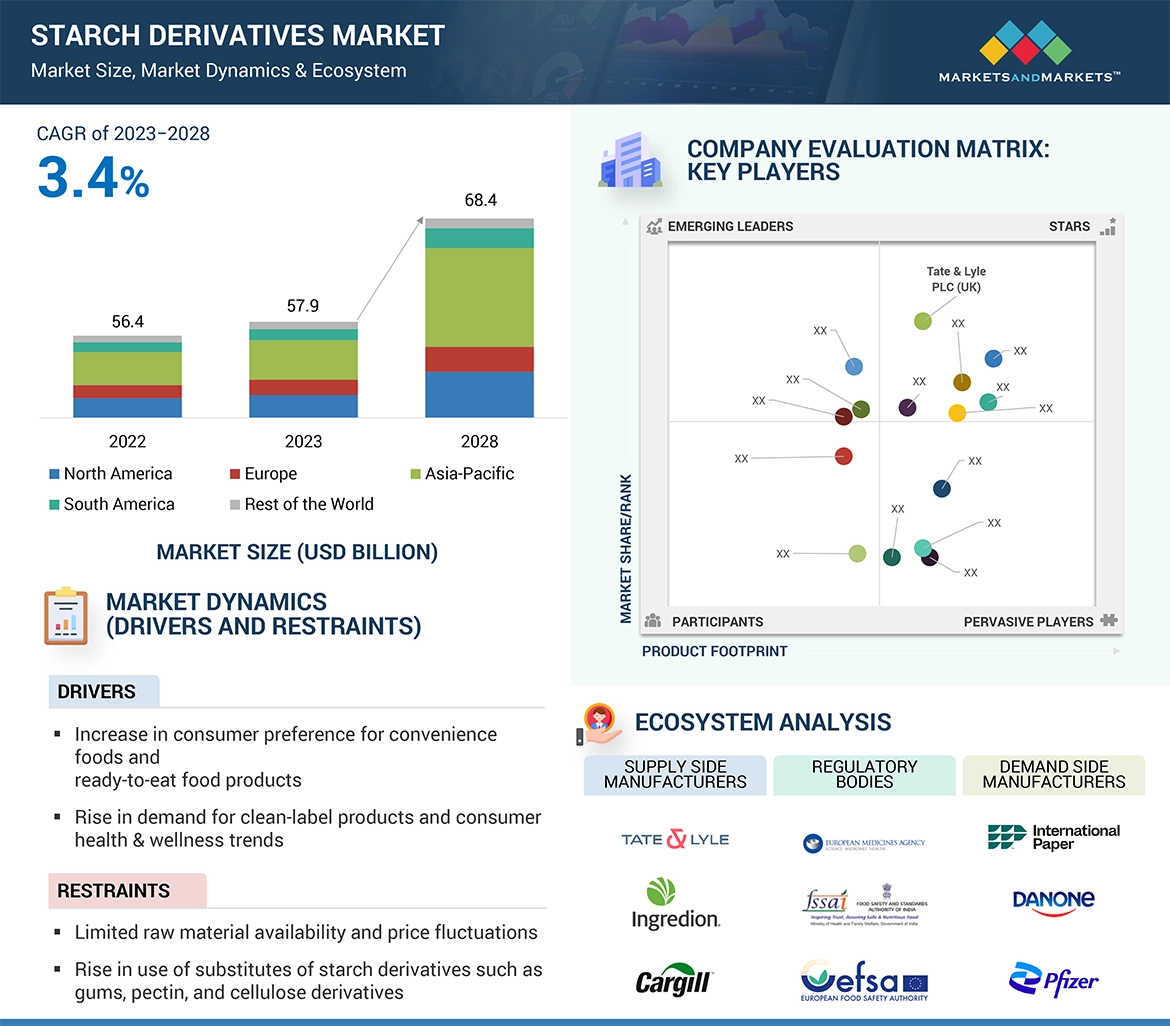
Starch is a naturally abundant nutrient carbohydrate consisting of a large number of glucose units, mainly obtained from natural sources such as corn, potatoes, wheat, rice, and other plant sources commonly prepared as a white amorphous powder. Starch derivatives are prepared by treating starch through different processes such as hydrolysis, extraction, purification, and chemical treatment to be utilized in a wide range of food and non-food applications. Starch derivatives are used for functions such as thickening, stabilizing, binding, and emulsification.
Data Triangulation
The data triangulation and market breakdown procedures explained above were implemented, wherever applicable, to complete the overall market engineering process and arrive at the exact statistics for various market segments and subsegments. The data was triangulated by studying various factors and trends from the demand and supply sides. Along with this, the market size was validated using both the top-down and bottom-up approaches.
Key Stakeholders
-
Starch and starch derivative manufacturers and processors
-
Intermediate suppliers such as traders and distributors of starch and starch derivatives
-
Manufacturers of food & beverage ingredients, processed food, and feed
-
Other manufacturing industries such as the personal care, pharmaceutical, and papermaking industries
-
Government and research organizations
-
Associations, regulatory bodies, and other industry-related bodies:
-
Starch Europe
-
The Food and Agriculture Organization (FAO)
-
Food and Drug Administration (FDA)
-
US Department of Agriculture (USDA)
-
European Food Safety Agency (EFSA)
-
Agriculture and Agri-Food Canada
-
National Corn Grower Association - World of Corn
-
The International Food Additives Council (IFAC)
-
Food Processing Suppliers Association (FPSA)
-
Food Standards Australia New Zealand (FSANZ)
Report Objectives
-
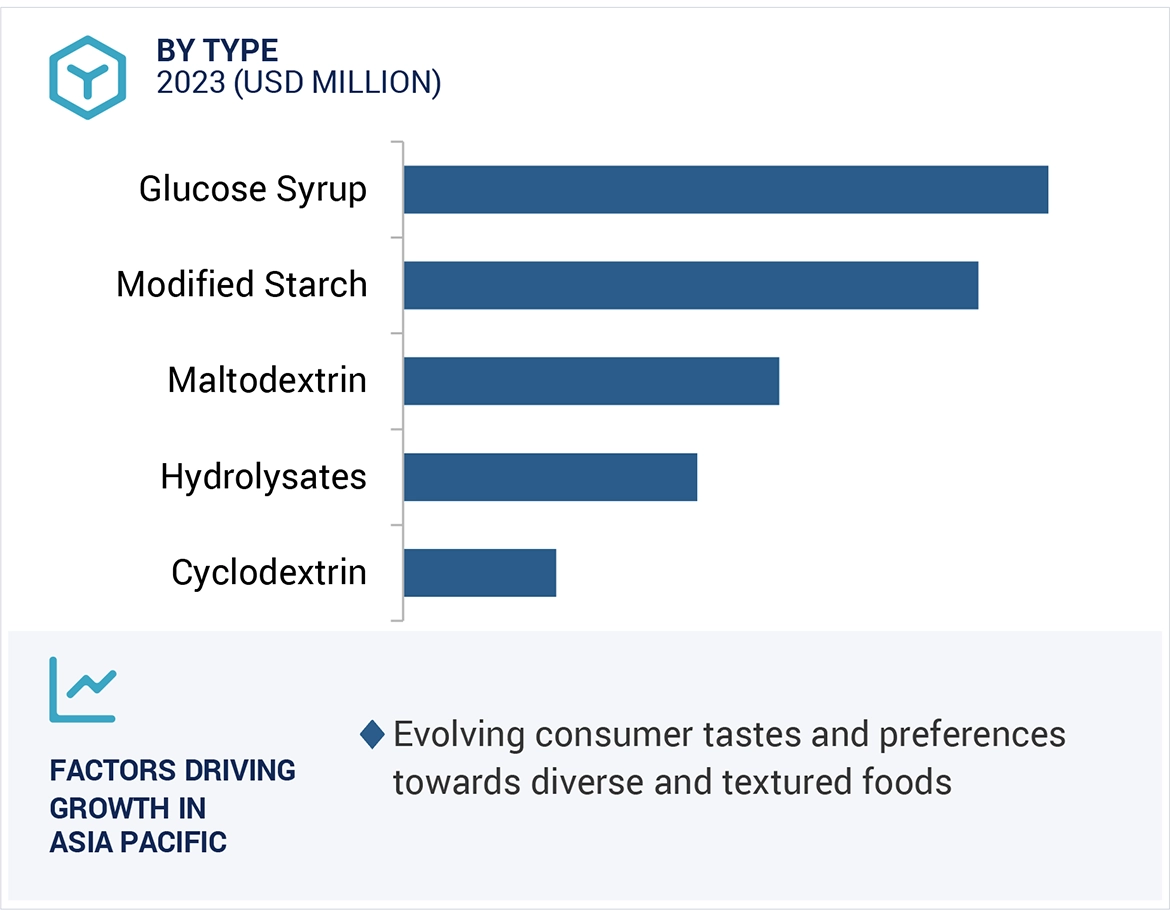
To define, segment, and project the global market for Starch derivatives on the basis of type, source, form, application, functionality, and region
-
To provide detailed information regarding the key factors influencing the growth of the market (drivers, restraints, opportunities, and industry-specific challenges)
-
To strategically analyze the micro markets with respect to individual growth trends, future prospects, and their contribution to the total market
-
To analyze the opportunities in the market for stakeholders and provide a competitive landscape of the market leaders
-
To project the size of the market and its submarkets, in terms of value with respect to the regions (along with the key countries)
-
To strategically profile the key players and comprehensively analyze their market position and core competencies
-
To analyze competitive developments in the Starch derivatives market, including joint ventures, mergers & acquisitions, new product developments, and research & development activities
Available Customizations:
With the given market data, MarketsandMarkets offers customizations according to company-specific scientific needs.
The following customization options are available for the report:
Product Analysis
-
Product Matrix, which gives a detailed comparison of the product portfolio of each company
Geographic Analysis
With the given market data, MarketsandMarkets offers customizations according to company-specific scientific needs.
-
Further breakdown of the Rest of the European Starch derivatives market, by key country
-
Further breakdown of the Rest of the Asia Pacific Starch derivatives market, by key country
-
Further breakdown of the Rest of South America Starch derivatives market, by key country
Company Information
-
Detailed analyses and profiling of additional market players


Growth opportunities and latent adjacency in Starch Derivatives Market