Traction Transformer Market by Rolling Stock (Electric Locomotives, High-speed Trains, Metros), Mounting Position (Underframe, Machine Room, Roof), Overhead Line Voltage, and Geography - Global Forecast to 2036


Traction Transformer Market Summary
The Traction Transformer Market size was valued at approximately USD 6–8 billion in 2025 and is projected to reach around USD 12–15 billion by 2036, growing at a CAGR of 6%–8% during the forecast period (2025–2036). The market is experiencing steady growth driven by the global expansion of railway electrification, high-speed rail projects, and increasing investments in sustainable transportation infrastructure. The increasing demand for energy-efficient rail systems, coupled with the integration of advanced technologies such as Artificial Intelligence (AI), Internet of Things (IoT), and predictive maintenance solutions, is transforming the traction transformer landscape. As governments worldwide push for decarbonization and smart mobility, traction transformers are becoming a critical component in enabling efficient power conversion and distribution in electric locomotives and metro systems.
Key Market Trends & Insights
The Traction Transformer Market is shaped by evolving transportation needs and rapid technological advancements. Europe currently leads the market due to its extensive electrified rail network and strong focus on sustainable mobility solutions. Asia Pacific is emerging as the fastest-growing region, fueled by large-scale railway infrastructure development in countries such as China and Japan.
From a product standpoint, oil-cooled traction transformers dominate the market due to their high efficiency and reliability in heavy-duty applications. However, dry-type transformers are gaining traction, particularly in urban metro systems, due to their safety and lower maintenance requirements. The integration of AI and IoT technologies is enabling real-time monitoring and predictive maintenance, reducing downtime and operational costs.
Automation and digitalization trends are further enhancing the performance of traction transformers, with smart grid integration and energy management systems becoming increasingly important. Lightweight and compact transformer designs are also gaining popularity to improve energy efficiency and reduce space constraints in modern trains.
Market Size & Forecast
-
Base Year Market Size (2025): USD 6–8 billion
-
Forecast Value by 2036: USD 12–15 billion
-
CAGR (2025–2036): 6%–8%
-
Growth is driven by increasing railway electrification, high-speed rail expansion, and adoption of smart monitoring technologies.
Traction Transformer Market Top 10 key takeaway
-
Railway electrification is the primary driver of market growth.
-
Europe holds the largest market share due to established rail infrastructure.
-
Asia Pacific is the fastest-growing region with massive infrastructure investments.
-
Oil-cooled transformers dominate due to high efficiency in heavy-duty applications.
-
Dry-type transformers are gaining popularity in metro systems.
-
AI and IoT integration is enabling predictive maintenance and real-time monitoring.
-
High-speed rail projects are boosting demand for advanced transformers.
-
Sustainability and energy efficiency are key focus areas.
-
Compact and lightweight transformer designs are emerging trends.
-
Government investments in smart transportation are accelerating market expansion.
Product Insights
In the Traction Transformer Market, oil-cooled traction transformers continue to dominate due to their superior thermal performance, high load capacity, and reliability in demanding railway environments. These transformers are widely used in high-speed trains and freight locomotives where continuous operation and high power output are required. Their ability to efficiently dissipate heat makes them suitable for long-distance and heavy-duty applications.
Dry-type traction transformers are emerging as a significant product segment, particularly in urban transit systems such as metros and light rail. These transformers offer enhanced safety, reduced fire risk, and lower maintenance requirements, making them ideal for underground and densely populated areas. The growing focus on sustainable and eco-friendly solutions is further driving the adoption of dry-type transformers.
Technological integration is also reshaping product innovation, with manufacturers incorporating AI-based diagnostics and IoT-enabled sensors into transformer systems. These advancements enable condition monitoring, fault detection, and predictive maintenance, thereby improving operational efficiency and reducing lifecycle costs.
Technology / Component Insights
The Traction Transformer Market is undergoing a technological transformation driven by advancements in AI, IoT, and automation. IoT-enabled sensors are increasingly being embedded in traction transformers to collect real-time data on temperature, voltage, and load conditions. This data is transmitted to cloud platforms for analysis, enabling predictive maintenance and minimizing unexpected failures.
Artificial Intelligence is playing a crucial role in analyzing operational data and optimizing transformer performance. AI algorithms can identify patterns and anomalies, allowing operators to take proactive measures and improve system reliability. Automation technologies are also being integrated into transformer manufacturing processes, enhancing precision and reducing production costs.
Additionally, advancements in materials science, such as the use of high-performance insulation and lightweight components, are improving transformer efficiency and durability. The integration of traction transformers with smart grid systems is enabling better energy management and supporting the transition to sustainable transportation.
Application Insights
The railway sector remains the dominant application segment in the Traction Transformer Market, driven by the increasing adoption of electric locomotives and high-speed trains. Traction transformers are essential for converting and regulating electrical power from overhead lines to the appropriate voltage required by train systems.
Metro and light rail systems are also significant contributors, particularly in urban areas where efficient and sustainable public transportation is a priority. The expansion of metro networks in emerging economies is driving demand for compact and reliable traction transformers.
Future opportunities are emerging in hybrid and battery-powered trains, where advanced transformer technologies are required to support energy storage and management systems. The integration of AI and IoT in railway operations is further enhancing the efficiency and reliability of traction transformers, creating new growth avenues for the market.
Regional Insights
Europe dominates the Traction Transformer Market, supported by its extensive electrified rail network and strong commitment to sustainable transportation. Countries such as Germany and France are investing heavily in modernizing rail infrastructure and adopting advanced technologies.
North America is also a significant market, driven by investments in rail modernization and the adoption of smart transportation systems. The United States and Canada are focusing on improving rail efficiency and reducing carbon emissions.
Asia Pacific is the fastest-growing region, fueled by rapid urbanization, increasing demand for public transportation, and large-scale railway projects in China and Japan. Government initiatives promoting high-speed rail and metro development are further accelerating market growth.
-
Europe leads due to advanced rail infrastructure and sustainability focus.
-
North America is growing with investments in rail modernization.
-
Asia Pacific is the fastest-growing region with strong infrastructure development.
-
Government initiatives are driving adoption of electrified rail systems.
-
Increasing urbanization is boosting demand for metro and light rail systems.
Country Specific Market Trends
In Asia Pacific, China is witnessing rapid growth with a CAGR of 7%–9%, driven by extensive high-speed rail projects and government investments in transportation infrastructure. Japan is also a key market, growing at a CAGR of 6%–8%, supported by technological advancements and a strong focus on efficient rail systems.
In North America, the United States leads the market with a CAGR of 5%–7%, driven by modernization of rail networks and adoption of smart technologies. Canada and Mexico are also experiencing steady growth due to increasing investments in transportation infrastructure.
In Europe, Germany is a major contributor with a CAGR of 6%–8%, supported by its strong industrial base and commitment to sustainable mobility. France is also witnessing growth, driven by high-speed rail expansion and government initiatives.
-
China leads APAC growth with large-scale rail projects.
-
Japan focuses on advanced and efficient rail technologies.
-
United States drives North American market growth.
-
Germany leads Europe with strong industrial and rail infrastructure.
-
France benefits from high-speed rail expansion initiatives.
Key Traction Transformer Market Company Insights
The Traction Transformer Market is highly competitive, with key players focusing on innovation, digitalization, and strategic partnerships. Major companies include ABB Ltd., Siemens Mobility, Alstom SA, Hitachi Energy, Mitsubishi Electric Corporation, Schneider Electric, Toshiba Corporation, CG Power and Industrial Solutions, Hyundai Electric, and Bharat Heavy Electricals Limited (BHEL).
These companies are investing in AI-enabled monitoring systems, lightweight transformer designs, and energy-efficient solutions to enhance product performance. Strategic collaborations with railway operators and government agencies are enabling them to expand their market presence and develop customized solutions. Continuous research and development efforts are driving innovation and strengthening competitive positioning.
-
Companies are investing in AI and IoT-enabled transformer solutions.
-
Focus on energy efficiency and sustainability is increasing.
-
Strategic partnerships are driving market expansion.
-
Lightweight and compact designs are key innovation areas.
-
Continuous R&D is enhancing product performance and reliability.
Recent Developments
Recent developments in the Traction Transformer Market highlight ongoing innovation and collaboration. A leading manufacturer recently launched an AI-enabled traction transformer equipped with real-time monitoring capabilities to improve operational efficiency. Another company introduced a lightweight transformer design aimed at reducing energy consumption and improving train performance. Additionally, a strategic partnership between a transformer manufacturer and a railway operator has been established to develop advanced digital solutions for predictive maintenance.
Market Segmentation
The Traction Transformer Market is segmented based on product, technology/component, application, and region. By product, the market includes oil-cooled and dry-type traction transformers, with oil-cooled transformers dominating due to their high efficiency and reliability. By technology, the market incorporates AI, IoT, automation, and advanced materials that enhance performance and enable predictive maintenance.
In terms of application, the market is primarily driven by railway systems, including high-speed trains, metros, and light rail. Regionally, the market is divided into North America, Europe, Asia Pacific, and the rest of the world, with Europe leading and Asia Pacific emerging as the fastest-growing region.
-
Oil-cooled transformers dominate the product segment.
-
AI and IoT are key technologies driving innovation.
-
Railway systems are the primary application segment.
-
Europe holds the largest market share.
-
Asia Pacific is the fastest-growing region.
The Traction Transformer Market is poised for steady growth through 2036, driven by increasing investments in railway electrification and sustainable transportation. The integration of AI, IoT, and automation technologies is transforming transformer performance, enabling predictive maintenance and improved efficiency. As governments and industries continue to prioritize decarbonization and smart mobility, traction transformers will play a crucial role in supporting the evolution of modern rail systems. Companies that focus on innovation, energy efficiency, and digitalization will be well-positioned to capitalize on the growing demand and maintain a competitive edge in this dynamic market.
FAQs
1. What is the market size of the Traction Transformer Market?
The market size was approximately USD 6–8 billion in 2025 and is expected to reach USD 12–15 billion by 2036.
2. What is the growth rate of the Traction Transformer Market?
The market is projected to grow at a CAGR of 6%–8% during the forecast period (2025–2036).
3. What are the key drivers of the market?
Key drivers include railway electrification, high-speed rail expansion, and adoption of AI and IoT technologies.
4. Which region leads the market?
Europe currently leads the Traction Transformer Market due to its advanced rail infrastructure.
5. Who are the key companies in the market?
Major companies include ABB Ltd., Siemens Mobility, Alstom SA, Hitachi Energy, Mitsubishi Electric, Schneider Electric, Toshiba, CG Power, Hyundai Electric, and BHEL.
To speak to our analyst for a discussion on the above findings, click Speak to Analyst
 Exclusive indicates content/data unique to MarketsandMarkets and not available with any competitors.
Table of Contents
1 Introduction (Page No. - 13)
1.1 Objectives of the Study
1.2 Traction Transformer Market Definition
1.3 Scope of the Study
1.3.1 Markets Covered
1.3.2 Years Considered for the Study
1.4 Currency
1.5 Limitations
1.6 Stakeholders
2 Research Methodology (Page No. - 16)
2.1 Research Data
2.1.1 Secondary Data
2.1.1.1 Key Data From Secondary Sources
2.1.2 Primary Data
2.1.2.1 Key Data From Primary Sources
2.1.2.2 Key Industry Insights
2.1.2.3 Breakdown of Primaries
2.2 Traction Transformer Market Size Estimation
2.2.1 Bottom-Up Approach
2.2.2 Top-Down Approach
2.3 Market Breakdown & Data Triangulation
2.4 Research Assumptions
3 Executive Summary (Page No. - 24)
4 Premium Insights (Page No. - 29)
4.1 Traction Transformer Market, 2016–2022
4.2 Traction Transformer Market, By Rolling Stock (2016–2022)
4.3 Traction Transformer Market, By Mounting Position, 2016
4.4 Traction Transformer Market, By Overhead Line Voltage, 2016
4.5 Market, By Rolling Stock and Region, 2016
4.6 Market, By Geography (2016)
5 Market Overview (Page No. - 32)
5.1 Introduction
5.2 Market Segmentation
5.2.1 Market, By Rolling Stock
5.2.2 Market, By Mounting Position
5.2.3 Market, By Overhead Line Voltage
5.2.4 Market, By Geography
5.3 Market Dynamics
5.3.1 Drivers
5.3.1.1 Significant Government Funding for Rail Infrastructure Development
5.3.1.2 Shift Toward Low Carbon Rail Transport
5.3.1.3 Liberalization of Rail Transport Network
5.3.2 Restraints
5.3.2.1 High Cost of Electrification
5.3.2.2 Dominance of Diesel-Powered Rail Engines in Certain Countries
5.3.3 Opportunities
5.3.3.1 Electrification of Rail Networks
5.3.4 Challenges
5.3.4.1 Complexity in Designing Traction Transformers
6 Industry Trends (Page No. - 38)
6.1 Introduction
6.2 Value Chain Analysis
6.3 Porter’s Five Forces Model
6.3.1 Bargaining Power of Suppliers
6.3.2 Bargaining Power of Buyers
6.3.3 Threat of New Entrants
6.3.4 Threat of Substitutes
6.3.5 Intensity of Competitive Rivalry
7 Market Analysis, By Rolling Stock (Page No. - 46)
7.1 Introduction
7.2 Electric Locomotives
7.2.1 Freight Locomotives
7.2.1.1 Expansion of Railway Networks Expected to Drive the Traction Transformer Market for Freight Locomotives
7.2.2 Passenger Locomotives
7.2.2.1 Increasing Number of Contracts for Passenger Locomotives Driving the Market
7.3 High-Speed Trains
7.3.1 Increasing Concern for Carbon Footprint to Increase the Demand for High-Speed Trains
7.4 Metros
7.4.1 Government Funds for Metros to Increase the Adoption of Traction Transformers
8 Market Analysis, By Mounting Position (Page No. - 59)
8.1 Introduction
8.2 Underframe
8.3 Machine Room
8.4 Roof
9 Market Analysis, By Overhead Line Voltage (Page No. - 63)
9.1 Introduction
9.2 AC
9.2.1 12kv
9.2.2 15kv
9.2.3 20kv
9.2.4 25kv
9.3 DC
9.3.1 0.75kv
9.3.2 1.5kv
9.3.3 3kv
10 Geographic Analysis (Page No. - 70)
10.1 Introduction
10.2 North America
10.2.1 U.S.
10.2.2 Canada
10.3 Europe
10.3.1 Russia
10.3.2 Italy
10.3.3 Switzerland
10.3.4 France
10.3.5 Austria
10.3.6 Germany
10.3.7 Spain
10.3.8 U.K.
10.3.9 Rest of Europe
10.4 Asia-Pacific (APAC)
10.4.1 China
10.4.2 India
10.4.3 Australia
10.4.4 Japan
10.4.5 South Korea
10.4.6 Taiwan
10.4.7 Rest of APAC
10.5 Rest of the World (RoW)
10.5.1 Middle East
10.5.1.1 UAE
10.5.1.2 Kingdom of Saudi Arabia (KSA)
10.5.2 Africa
10.5.3 South America
10.5.3.1 Brazil
10.5.3.2 Argentina
11 Competitive Landscape (Page No. - 102)
11.1 Overview
11.2 Market Ranking Analysis for Traction Transformer Manufacturers
11.3 Competitive Situations and Trends
11.3.1 Contracts
11.3.2 Agreements, Acquisitions, and Certifications
11.3.3 New Product Launches
12 Company Profiles (Page No. - 107)
12.1 Introduction
(Business Overview, Products & Services, Key Insights, Recent Developments, SWOT Analysis, Ratio Analysis, MnM View)*
12.2 ABB Ltd.
12.3 Alstom SA
12.4 JST Transformateurs
12.5 Mitsubishi Electric Corporation
12.6 Siemens AG
12.7 EMCO Limited
12.8 Hind Rectifiers Limited
12.9 International Electric Co., Ltd.
12.10 Setrans Holding as
12.11 Wilson Transformer Company
*Details on Business Overview, Products & Services, Key Insights, Recent Developments, SWOT Analysis, MnM View Might Not Be Captured in Case of Unlisted Companies.
13 Appendix (Page No. - 129)
13.1 Insights of Industry Experts
13.2 Discussion Guide
13.3 Knowledge Store: Marketsandmarkets’ Subscription Portal
13.4 Introducing RT: Real-Time Market Intelligence
13.5 Available Customizations
13.6 Related Reports
13.7 Author Details
List of Tables (51 Tables)
Table 1 Market, 2013–2022 (USD Million & Units)
Table 2 Market, By Rolling Stock, 2013–2022 (USD Million)
Table 3 Market, By Rolling Stock, 2013–2022 (Units)
Table 4 Market for Electric Locomotives, By Type, 2013–2022 (USD Million)
Table 5 Market for Electric Locomotives, By Type, 2013–2022 (Units)
Table 6 Market for Freight Locomotives, By Region, 2013–2022 (USD Million)
Table 7 Market for Freight Locomotives, By Region, 2013–2022 (Units)
Table 8 Market for Passenger Locomotives, By Region, 2013–2022 (USD Million)
Table 9 Market for Passenger Locomotives, By Region, 2013–2022 (Units)
Table 10 Market for High-Speed Trains, By Region, 2013–2022 (USD Million)
Table 11 Market for High-Speed Trains, By Region, 2013–2022 (Units)
Table 12 Market for Metros, By Region, 2013–2022 (USD Million)
Table 13 Market for Metros, By Region, 2013–2022 (Units)
Table 14 Market, By Mounting Position, 2013–2022 (USD Million)
Table 15 Market, By Overhead Line Voltage, 2013–2022 (USD Million)
Table 16 Market, By AC Overhead Line Voltage, 2013–2022 (USD Million)
Table 17 Market, By DC Overhead Line Voltage, 2013–2022 (USD Million)
Table 18 Market, By Region, 2013–2022 (USD Million)
Table 19 Market, By Region, 2013–2022 (Units)
Table 20 North America: Government Funding for Rail Infrastructure
Table 21 Market in North America, By Country, 2013–2022 (USD Million)
Table 22 Market in North America, By Country, 2013–2022 (Units)
Table 23 Market for Freight Locomotives in North America, By Country, 2013–2022 (USD Million)
Table 24 Market for Passenger Locomotives in North America, By Country, 2013–2022 (USD Million)
Table 25 Market for High-Speed Trains in North America, By Country, 2013–2022 (USD Million)
Table 26 Market for Metros in North America, By Country, 2013–2022 (USD Million)
Table 27 Europe: Government Funding for Rail Infrastructure
Table 28 Market in Europe, By Country, 2013–2022 (USD Million)
Table 29 Market in Europe, By Country, 2013–2022 (Units)
Table 30 Market for Freight Locomotives in Europe, By Country, 2013–2022 (USD Million)
Table 31 Market for Passenger Locomotives in Europe, By Country, 2013–2022 (USD Million)
Table 32 Market for High-Speed Trains in Europe, By Country, 2013–2022 (USD Million)
Table 33 Market for Metros in Europe, By Country, 2013–2022 (USD Million)
Table 34 APAC: Government Funding for Rail Infrastructure
Table 35 Market in APAC, By Country, 2013–2022 (USD Million)
Table 36 Market in APAC, By Country, 2013–2022 (Units)
Table 37 Market for Freight Locomotives in APAC, By Country, 2013–2022 (USD Million)
Table 38 Market for Passenger Locomotives in APAC, By Country, 2013–2022 (USD Million)
Table 39 Market for High-Speed Trains in APAC, By Country, 2013–2022 (USD Million)
Table 40 Market for Metros in APAC, By Country, 2013–2022 (USD Million)
Table 41 RoW: Government Funding for Rail Infrastructure
Table 42 Market in RoW, By Region, 2013–2022 (USD Million)
Table 43 Market in RoW, By Region, 2013–2022 (Units)
Table 44 Market for Passenger Locomotives in RoW, By Region, 2013–2022 (USD Million)
Table 45 Market for Freight Locomotives in RoW, By Region, 2013–2022 (USD Million)
Table 46 Market for High-Speed Trains in RoW, By Region, 2013–2022 (USD Million)
Table 47 Market for Metros in RoW, By Region, 2013–2022 (USD Million)
Table 48 Ranking of the Top 5 Players: Market, 2015
Table 49 Contracts, 2014–2016
Table 50 Agreements, Acquisitions, and Certifications, 2014–2016
Table 51 New Product Launches, 2014–2016
List of Figures (63 Figures)
Figure 1 Traction Transformer Market Segmentation
Figure 2 Market: Research Design
Figure 3 Bottom-Up Approach to Arrive at the Market Size
Figure 4 Top-Down Approach to Arrive at the Market Size
Figure 5 Data Triangulation
Figure 6 Assumptions of the Research Study
Figure 7 Market Segmentation
Figure 8 Market Snapshot (2016 vs 2022): Electric Locomotives Held the Largest Size of the Market in 2016
Figure 9 Market for Traction Transformers Mounted in Machine Rooms I Expected to Grow at the Highest Rate Between 2016 and 2022
Figure 10 Market for 25kv AC Overhead Line Voltage Expected to Grow at the Highest Rate Between 2016 and 2022
Figure 11 APAC Captured the Largest Market Share in 2016
Figure 12 Attractive Growth Opportunities in the Market Between 2016 and 2022
Figure 13 Market for Electric Locomotives Expected to Grow at the Highest Rate Between 2016 and 2022
Figure 14 Underframe Traction Transformers Accounted for A Major Market Share in 2016
Figure 15 AC Overhead Line Voltage Segment Held the Largest Share of the Market in 2016
Figure 16 Freight Locomotives Captured the Largest Share of the Market in 2016
Figure 17 China Held the Largest Share of the Market in 2016
Figure 18 Market, By Geography
Figure 19 DROC: Traction Transformer Market, 2016
Figure 20 Value Chain Analysis: Major Value is Added During the Manufacturing and Assembly Phase
Figure 21 Market: Porter’s Five Forces Analysis
Figure 22 Bargaining Power of Suppliers Expected to Have A High Impact on the Market
Figure 23 High Quality of Raw Materials to Have A Significant Impact on Bargaining Power of Suppliers
Figure 24 Moderate Switching Cost of Buyers’ to Have A Medium Impact on Bargaining Power of Buyers
Figure 25 Low Growth Rate of the Market to Have A Low Impact on Threat of New Entrants
Figure 26 No Direct Substitute Leading to Low Impact of Threat of Substitutes on the Market
Figure 27 Moderate Technology Differentiation Leading to Medium Impact of Competition
Figure 28 Market Segmentation, By Rolling Stock
Figure 29 Freight Locomotives to H0ld the Largest Share of the Market for Electric Locomotives During the Forecast Period
Figure 30 APAC Expected to Witness the Highest Growth in the Market for Freight Locomotives Between 2016 and 2022
Figure 31 APAC to Hold the Largest Share of the Market for High-Speed Trains Between 2016 and 2022
Figure 32 North America to Witness the Highest Growth Rate in the Market for Metros Between 2016 and 2022
Figure 33 Market Segmentation, By Mounting Position
Figure 34 Underframe Mounting Position Expected to Hold the Largest Size of the Market Between 2016 and 2022
Figure 35 Market Segmentation, By Overhead Line Voltage
Figure 36 Market for AC Overhead Line to Be the Largest and Fastest-Growing Between 2016 and 2022
Figure 37 Market Segmentation, By AC Overhead Line Voltage
Figure 38 Market Segmentation, By DC Overhead Line Voltage
Figure 39 Market in the U.K. to Grow at the Highest Rate During the Forecast Period
Figure 40 North America: Market Snapshot
Figure 41 U.S. to Witness Higher Growth Rate in the North American Traction Transformer Market for Passenger Locomotives During the Forecast Period
Figure 42 Europe: Traction Transformer Market Snapshot
Figure 43 Russia Expected to Hold the Largest Share of the Market in Europe Between 2016 and 2022
Figure 44 Spain to Witness the Highest Growth Rate in the Market for Passenger Locomotives in Europe Between 2016 and 2022
Figure 45 APAC: Market Snapshot
Figure 46 China to Hold the Largest Share of the Market in APAC During the Forecast Period
Figure 47 India to Grow at the Highest CAGR in the Market for Passenger Locomotives in APAC Between 2016 and 2022
Figure 48 Middle East & Africa to Hold the Largest Share of the Market in RoW Between 2016 and 2022
Figure 49 RoW: Market Snapshot
Figure 50 Companies Adopted Contracts as the Key Growth Strategy Between 2014 and 2016
Figure 51 Battle for Market Share: Contracts Was the Key Strategy Adopted Between 2014 and 2016
Figure 52 Geographic Revenue Mix of Top Players
Figure 53 ABB Ltd.: Company Snapshot
Figure 54 ABB Ltd.: SWOT Analysis
Figure 55 Alstom SA: Company Snapshot
Figure 56 Alstom SA: SWOT Analysis
Figure 57 JST Transformateurs: SWOT Analysis
Figure 58 Mitsubishi Electric Corporation: Company Snapshot
Figure 59 Mitsubishi Electric Corporation: SWOT Analysis
Figure 60 Siemens AG: Company Snapshot
Figure 61 Siemens AG: SWOT Analysis
Figure 62 EMCO Limited: Company Snapshot
Figure 63 Hind Rectifiers Limited: Company Snapshot
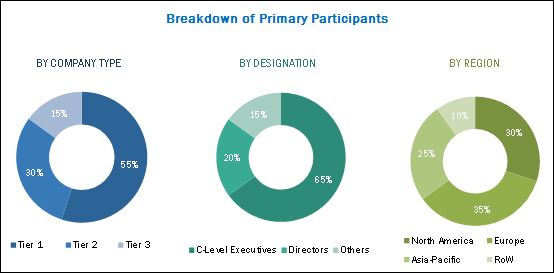
The research methodology used to estimate and forecast the traction transformer market begins with obtaining data on key vendor revenues through secondary research such as Association of the European Railway Industry (UNIFE), International Union of Public Transport (UITP), International Union of Railways (UIC), Railway Industry Association (FIF), Community of European Railway & Infrastructure Companies (CER), Railway Industry Association (RIA), National Association of Railway Transport (ANTF) (U.S.), and leading players’ annual reports and whitepapers. The vendor offerings have also been taken into consideration to determine the market segmentation. The bottom-up procedure has been employed to arrive at the overall size of the global traction transformer market from the revenue of key players. After arriving at the overall market size, the total market has been split into several segments and subsegments, which have then been verified through primary research by conducting extensive interviews of people holding key positions in the industry such as CEOs, VPs, directors, and executives. The market breakdown and data triangulation procedures have been employed to complete the overall market engineering process and arrive at the exact statistics for all segments and subsegments. The breakdown of the profiles of primaries has been depicted in the figure given below.
To know about the assumptions considered for the study, download the pdf brochure
The traction transformer ecosystem comprises component providers, OEMs, system integrators, train manufacturers, and rail network operators. The players involved in the development of traction transformer include ABB Ltd. (Switzerland), Alstom SA (France), Siemens AG (Germany), Mitsubishi Electric Corporation (Japan), and JST Transformateurs (France), among others. The BS EN 50163: 2004, IEC 60850:2014, IEC 60310, and International Railway Industry Standard (IRIS) are among the major regulatory standards for the traction transformers.
Target Audience of the Report:
- Government bodies, venture capitalists, and private equity firms
- Manufacturers of components such as traction motors, drives, rectifiers, and other instruments
- Rolling stock manufacturers
- Rolling stock maintenance companies
- Rail network operators
- Research institutes, associations, and organizations
- Traction transformer manufacturers
This study answers several questions for the stakeholders, primarily which market segments to focus on in the next two to five years for prioritizing efforts and investments.
Scope of the Report:
In this research report, the global traction transformer market has been segmented on the basis of rolling stock, mounting position, overhead line voltage, and geography.
Traction Transformer Market, by Rolling Stock:
-
Electric Locomotives
- Freight Locomotives
- Passenger Locomotives
- High-speed Trains
- Metros
Traction Transformer Market, by Mounting Position:
- Underframe
- Machine Room
- Roof
Traction Transformer Market, by Overhead Line Voltage:
-
AC
- 1.2 KV
- 15 KV
- 20 KV
- 25KV
-
DC
- 0.75 KV
- 1.5KV
- 3 KV
Traction Transformer Market, by Geography:
- North America
- Europe
- Asia-Pacific (APAC)
- Rest of the World (RoW)
Available Customizations:
With the given market data, MarketsandMarkets offers customizations according to the companies’ specific needs. The following customization options are available for the report:
Company Information:
- Detailed analysis and profiling of additional market players (up to five)
- Detailed analysis of electric multiple units (EMUs)


Growth opportunities and latent adjacency in Traction Transformer Market