Ultrasonic Flow Meter Market by Implementation Type (Clamp-On and Inline), Measurement Technology, Number of Paths (1 Path Transit-Time, 2 Path Transit-Time, and 3 and Above Path Transit-Time), End-User, Region - Global Forecast to 2024


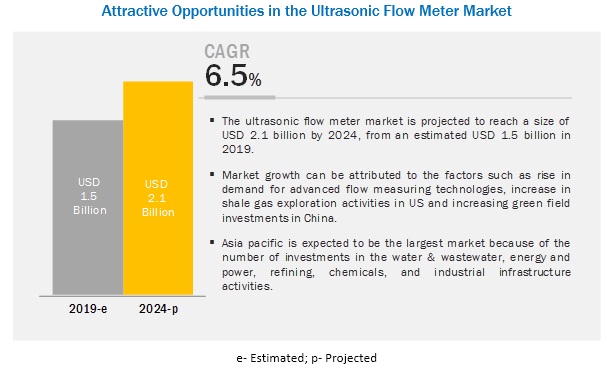
[135 Pages Report] The ultrasonic flow meter market is projected to reach a size of USD 2.1 billion by 2024, at a CAGR of 6.5% from an estimated USD 1.5 billion in 2019. This growth can be attributed to factors such as increasing green field investments in China, rise in demand for advanced flow measuring technologies, and increase in shale gas exploration activities in the US.
The transit-time is expected to be the largest contributor during the forecast period.
The ultrasonic flow meter market, by measurement technology, is segmented into transit-time, doppler, and hybrid. The transit-time is expected to hold the largest market share with the fastest growing market because of its bi-directional and precise flow measurement advantages. It comprises 80�85% of the total market share globally. This technology is cost effective compared to doppler and hybrid technology. It is majorly used by oil & gas and water & wastewater industry to measure the flow of liquid and gases.
Oil & gas is expected to be the fastest growing market during the forecast period.
The ultrasonic flow meter market, by end-user, is segmented into oil & gas, water & wastewater, and power generation. The oil & gas segment is accounted to be the fastest growing market for ultrasonic flow meter because of the precise accuracy flow measurement requirement in custody transfer applications. It is also applicable for pump testing & inspection, methanol & water injection metering, verification of in-line meters, and water measurements. Some of the key players using ultrasonic flow meters in this segment are Cameron, Katronic, Endress+Hauser, Krohne, and Emerson. As per BP stats 2019, Saudi Arabia's gas production has been rising at 4�5% per year, which is expected to drive the demand for ultrasonic flow meter in the coming years.
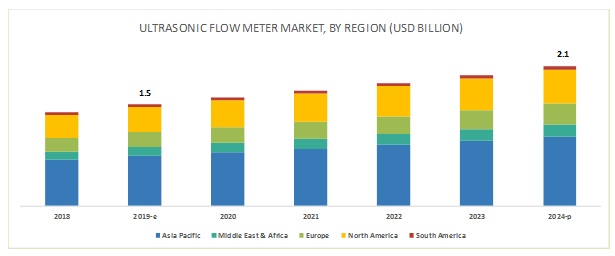
Asia Pacificis expected to account for the largest market size during the forecast period.
In this report, the ultrasonic flow meter market has been analyzed with respect to 5 regions, namely, North America, Europe, South America, Asia Pacific, and the Middle East & Africa. The market in Asia pacific is estimated to be the largest market from 2019 to 2024. The growth of this region is primarily driven by the Asia Pacific region as most of the key players operating in the flow meters market have their manufacturing plants in Asia Pacific, since the production cost in this region is lower than other regions. The number of investments in water & wastewater, energy and power, refining, chemicals, and industrial infrastructure activities is increasing in the developing economies such as China and India which drives the demand for measuring instruments.
Key Market Players
The ultrasonic flow meter market is dominated by a few major players that have a wide regional presence. The leading players in the market are Siemens (Germany), Danfoss (Denmark), Fuji Electric (Japan), Badger Meter (US), GE (US), Endress+Hauser (Switzerland), Honeywell (US), and KROHNE (Germany).
Siemens (Germany) is actively investing in its R&D activities to develop innovative and sustainable solutions for its customers. It is also continuously concentrating on digital transformation of products, solutions, and services, especially in information and communication technologies. This might help the company to develop a larger footprint in the global ultrasonic flowmeter market.
Endress+Hauser (Switzerland) is one of the leading suppliers of products, solutions, and services for industrial process measurement and automation. The company increased its portfolio for analytical devices and measurement instruments and has strengthened its international production and sales presence. Moreover, the company mainly focuses on acquisition and expansion as the main strategy, which is expected to expand its business globally.
Scope of the Report
|
Report Metric |
Details |
|
Market size available for years |
2017�2024. |
|
Base year considered |
2018. |
|
Forecast period |
2019�2024. |
|
Forecast units |
Value (USD). |
|
Segments covered |
Implementation Type, Measurement Technology, Number of Paths, End-User, And Region. |
|
Geographies covered |
Asia Pacific, Europe, North America, South America, and the Middle East & Africa. |
|
Companies covered |
Siemens (Germany), Danfoss (Denmark), Fuji Electric (Japan), Badger Meter (US), GE (US), Endress+Hauser (Switzerland), Honeywell (US), Teledyne (US), Bronkhorst (Netherlands), EESIFLO (Czech Republic), Katronic (UK), KROHNE (Germany), CMC Technologies (Australia). |
This research report categorizes the market based on implementation type, measurement technology, number of paths, end-user, and region
On the basis of implementation type:
- Clamp-on
- Inline
- Others (wall-mounted & hand-held)
On the basis of measurement technology:
- Transit-time
- Doppler
- Hybrid
On the basis of number of paths:
- 1 path transit-time
- 2 path transit-time
- 3 and above path transit-time
On the basis of end-user:
- Oil & gas
- Power Generation
- Water & wastewater
- chemical, food & beverage, pharmaceuticals, and paper & pulp industries)
On the basis of region:
- Asia Pacific
- Europe
- North America
- South America
- Middle East & Africa
Recent Developments
- In February 2019, KROHNE launched the OPTISONIC 7300 biogas ultrasonic flowmeter for the measurement of dry and wet (raw) biogas with variable composition.
Key Questions addressed by the report
- The report identifies and addresses key ultrasonic flow meter market, which would help various stakeholders such as utilities, process industries, power & energy associations, ultrasonic flow meter manufacturers, and dealers and suppliers to review the growth in demand.
- The report helps system providers understand the pulse of the market and provides insights into drivers, restraints, opportunities, and challenges.
- The report will help key players understand the strategies of their competitors better and make better strategic decisions.
- The report addresses the market share analysis of key players in the ultrasonic flow meter market, with the help of this, companies can enhance their revenues in the respective market.
- The report provides insights about emerging geographies for the market, and hence, the entire market ecosystem can gain a competitive advantage from such insights.
To speak to our analyst for a discussion on the above findings, click Speak to Analyst
 Exclusive indicates content/data unique to MarketsandMarkets and not available with any competitors.
Table of Contents
1 Introduction (Page No. - 16)
1.1 Objectives of the Study
1.2 Definition
1.3 Market Scope
1.3.1 Market Segmentation
1.3.2 Regional Scope
1.4 Years Considered for the Study
1.5 Currency
1.6 Limitations
1.7 Stakeholders
2 Research Methodology (Page No. - 20)
2.1 Market Size Estimation
2.1.1 Ideal Demand-Side Analysis
2.1.1.1 Assumptions
2.1.2 Supply-Side Analysis
2.1.2.1 Calculation
2.1.3 Framework of Market Assessment
2.1.4 Forecast
2.2 Some of the Insights of Industry Experts
3 Executive Summary (Page No. - 23)
4 Premium Insights (Page No. - 27)
4.1 Attractive Opportunities in the Ultrasonic Flow Meter Market During the Forecast Period
4.2 Market, By Region
4.3 Market, By Implementation Type & Region
4.4 Market, By Measurement Technology
4.5 Market, By Number of Paths
4.6 Market, By End-User
5 Market Overview (Page No. - 31)
5.1 Introduction
5.2 Market Dynamics
5.2.1 Drivers
5.2.1.1 Need for Accurate Measurement
5.2.1.2 Growing Demand in Oil & Gas and Water & Wastewater Industries
5.2.1.3 Ease of Operation
5.2.2 Restraints
5.2.2.1 High Initial Cost of Ultrasonic Flow Meters
5.2.2.2 Inaccurate Measurements in the Vertically Downward Flow Line
5.2.3 Opportunities
5.2.3.1 Increasing Demand for Smart and Intelligent Flow Meters
5.2.4 Challenges
5.2.4.1 Lower Adoption Rate Compared to Traditional Flow Meters
6 Market, By Implementation Type (Page No. - 35)
6.1 Introduction
6.2 Clamp-On
6.2.1 Measuring Flow Without Interruption Feature is Expected to Drive the Demand for Clamp-On Ultrasonic Flow Meters
6.3 Inline
6.3.1 Need for Precise Accuracy in Flow Measurement is Likely to Increase the Demand for Inline Ultrasonic Flow Meters
6.4 Others
7 Market, By Measurement Technology (Page No. - 39)
7.1 Introduction
7.2 Transit-Time
7.2.1 Bidirectional and Precise Flow Measurement is Expected to Drive the Transit-Time Technology Segment of the Market
7.3 Doppler
7.3.1 Measurement of Flow Containing Bubbles and Particles is Likely to Drive the Doppler Segment of the Market
7.4 Hybrid
7.4.1 Advanced Measurement of Clean, Solids-Bearing, and Gaseous Liquids is Expected to Drive the Hybrid Segment of the Market
8 Market, By Number of Paths (Page No. - 44)
8.1 Introduction
8.2 1 Path Transit-Time
8.2.1 Cost-Effective Flow Measurement is Expected to Drive the 1 Path Transit-Time Technology
8.3 2 Path Transit-Time
8.3.1 Better Accuracy at Low Cost is Expected to Drive the 2 Path Transit-Time Technology
8.4 3 & Above Path Transit-Time
8.4.1 Precise Accuracy in Flow Measurement is Likely to Increase the Demand for 3 & Above Path Transit-Time Technology in the Ultrasonic Flow Meter Market
9 Market, By End-User (Page No. - 49)
9.1 Introduction
9.2 Oil & Gas
9.2.1 Precise Flow Measurement is Expected to Drive the Demand for Oil & Gas Segment of the Ultrasonic Flow Meter Market
9.3 Power Generation
9.3.1 Better Accuracy With Ease of Operation is Expected to Drive the Power Generation Segment of the Ultrasonic Flow Meter Market
9.4 Water & Wastewater
9.4.1 Reliable and Accurate Flow Measurement With No Interruption in the Water Supply is Expected to Drive the Demand for the Water & Wastewater Segment of the Market
9.5 Others
10 Market, By Region (Page No. - 54)
10.1 Introduction
10.2 Asia Pacific
10.2.1 By Implementation Type
10.2.2 By Measurement Technology
10.2.3 By Number of Paths
10.2.4 By End-User
10.2.5 By Country
10.2.6 China
10.2.6.1 Greenfield Investments in Oil & Gas and Power Generation Industries are Expected to Drive the Demand for the Chinese Market
10.2.7 India
10.2.7.1 Increasing Import of Oil is Likely to Boost the Indian Market
10.2.8 Japan
10.2.8.1 Increasing Demand for Power Generation & Advanced Manufacturing Technologies are Likely to Drive the Demand for the Japanese Market
10.2.9 Australia
10.2.9.1 Growing Demand for Accurate Gas Flow Measurement is Expected to Drive the Market
10.2.10 South Korea
10.2.10.1 Increasing R&D Capabilities and Infrastructural Activities are Expected to Drive the Demand for the Market
10.2.11 Malaysia
10.2.11.1 Growing Exports and Imports and Enhancing the Existing Oil & Gas Fields are Likely to Boost the Demand for the Malaysian Ultrasonic Flow Meter
10.2.12 Rest of Asia Pacific
10.3 Europe
10.3.1 By Implementation Type
10.3.2 By Measurement Technology
10.3.3 By Number of Paths
10.3.4 By End-User
10.3.5 By Country
10.3.6 Germany
10.3.6.1 Growing Natural Gas and Water & Wastewater Industries in Germany are Likely to Drive the Market
10.3.7 UK
10.3.7.1 Rising Demand for Accurate Flow Measuring Devices is Likely to Boost the UK Market
10.3.8 Spain
10.3.8.1 Increasing Coal-Based Power Generation and Measurement Requirements in the Water & Wastewater Industry are Expected to Drive the Demand for the Spanish Market
10.3.9 Italy
10.3.9.1 Power Generation and Exports From Industries Such as Food & Beverage and Pulp & Paper and are Likely to Boost the Italian Market
10.3.10 Rest of Europe
10.4 North America
10.4.1 By Implementation Type
10.4.2 By Measurement Technology
10.4.3 By Number of Paths
10.4.4 By End-User
10.4.5 By Country
10.4.6 US
10.4.6.1 Rise in Shale Gas Reserves Exploration Activities is Expected to Increase the Demand for the US Market
10.4.7 Canada
10.4.7.1 Growing Water & Wastewater Industry is Likely to Drive the Demand for the Canadian Market
10.4.8 Mexico
10.4.8.1 Growing Water & Wastewater Industry and Investments By Key Players are Expected to Increase the Demand for the Mexican Market
10.5 Middle East & Africa
10.5.1 By Implementation Type
10.5.2 By Measurement Technology
10.5.3 By Number of Paths
10.5.4 By End-User
10.5.5 By Country
10.5.6 Saudi Arabia
10.5.6.1 Rapidly Expanding Oil & Gas Industry is Likely to Drive the Demand for the Saudi Arabian Market
10.5.7 UAE
10.5.7.1 Increasing Investments and Oil & Gas Activities in the Country are Likely to Boost the Market
10.5.8 Iran
10.5.8.1 Increase in Demand for Crude Oil is Expected to Boost the Iranian Market
10.5.9 South Africa
10.5.10 Rest of Middle East & Africa
10.5.9.1 Growing Food Processing, Power Generation, and Chemical Industries are Expected to Boost the South African Market
10.6 South America
10.6.1 By Implementation Type
10.6.2 By Measurement Technology
10.6.3 By Number of Paths
10.6.4 By End-User
10.6.5 By Country
10.6.6 Brazil
10.6.6.1 Increase in Shale Gas Production is Expected to Drive the Brazilian Market
10.6.7 Argentina
10.6.7.1 Domestic Gas Market and Export Infrastructure are Expected to Boost the Demand for the Argentinian Ultrasonic Flow Meter
10.6.8 Rest of South America
11 Competitive Landscape (Page No. - 90)
11.1 Introduction
11.2 Market Share Analysis
11.3 Competitive Scenario
11.3.1 New Product Launches
11.3.2 Mergers & Acquisitions
11.3.3 Investments & Expansions
11.3.4 Collaborations
11.4 Competitive Leadership Mapping
11.4.1 Visionary Leaders
11.4.2 Innovators
11.4.3 Dynamic
11.4.4 Emerging
12 Company Profile (Page No. - 96)
(Overview, Products Offered, Recent Developments, and MnM View)*
12.1 Badger Meter
12.2 Danfoss
12.3 Emerson
12.4 Endress+Hauser
12.5 Fuji Electric
12.6 GE
12.7 Honeywell
12.8 Siemens
12.9 Teledyne
12.10 Bronkhorst
12.11 Eesiflo
12.12 Katronic
12.13 KROHNE
12.14 CMC Technologies
*Details on Overview, Products Offered, Recent Developments, and MnM View Might Not Be Captured in Case of Unlisted Companies.
13 Appendix (Page No. - 128)
13.1 Insights of Industry Experts
13.2 Discussion Guide
13.3 Knowledge Store: Marketsandmarkets� Subscription Portal
13.4 Available Customizations
13.5 Related Reports
13.6 Author Details
List of Tables (70 Tables)
Table 1 Estimation of Total Installed Units Across Major End-User Industry is the Determining Factor for the Global Market
Table 2 Global Ultrasonic Flow Meter Market Snapshot
Table 3 Flow Meters and their Accuracy
Table 4 Market Size, By Implementation Type, 2017�2024 (USD Million)
Table 5 Clamp-On: Ultrasonic Flow Meter Market Size, By Region, 2017�2024 (USD Million)
Table 6 Inline: Market Size, By Region, 2017�2024 (USD Million)
Table 7 Others: Market Size, By Region, 2017�2024 (USD Million)
Table 8 Market Size, By Measurement Technology, 2017�2024 (USD Million)
Table 9 Transit-Time: Ultrasonic Flow Meter Market Size, By Region, 2017�2024 (USD Million)
Table 10 Doppler: Market Size, By Region, 2017�2024 (USD Million)
Table 11 Hybrid: Market Size, By Region, 2017�2024 (USD Million)
Table 12 Ultrasonic Flow Meter Markt Size, By Number of Paths, 2017�2024 (USD Million)
Table 13 1 Path Transit-Time: Ultrasonic Flow Meter Market Size, By Region, 2017�2024 (USD Million)
Table 14 2 Path Transit-Time: Market Size, By Region, 2017�2024 (USD Million)
Table 15 3 & Above Path Transit-Time: Market Size, By Region, 2017�2024 (USD Million)
Table 16 Market Size, By End-User, 2017�2024 (USD Million)
Table 17 Oil & Gas: Market Size, By Region, 2017�2024 (USD Million)
Table 18 Power Generation: Ultrasonic Flow Meter Market Size, By Region, 2017�2024 (USD Million)
Table 19 Water & Wastewater: Market Size, By Region, 2017�2024 (USD Million)
Table 20 Others: Market Size, By Region, 2017�2024 (USD Million)
Table 21 Market Size, By Region, 2017�2024 (USD Million)
Table 22 Asia Pacific: Ultrasonic Flow Meter Market Size, By Implementation Type, 2017�2024 (USD Million)
Table 23 Asia Pacific: Market Size, By Measurement Technology, 2017�2024 (USD Million)
Table 24 Asia Pacific: Market Size, By Number of Paths, 2017�2024 (USD Million)
Table 25 Asia Pacific: Market Size, By End-User, 2017�2024 (USD Million)
Table 26 Asia Pacific: Market Size, By Country, 2017�2024 (USD Million)
Table 27 China: Ultrasonic Flow Meter Market Size, By End-User, 2017�2024 (USD Million)
Table 28 India: Market Size, By End-User, 2017�2024 (USD Million)
Table 29 Japan: Market Size, By End-User, 2017�2024 (USD Million)
Table 30 Australia: Market Size, By End-User, 2017�2024 (USD Million)
Table 31 South Korea: Ultrasonic Flow Meter Market Size, By End-User, 2017�2024 (USD Million)
Table 32 Malaysia: Market Size, By End-User, 2017�2024 (USD Million)
Table 33 Rest of Asia Pacific: Market Size, By End-User, 2017�2024 (USD Million)
Table 34 Europe: Ultrasonic Flow Meter Market Size, By Implementation Type, 2017�2024 (USD Million)
Table 35 Europe: Market Size, By Measurement Technology, 2017�2024 (USD Million)
Table 36 Europe: Market Size, By Number of Paths, 2017�2024 (USD Million)
Table 37 Europe: Market Size, By End-User, 2017�2024 (USD Million)
Table 38 Europe: Market Size, By Country, 2017�2024 (USD Million)
Table 39 Germany: Ultrasonic Flow Meter Market Size, By End-User, 2017�2024 (USD Million)
Table 40 UK: Market Size, By End-User, 2017�2024 (USD Million)
Table 41 Spain: Ultrasonic Flow Meter Market Size, By End-User, 2017�2024 (USD Million)
Table 42 Italy: Market Size, By End-User, 2017�2024 (USD Million)
Table 43 Rest of Europe: Market Size, By End-User, 2017�2024 (USD Million)
Table 44 North America: Market Size, By Implementation Type, 2017�2024 (USD Million)
Table 45 North America: Market Size, By Measurement Technology, 2017�2024 (USD Million)
Table 46 North America: Market Size, By Number of Paths, 2017�2024 (USD Million)
Table 47 North America: Market Size, By End-User, 2017�2024 (USD Million)
Table 48 North America: Market Size, By Country, 2017�2024 (USD Million)
Table 49 US: Market Size, By End-User, 2017�2024 (USD Million)
Table 50 Canada: Market Size, By End-User, 2017�2024 (USD Million)
Table 51 Mexico: Market Size, By End-User, 2017�2024 (USD Million)
Table 52 Middle East & Africa: Ultrasonic Flow Meter Market Size, By Implementation Type, 2017�2024 (USD Million)
Table 53 Middle East & Africa: Market Size, By Measurement Technology, 2017�2024 (USD Million)
Table 54 Middle East & Africa: Market Size, By Number of Paths, 2017�2024 (USD Million)
Table 55 Middle East & Africa: Market Size, By End-User, 2017�2024 (USD Million)
Table 56 Middle East & Africa: Market Size, By Country, 2017�2024 (USD Million)
Table 57 Saudi Arabia: Size, By End-User, 2017�2024 (USD Million)
Table 58 UAE: Market Size, By End-User, 2017�2024 (USD Million)
Table 59 Iran: Market Size, By End-User, 2017�2024 (USD Million)
Table 60 South Africa: Market Size, By End-User, 2017�2024 (USD Million)
Table 61 Rest of Middle East & Africa: Market Size, By End-User, 2017�2024 (USD Million)
Table 62 South America: Ultrasonic Flow Meter Market Size, By Implementation Type, 2017�2024 (USD Million)
Table 63 South America: Market Size, By Measurement Technology, 2017�2024 (USD Million)
Table 64 South America: Market Size, By Number of Paths, 2017�2024 (USD Million)
Table 65 South America: Market Size, By End-User, 2017�2024 (USD Million)
Table 66 South America: Market Size, By Country, 2017�2024 (USD Million)
Table 67 Brazil: Market Size, By End-User, 2017�2024 (USD Million)
Table 68 Argentina: Market Size, By End-User, 2017�2024 (USD Million)
Table 69 Rest of South America: Market Size, By End-User, 2017�2024 (USD Million)
Table 70 Developments By Key Players in the Market, January 2016�April 2019
List of Figures (34 Figures)
Figure 1 Market: Top Players
Figure 2 Clamp-On Segment is Expected to Lead the Market During the Forecast Period
Figure 3 Transit-Time Segment is Expected to Lead the Market During the Forecast Period
Figure 4 1 Path Transit-Time Segment is Expected to Lead the Market During the Forecast Period
Figure 5 Oil & Gas Segment is Expected to Lead the Market During the Forecast Period
Figure 6 Asia Pacific is Expected to Dominate the Market in Terms of Cagr (2019�2024)
Figure 7 Increasing Investments in Oil & Gas, Power Generation, and Water & Wastewater Industries are Expected to Drive the Market, 2019�2024
Figure 8 Europe Market is Expected to Grow at the Highest Cagr During the Forecast Period
Figure 9 Clamp-On Segment and Asia Pacific Dominated the Market in 2018
Figure 10 Transit-Time Segment is Expected to Dominate the Market, By Measurement Technology, During the Forecast Period
Figure 11 1 Path Transit-Time Segment is Expected to Dominate the Market, By Number of Paths, During the Forecast Period
Figure 12 Oil & Gas Segment is Expected to Dominate the Market, By End-User, During the Forecast Period
Figure 13 Market: Drivers, Restraints, Opportunities, and Challenges
Figure 14 Natural Gas Production in 2017
Figure 15 Clamp-On Segment is Expected to Account for the Largest Market Share in 2018
Figure 16 Transit-Time Segment Accounted for the Largest Market Share in 2018
Figure 17 1 Path Transit-Time Segment Accounted for the Largest Market Share in 2018
Figure 18 Oil & Gas Segment Accounted for the Largest Market Share in 2018
Figure 19 Regional Snapshot: European Market is Expected to Grow at the Highest Cagr During the Forecast Period
Figure 20 Market Share (Value), By Region, 2018
Figure 21 Asia Pacific: Regional Snapshot
Figure 22 Europe: Regional Snapshot
Figure 23 Key Developments in the Market During January 2016�April 2019
Figure 24 Market Share Analysis, 2018
Figure 25 Market (Global) Competitive Leadership Mapping, 2018
Figure 26 Badger Meter: Company Snapshot
Figure 27 Danfoss: Company Snapshot
Figure 28 Emerson: Company Snapshot
Figure 29 Endress+Hauser: Company Snapshot
Figure 30 Fuji Electric: Company Snapshot
Figure 31 GE: Company Snapshot
Figure 32 Honeywell: Company Snapshot
Figure 33 Siemens: Company Snapshot
Figure 34 Teledyne: Company Snapshot
This study involves major activities in estimating the current size of the ultrasonic flow meter market. Exhaustive secondary research was done to collect information on the market, the peer market, and the parent market. The next step was to validate these findings, assumptions, and market sizing with industry experts across the value chain through primary research. Both top-down and bottom-up approaches were used to estimate the total market size. Thereafter, the market breakdown and data triangulation was done to estimate the market size of the segments and subsegments.
Secondary Research
This research study involved the use of extensive secondary sources, directories, and databases, such as Hoover�s, Bloomberg BusinessWeek, Factiva, and OneSource, to identify and collect information useful for a technical, market-oriented, and commercial study of the market. The other secondary sources included annual reports, press releases & investor presentations of companies, white papers, certified publications, articles by recognized authors, manufacturer associations, trade directories, and databases.
Primary Research
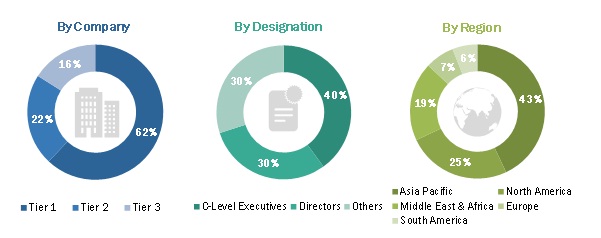
The ultrasonic flow meter market comprises several stakeholders such as energy utilities, government and research organisations, institutional investors, shareholders, ultrasonic flow meter drives� manufacturers, dealers, and suppliers. The demand side of this market is characterized by its end-users such as oil & gas, power generation, water & wastewater, and others (chemical, food & beverage, pharmaceuticals, and paper & pulp industries). Various primary sources from both the supply and demand sides of the market were interviewed to obtain qualitative and quantitative information. The breakdown of the primary respondents is as follows:
To know about the assumptions considered for the study, download the pdf brochure
Market Size Estimation
Both top-down and bottom-up approaches have been used to estimate and validate the size of the ultrasonic flow meter market and its dependent submarkets. These methods were also used extensively to estimate the size of various subsegments in the market. The research methodology used to estimate the market size includes the following:
- The key players in the industry and market have been identified through extensive secondary research and their market share in the respective regions have been determined through both primary and secondary research.
- The industry�s supply chain and market size, in terms of value, has been determined through primary and secondary research processes.
- All percentage shares, splits, and breakdowns have been determined using secondary sources and verified through primary sources.
Data Triangulation
After arriving at the overall market size-using the market size estimation processes as explained above-the market was split into several segments and subsegments. To complete the overall market engineering process and arrive at the exact statistics of each market segment and subsegment, the data triangulation and market breakdown procedures were employed, wherever applicable. The data was triangulated by studying various factors and trends from both, the demand and supply sides, in the oil & gas, power generation, water & wastewater, chemicals, food & beverage, pharmaceuticals, and paper & pulp industries.
Report Objectives
- To define, describe, and forecast the market by implementation type, measurement technology, number of paths, end-user, and region
- To provide detailed information on the major factors influencing the growth of the market (drivers, restraints, opportunities, and industry-specific challenges)
- To strategically analyze the market with respect to individual growth trends, prospects, and contribution of each segment to the market
- To analyze the market opportunities for stakeholders and details of the competitive landscape for market leaders
- To forecast the growth of the market with respect to the regions (Asia Pacific, Europe, North America, South America, and the Middle East & Africa)
- To strategically profile key players and comprehensively analyze their market rankings and core competencies
- To track and analyze the competitive developments such as contracts & agreements, expansions, new product developments, mergers & acquisitions, and partnerships in the market.
Available Customizations:
With the given market data, MarketsandMarkets offers customizations as per the client�s specific needs. The following customization options are available for this report:
Regional Analysis
- Further breakdown of the region or country-specific analysis
Company Information
- Detailed analysis and profiling of additional market players (up to 5)


Growth opportunities and latent adjacency in Ultrasonic Flow Meter Market